
Abstract
Increasing attention has been paid to rural education policy and research, yet few studies have examined the conceptualization of rural school districts. This study provides a conceptual and empirical examination of the definitions of rural districts. The results illustrate that a common, singular definition of rural is elusive and there is a prevailing notion of rural as “not urban.” Regardless of the operationalization of rurality, there are statistically significant differences across urban and rural districts in terms of their size, complexity, demographic composition, segregation, educational resources, economic structure, economic and social context, and academic and equity-related outcomes. Implications are discussed.
Keywords
In recent decades, increasing attention has been paid to rural education policy and research. Federal support in funding or policy direction, state-level initiatives, and research efforts such as Harvard National Center for Rural Education Research Networks have drawn attention to rural education issues. There are more students enrolled in rural schools across the country than in the 85 largest school districts combined, and rural communities have received more attention since the 2016 election (Showalter et al., 2019). Yet, precisely and meaningfully defining the “rural” in rural education is a complex and ongoing challenge (Arnold et al., 2005; Burdick-Will & Logan, 2017; Hawley et al., 2016; Kettler et al., 2016). Definitions are foundational to apprehending the magnitude of the phenomenon and crafting commensurate solutions in public education. The definitional gap that afflicts urban education (Gadsden & Dixon-Román, 2017; Irby, 2015; Milner, 2012a; Milner & Lomotey, 2013; Welsh, 2021; Welsh & Swain 2020) is also present in rural education.
Relatively few studies have examined the definition and operationalization of rural education (Burdick-Will & Logan, 2017; Hawley et al., 2016; Isserman, 2005; Kettler et al., 2016). Defining and operationalizing rural education establishes policy “boundaries” (Stone, 1997). The conceptualization of rural education shapes the perceptions, understanding, expectations, and practices of educators as well as policymakers. Although there is growing attention to the conditions of rural education, in many ways, there's an urban-centric or “big city” bias among the topics researched in education as researchers tend to focus solely on urban districts or pay relatively little attention to the urban/rural distinctions (Burdick-Will & Logan, 2017; Duke & VanGronigen, 2021; Hunt et al., 2019). Prior scholars have highlighted the importance and implications of defining rural education research for research design and quality (Arnold et al., 2005; Kettler et al., 2016). The nuances of defining urban and rural education are also important to school improvement conversations (Welsh & Hall, 2018; Welsh & Swain, 2020).
This study extends the tradition of questioning the boundaries of education policy and research in substantive ways. Milner (2012a) problematized the definition of urban education and highlighted the complexities in distinguishing between urban and rural districts and schools. The differences between Milner's (2012a) conceptualization and that of the Superintendent of a small Midwestern district remain germane today and are encapsulated by the assertion that “[t]his was not an urban district in my mind; it was a rural one” (p.556; Milner, 2012a). Schools in rural areas that struggle academically are typically called “urban schools.” In many ways, Milner (2012a) highlighted that urban and rural education are implicitly linked in their construction among educational stakeholders. This study posits that an important component of answering the question “But what is urban education?” is the consideration of the parallel question “But what is rural education?” What the field defines as urban education is related to and informed by the shared definition of rural education. As scholars continue to refine the conceptual frames of what is meant by urban education (Milner 2012a; Milner & Lomotey, 2021; Welsh & Swain), a richer understanding of the evolving conceptualization of rural education contributes to the development of “transformative knowledge in urban education” (Milner 2012b).
This study provides a conceptual and empirical examination of the definitions of rural education and the distinctions between rural and urban education. First, a literature review was conducted to identify definitions and operationalizations of rural education before using a national district-level dataset to examine the differences among the empirical definitions of rural school districts. Next, this study examines the differences between urban and rural school districts nationwide. This study adds to the discourse on establishing the urbanicity and rurality of school districts in the United States (U.S.). Prior studies empirically examining the definition of rural education have been limited to cross-sectional statewide data (Burdick-Will & Logan, 2017; Greenough & Nelson, 2015; Hawley et al., 2016; Kettler et al., 2016). This study builds on prior research that have problematized the rural-urban divide and explored salient differences in the schooling environments across rural, urban, and suburban contexts (Burdick-Will & Logan, 2017; Duke & VanGronigen, 2021; Lee et al., 2020; Peguero et al., 2021; Strayhorn, 2009). I compare and contrast multiple categorizations of rural and urban education beyond the National Center for Education Statistics (NCES) locale code. I also expand the indicators along which districts are compared from a limited set of demographics and academic indicators to a robust set of education finance, academic and equity-related outcomes, and neighborhood attributes. The resulting insights inform theory, policy, and practice in rural and urban education. The results provide a richer understanding of the nuanced differences and similarities between the contexts of urban and rural districts. In what follows, I first describe the data and methods employed in this study before presenting the results. I conclude with a discussion of implications and directions for future research.
Data and Methods
Literature Search
This study builds on a handful of previous reviews on the definition of rural education in empirical studies published between 1991 and 2015 (Arnold et al., 2005; Hawley et al., 2016; Kettler et al., 2016). First, I conduct a literature review to identify prior research that has addressed the definition of rural education spanning the period 2010–2020, with a particular emphasis on recent studies (2015–2020) as well as seminal studies published before 2015. This study considers both conceptual and empirical studies that have examined the conceptualization and definition of rural education. I include peer-reviewed articles, book chapters, and reports focused on the definition of rurality in K-12 schools. A multi-phase process was used to identify studies for inclusion. Studies were obtained from systematic searches of various databases spanning several academic fields. I developed effective full-text search strings to identify studies, and each search string included plural forms of search words. Separated by the Boolean term “AND” I paired the term “rural” with the following search words: “education,” “educational” “school,” and “district.”
Forty-five studies were flagged as possibly meeting the inclusion criteria of: (a) written in English (b) focused on a K-12 student sample in the U.S., and (c) examined the definition and conceptualization of rural education. Duplicates were removed from the retrieved citations and the titles and abstracts of studies were screened. Following the initial search of databases and abstract review, roughly 20 articles were selected. The full articles were then retrieved, read, and screened to ensure that all studies met the criteria for inclusion. Articles were excluded if (a) the study focused on rural education outside of the U.S. or (b) one of the aforementioned areas of interest (conceptualization, definition, or features/characteristics) was not the main focus of the study. Ancestral searches from the references list of the included articles were conducted to identify and select additional studies. Ultimately, 25 studies were included in the literature synthesis. To be clear, the review does not take stock of the entirety of the literature on rural education but rather those studies that have specifically problematized what rural schools are.
Examining Operationalizations of Rural School Districts
I use district-level national data for the school year, 2013–2014, to examine differences across operationalizations of rural school districts (see Table 1). I compare definitions of rural districts across: (a) district demographic composition and segregation, (b) educational resources, (c) economic structure and economic and social context, and (d) student achievement and equity-related outcomes. Next, I use t-tests to examine the statistically significant differences between urban districts (as defined by the NCES locale code) and the various definitions of rural districts.
Defining and Operationalizing Rural School Districts.
The district-level data used in this study comes from four different sources. First, I start with a district-level longitudinal dataset from the Stanford Education Data Archive (SEDA) Version 2.1 (Reardon et al., 2018). The data captures the demographic, socioeconomic and the academic achievement characteristics of nearly 22 million public school students annually in all school districts nationwide. For student achievement gaps, I use grade cohort standardized scale test scores at the district level, aggregated across grades 3 through 8. I supplement achievement data from SEDA with data on the percentage of students proficient in math and reading from the Urban Institute Education Data Explorer-District Files.
I then link data from the School Funding Fairness Data Systems (Baker, Srikanth, et al., 2016) that provide information on school funding, staffing, and expenditures at the district level using unique district identifiers. Finally, I merge variables from the Civil Rights Data Collection (CRDC) from the Office of Civil Rights (OCR) that provides information on access to rigorous courses, school discipline, and chronic absenteeism in the 2013–2014 school year. Access to rigorous courses is captured by the percentage of students enrolled in Advanced Placement (AP) and International Baccalaureate (IB) courses including: (a) enrollment in AP courses, (b) enrollment in AP science, (c) enrollment in AP math, (d) enrollment in AP other, (e) enrollment in IB program, (f) enrollment in gifted program, and (g) students who took one or more AP exam. School discipline measures capture both the rates and disparities in different types of suspensions. Specifically, I include suspension rates for both in-school suspensions (ISS) and out-of-school suspensions (OSS) (both single OSS and multiple OSS). I also examine the percentage of students expelled and arrested. Chronic absenteeism (defined by the CRDC as students absent 15 or more school days) is measured using the percentage of chronically absent students.
Data Limitations
The missingness of data is pertinent to the analyses. Missingness in the SEDA data affects achievement outcomes. First, in the 2013–2014 school year, there are several states and counties that do not appear in the SEDA test file at all, largely for two reasons: (a) issues with the administration of state testing and (b) low testing rates due to student opt-out movements. The following states/counties do not appear in the SEDA test file at all in certain years: (a) In 2014, California testing data are not available—CAASPP administered on a trial basis, (b) In 2014, Washington testing data are not available—Smarter Balanced test administered on a trial basis in 2014. I consider records that appear in all other files but are only missing in the SEDA test file as “complete,” since it appears that these records may be legitimately excluded from that file.
Results
Conceptualizing and Defining Rural Education
Similar to urban education (Milner, 2012a; Milner & Lomotey, 2013, 2021; Welsh & Swain, 2020), the results of the literature review indicate that conceptualizing and defining rural education is complex. There is no universally accepted definition of rural education among educational researchers that best describes the complicated and dynamic theoretical construct of rurality (Arnold et al., 2005; Coburn et al., 2007; Coladarci, 2007; Cromartie & Bucholtz, 2008; Hart et al., 2005; Howley et al., 2005, 2016). Definitions of rurality are inconsistent (classifications of rural vary across government agencies) and a nontrivial proportion of empirical studies do not include operationalization of the definition of rural (Hawley et al., 2016; Kettler et al., 2016). Hawley et al. (2016) reviewed studies published in the rural special education quarterly between 2011 and 2014 and found that there was a lack of attention to defining rural and its distinguishing features. Moreover, there is wide variation in how rural areas are defined and operationalized across studies.
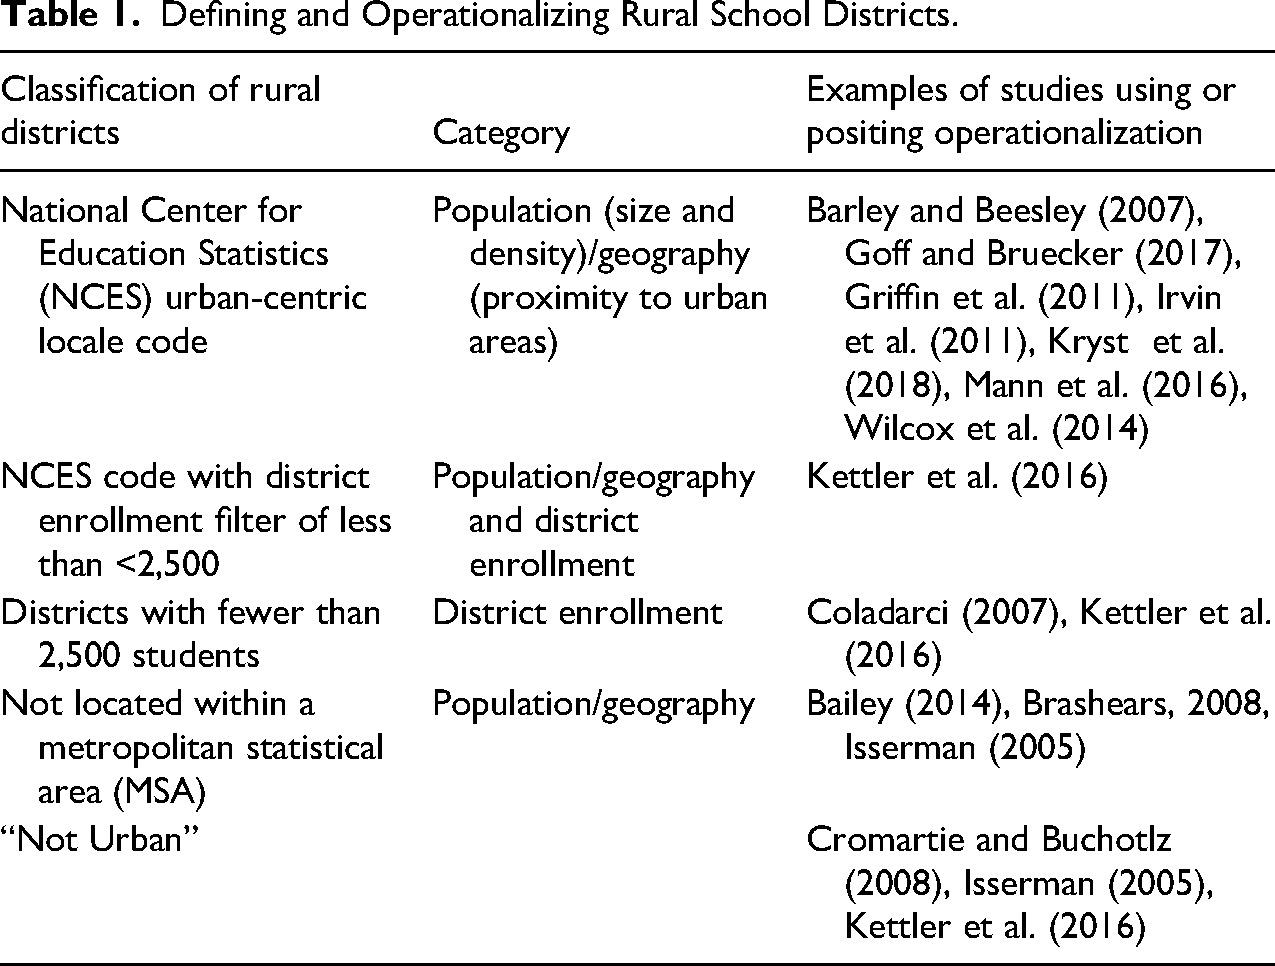
The findings of the literature review indicate that rural education is typically conceptualized along six main categories: (a) geography/population, (b) district enrollment, (c) restricted access to resources, (d) economic structure, (e) economic and social context, and (f) “not urban.” Table 1 provides the operationalizations of rural school districts and the categories of the conceptualization of rurality embodied in each measure. Overall, the results indicate that prevailing definitions of rural education are urban-centric. Empirical studies in education most often define “rural” districts, schools, and counties using the NCES classification system and database. Kettler et al. (2016) reviewed how 17 published empirical studies between 2005 and 2015 operationalized rural education and found that although there are inconsistencies, a common way to classify rural education is the NCES locale code, which is based on proximity to urban centers.
Geography/Population
Geography and population density are the most common defining features of rural education (Coburn et al. 2007; Hawley et al., 2016; Kettler et al., 2016). Although there is variation in the criteria for defining rural education across government agencies such as the Census Bureau, the Office of Management and Budget, and the NCES, these classification systems for rural education are largely geographically-based definitions. The county population is usually lumped with proximity to urban centers when defining rural districts. Small county populations are another defining feature of rural education. Scholars have highlighted that a county population of fewer than 2,500 residents captures rural education (Coladarci, 2007; Hawley et al., 2016; Kettler et al., 2016; Sierk, 2017). Prior studies have also operationalized rural communities as communities outside of metropolitan areas (Bracken, 2008; Isserman, 2005).
District Enrollment
District size is another defining feature of rural education. Rural districts are typically smaller with fewer schools and students compared to non-rural districts. Rural districts typically are defined as having a population of less than 2,500 (Kettler et al., 2016), and rural schools are generally small (less than 200 students) (Provasnik et al., 2007). Enrollment decline has been a feature of rural school districts in recent decades (Greenough & Nelson, 2015). Nearly two-thirds of rural school districts experienced lost enrollment in the 2000–2001 and 2010–2011 school years. Furthermore, lost enrollment is correlated with distance from urban areas, thus rural remote districts that are further away from urban areas are getting smaller over time. Johnson et al. (2018) documented a decline in overall student enrollment but an increase in ELL, minoritized and economically disadvantaged students in rural schools. Rural schools typically have a lower student enrollment than urban schools, and the size of rural schools varies greatly across rural areas (Stoddard & Toma, 2021).
Restricted Access to Resources
Another key criterion in defining rural education is restricted access to resources (Kettler et al., 2016). Resource availability is strongly linked to the remoteness of the location (Bright, 2018). Many rural schools are geographically isolated from other locales and lack the population density necessary to fund “stand-alone services, businesses, resources, community organizations, or programs” (Bracken, 2008). This isolation is often geographic, but may also be social (Bright, 2018; Parson & Hunter, 2019). Rural education tends to be associated with a lack of access to social services such as healthcare. It is important to note the limited access to both (a) social and economic resources and (b) educational resources. Early definitions of rural education were rooted in explicating “the rural school problem” or the deficiencies in resources in rural districts. Indeed, staffing and finances are considered the primary challenges among rural educational leaders (Stoddard & Toma, 2021). Less attention has been paid to differences in class size across rural and urban contexts though there is a crystallizing consensus that limited resources may affect course offerings and learning opportunities and there are key differences in the teacher labor market (Williams et al., 2021).
With such limited funds and small communities, the tasks of teacher recruitment, training, and retention are incredibly difficult for many rural schools (Biddle & Azano, 2016). Many rural schools are understaffed and have a difficult time recruiting new teachers (Parson & Hunter, 2019). Kettler et al. (2015) found rural schools allocated fewer resources to gifted education relative to other schools. Preston et al. (2013) report that rural principal candidates experience a hiring disadvantage if they do not have a historical tie to the community that is hiring. Additionally, many rural principals lack the resources necessary for adequate preparation and professional development (Preston et al., 2013). Prior studies have highlighted the complexities of the rural teacher labor markets. Rural school districts tend to employ a larger proportion of first-year teachers relative to non-rural districts and teachers in rural schools are also more apt to switch to non-rural schools (Cowen et al., 2012; Miller, 2013). Goff and Bruecker (2017) examined the teacher labor market in Wisconsin and found no evidence of a rural teacher shortage even though applicants may be averse to rural contexts.
Economic Structure
In many ways, rurality is defined by economic structure, namely agrarian roots and the preeminence of agriculture in local economies. In the 20th century, globalization and industrialization of the farming industry mechanized labor in rural communities leading to diminished job opportunities resulting in young people in rural areas migrating to cities where economies were booming (Johnson, 2006). Farming still exists in some rural areas but now makes up only 6.5% of the nonmetropolitan workforce. Rural economies are dominated by retirees and employees in service, retail, manufacturing, and recreation (Johnson, 2006). Rural areas with access to natural, scenic amenities are growing in population and have more stable economies (McGranahan & Beale, 2002). In recent years, manufacturing jobs are decreasing causing increased unemployment as companies find cheaper labor options abroad (Johnson, 2006). The economic recession of 2008 led to a drastic decrease in employment rates and population in rural counties overall (Cromartie & Vilorio, 2019). The slow growth of employment in rural counties can partially be attributed to a shrinking labor force—over the past decade net migration to rural areas has decreased and the population is increasingly aging (Cromartie, 2018). Lower education levels in rural counties may also affect employability in the increasingly technologically advanced economy (Pender, 2019). Poverty rates are consistently higher in rural counties than in urban counties. The most impoverished areas are more isolated rural counties with higher population rates of Black and Native American residents (Pender, 2019).
Changing Economic and Social Context
Changes in social and economic context define rural education as well as blur the line between rural, urban, and suburban districts. Although White residents represented approximately 80% of the population overall in U.S. rural counties (Cromartie & Vilorio, 2019), Latinx migration is the largest growing demographic in rural America and rural areas are increasingly concentrated with diverse students (Johnson et al., 2018). Biddle and Azano (2016) characterize the recent history of rural America as “significant change, with regard to the physical landscapes, economic structures, migrations of populations, and diverse ways of rural life.” Community outmigration—population decline over time—is a defining feature of rural school districts (Biddle & Azano, 2016; Provasnik et al., 2007). Demographic changes also complicate the use of population size as a criterion for rurality. In a study of students from a rural, New Latino Diaspora community in the Midwest, Sierk (2017) found that “students from this near majority Latino community do not view it as rural even though its population is under 2500” (p. 342).
Not Urban
The urban-centric definition of rurality is encapsulated in the U.S Census Bureau's classification of rural as “not urban” (Goff & Bruecker, 2017; Greenough & Nelson, 2015; Sierk, 2017). Although there is much variation in the definition of rural education, the majority of these classification schemes are rooted in the fundamental premise that rural is “not urban” (Kettler et al., 2015, 2016). Isserman (2005) highlighted that rural is conceptualized in terms antithetical to urban “by what is not – not urban, not metropolitan” (p. 466). Notwithstanding, several scholars have called for definitions of rural education less rooted in the urban/rural dichotomy and more reflective of rural cultural life (Kettler et al., 2016).
In sum, although 57% of school districts are considered rural in the U.S., rural education is largely understudied and overlooked in academic literature and policy (Aud et al., 2013; Schafft, 2016). Over the last century, researchers have brought attention and understanding to the unique needs of rural education in the midst of changing rural demographics and the impact of globalization and economic decline (Biddle & Azano, 2016). Researchers and policymakers began to pay attention to the “rural school problem” beginning in 1909 when the U.S. Commission of Country Life (1909) under President Theodore Roosevelt urged for improvement in rural education more aligned to the needs of rural, farming communities (Cubberley, 1912). Early scholars of rural education contrasted the progress made in urban schools parallel to the industrialization of the U.S., and the stagnation of rural education and highlighted issues such as under-resourced schools due to poverty in rural areas, lack of training for rural teachers, and lack of supervision (Cubberley, 1912).
Over time, the particular issues raised by scholars evolved into the challenges of recruiting and retaining teachers drawn to job opportunities in cities, racial equity issues, and differences in teacher quality perpetuated by Black–White segregation and the variety of Indigenous and growing immigrant populations within rural areas. Researchers are increasingly raising awareness of the diversity of rural districts and the need for nuance in our understanding of rurality—differentiating between fringe, distant, and remote rural communities (Bridgeforth et al., 2021; Stoddard & Toma, 2021; Williams et al., 2021). Recently, there is also a growing focus on neoliberal reform movements in rural areas including school choice, charter schools, vouchers, and virtual academies (Mann et al., 2016).
Empirical Definitions of Rural Education
Tables 2 through 5 compare information on district demographic composition and segregation, educational resources, economic and social context, and academic and equity-related outcomes across four categorizations of rural school districts: (1) the NCES rural locale code, (2) NCES rural locale code with district enrollment size filter of fewer than 2,500 students, (3) district enrollment of fewer than 2,500, and (4) not in a metropolitan statistical area (MSA).
Comparing Definitions of Rural School Districts, Demographic Composition, and Segregation.
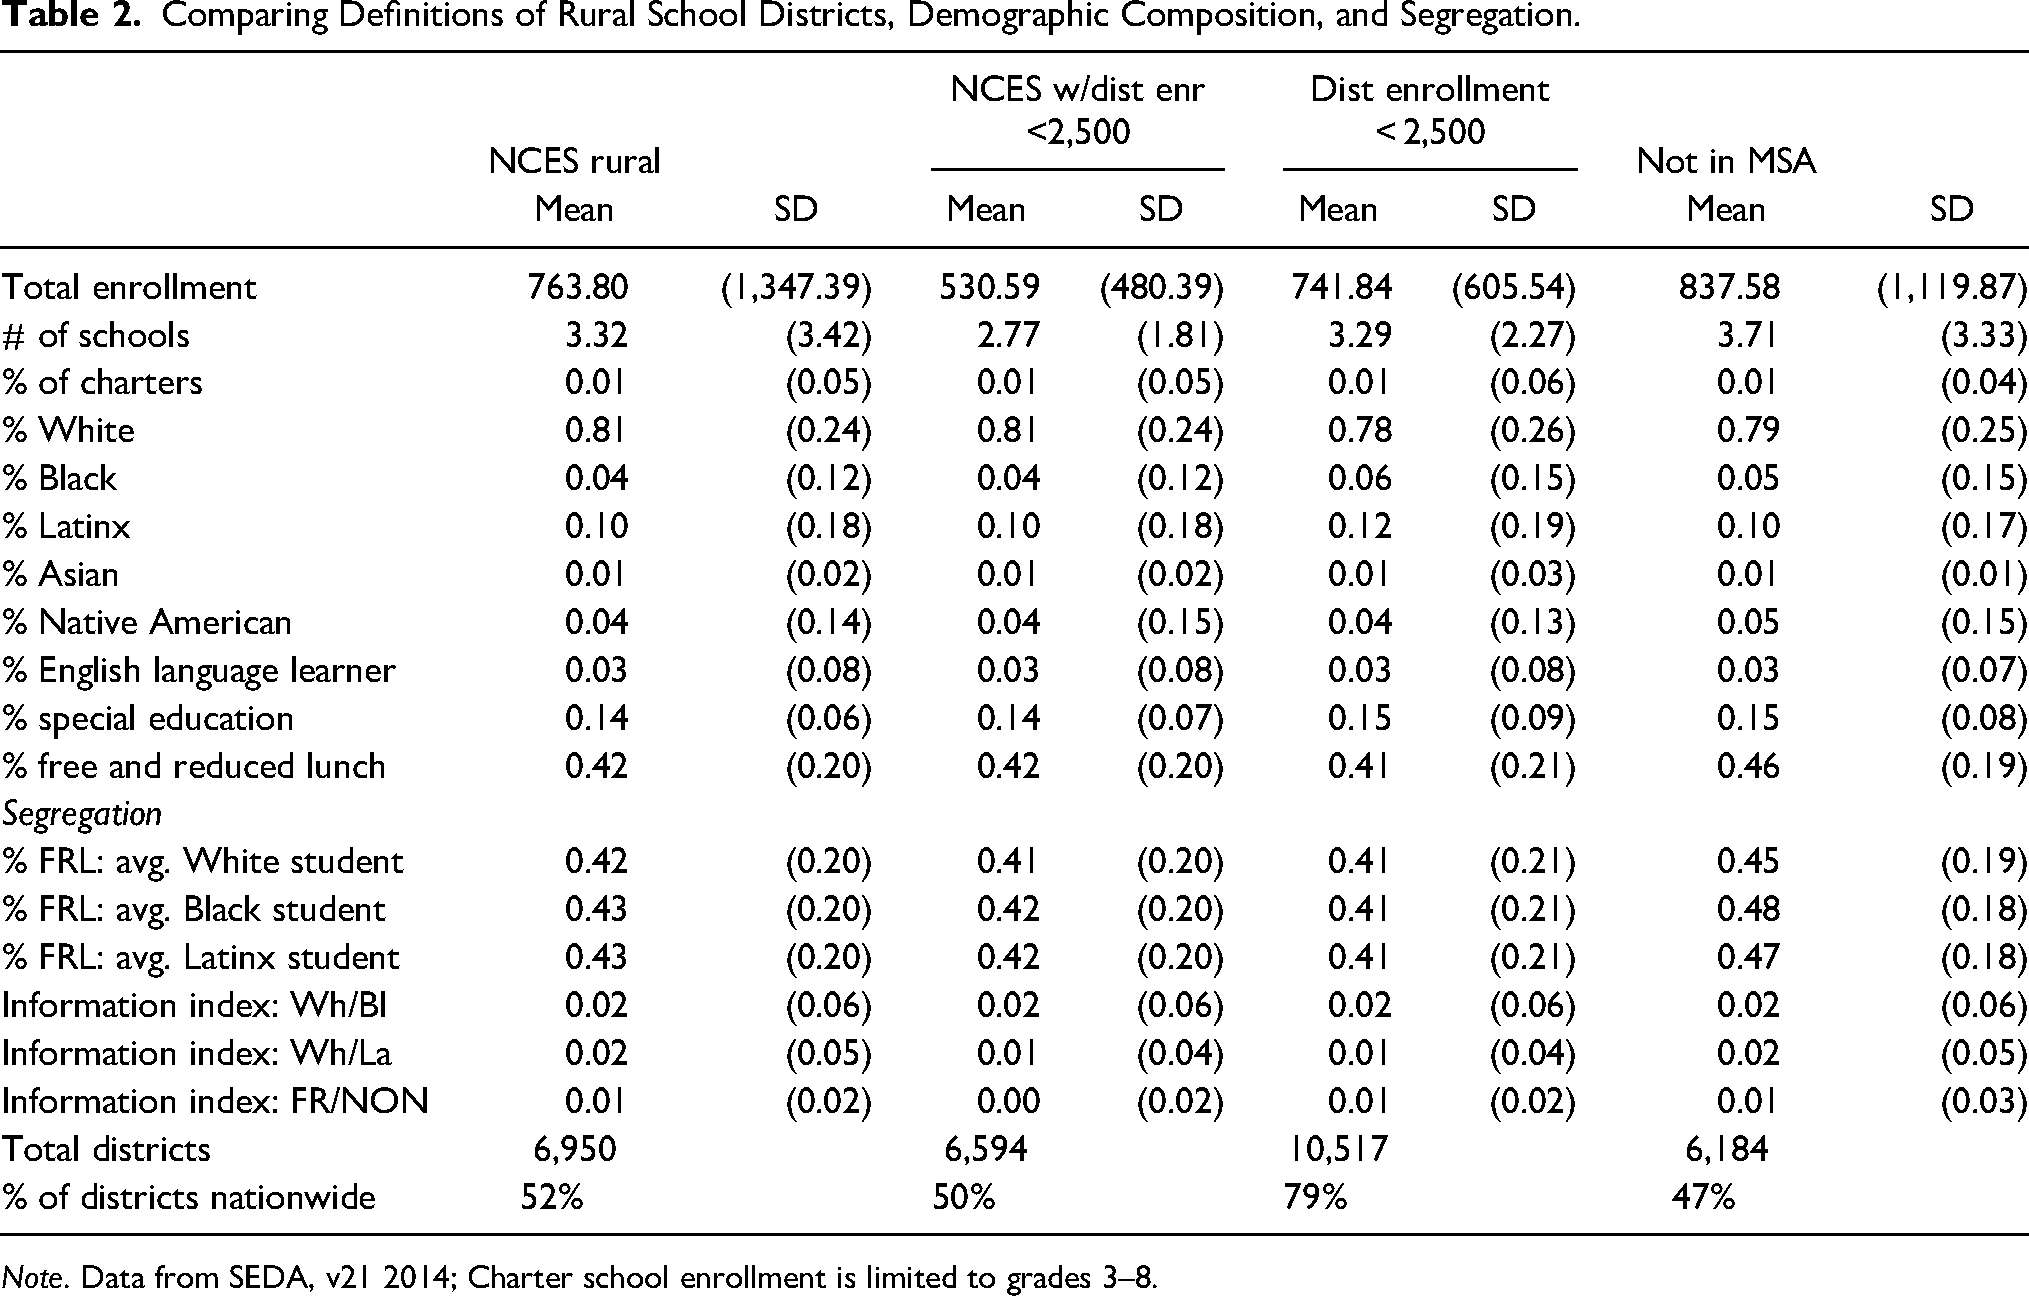
Note. Data from SEDA, v21 2014; Charter school enrollment is limited to grades 3–8.
Table 2 illustrates that there is variation in the size and complexity of districts across the definitions of rural school districts. The number of schools and the average total enrollment varies slightly across definitions of rural districts. Relative to the NCES locale code, all definitions except “not in MSA” identify smaller districts with fewer schools and students as rural. Using “not in MSA,” district enrollment is similar to the NCES locale code but the number of schools is slightly larger suggesting that “not in MSA” include similarly large complex districts as the NCES locale code. For instance, the largest district considered rural using the NCES locale code is over 100,000 students whereas the largest district using “not in MSA” as the definition of rural districts is just over 18,000. The number of charter schools varies across definitions but the percentage of students enrolled in these schools of choice are identical. Using the NCES locale code with an enrollment filter captures districts with the lowest number of charter schools, whereas using “not in MSA” captures districts with the highest number of charter schools.
The results indicate that regardless of the operationalization of rurality, districts were almost identical in student demographic composition as well as segregation. Rural districts are mostly White—roughly 4 out of every five students. Latinx students constitute the second largest student group with roughly 10% of students. The proportions of English Language Learners and students with disabilities are also similar across definitions of rural districts. There is a noteworthy difference in the proportion of free and reduced lunch (FRL) students. The percentage of poor students is markedly higher when using “not in MSA” as the definition of rural districts. Similarly, there is a greater proportion of FRL students in classes when rural districts are identified using “not in MSA” relative to other definitions of rurality. Segregation also varies across the definitions of rural districts and is highest when the NCES locale code and “not in MSA” classifications are used. Black–White segregation is highest across all definitions of rural school districts.
Table 3 presents educational resources across the operationalizations of rural school districts. Revenue sources vary across the definitions of rural. “Not in MSA” districts receive a larger share of the revenue from federal and state sources but a lower percentage of revenue from local sources relative to other definitions. Table 3 also demonstrates that revenue from state sources is noticeably lower in rural districts defined as fewer than 2,500 but this shortfall is made by higher revenue from local sources. The results indicate that per-pupil expenditure is relatively similar across the operationalizations of rural school districts.
Comparing Definitions of Rural School Districts, Educational Resources.
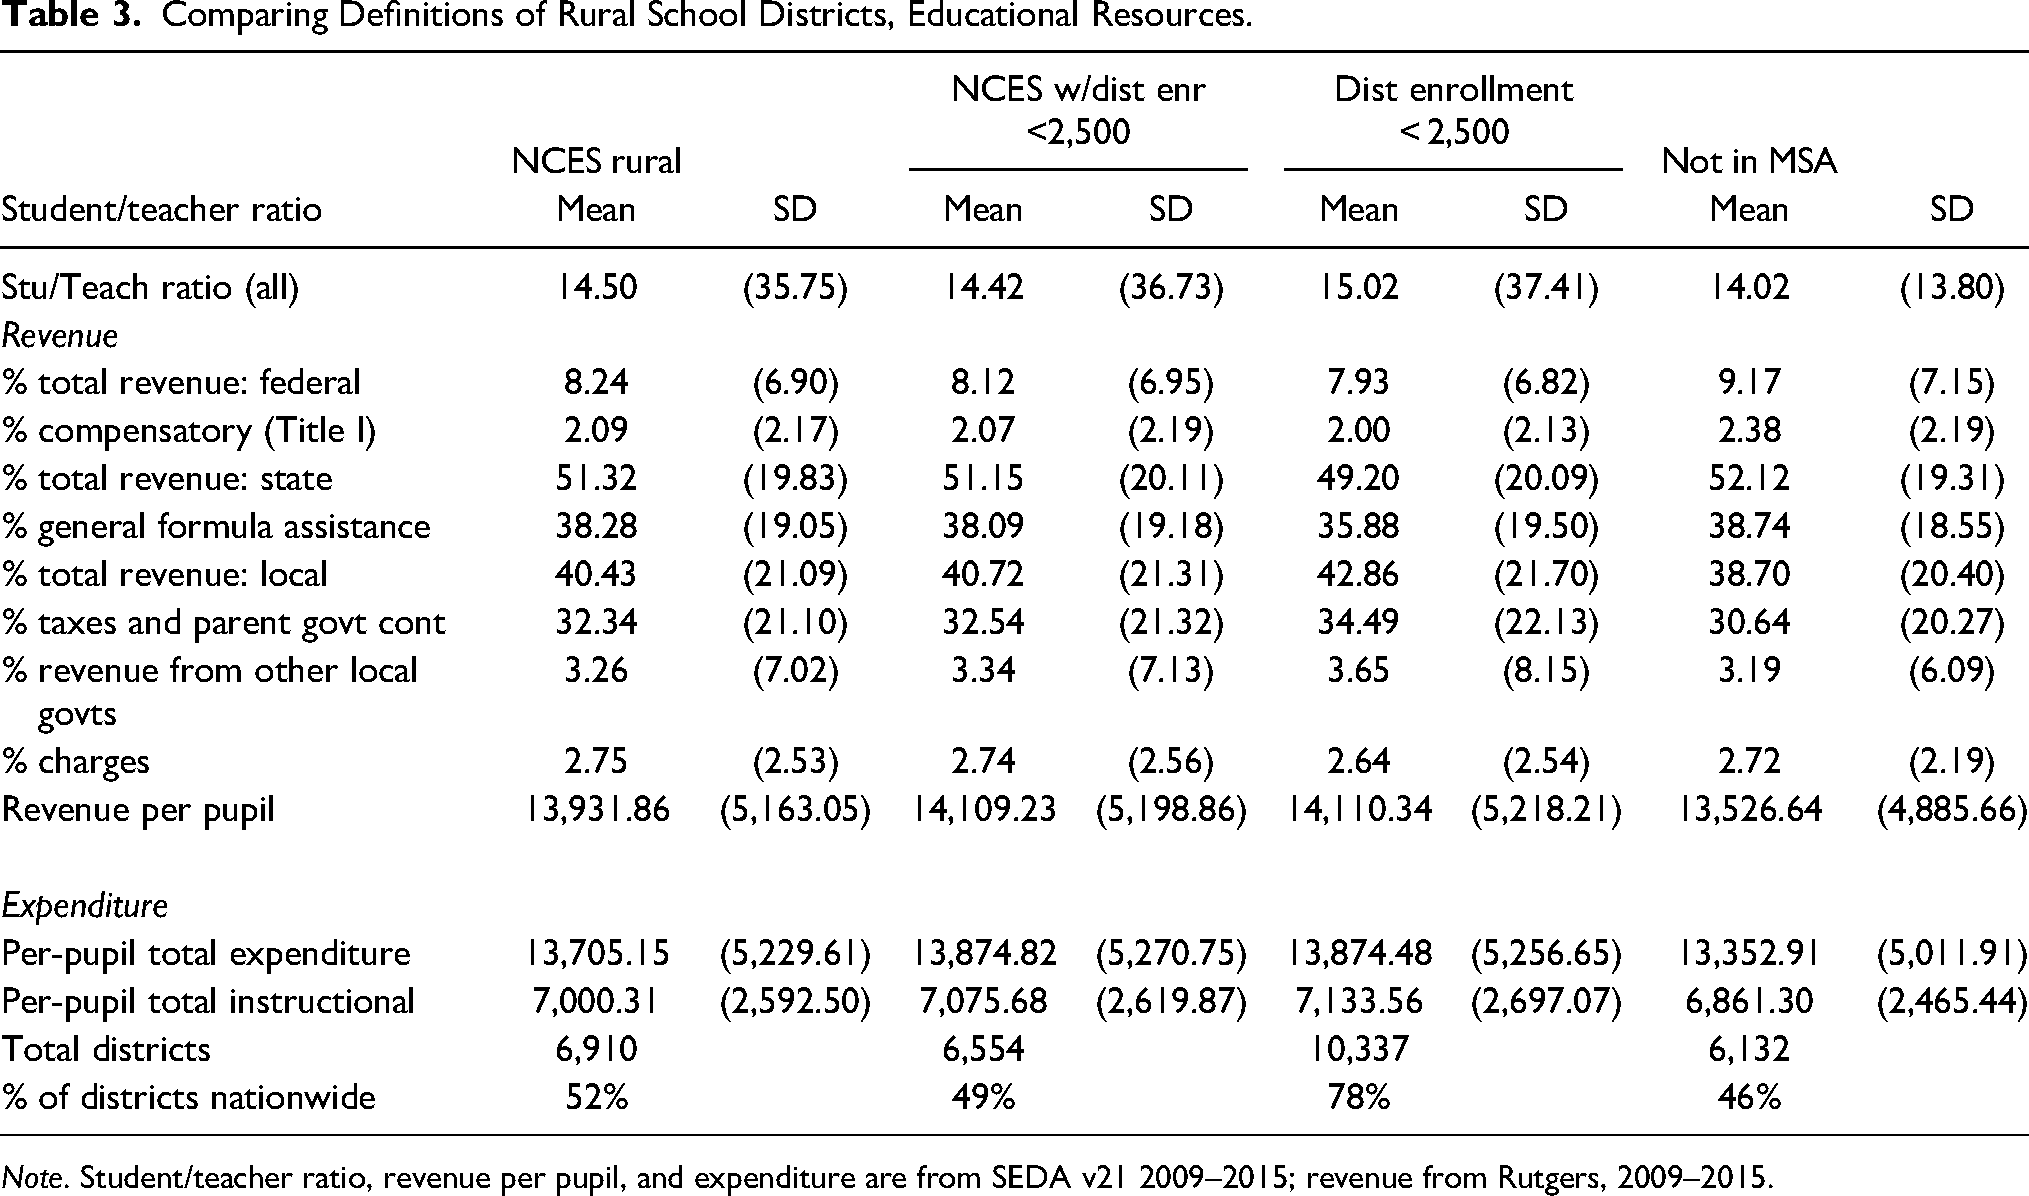
Note. Student/teacher ratio, revenue per pupil, and expenditure are from SEDA v21 2009–2015; revenue from Rutgers, 2009–2015.
Table 4 illustrates the economic structure and activity across the operationalizations of rural school districts. There are notable similarities in the economic structure and activity among the different definitions of rural districts. Roughly a fifth of the population is in sales, followed by service; national resources, construction and maintenance; and professional occupations. There are several differences in economic and social context across the definitions of rural school districts. Using a solely enrollment-based measure captures a set of districts with the highest median income for Black and Hispanic residents as well as higher education levels relative to the NCES-based definitions (both the NCES urban-centric locale code and the locale code in tandem with a district enrollment filter of fewer than 2,500 students). Using “not in MSA” as the definition of rurality captures the most disadvantaged and unequal social and economic context relative to other definitions of rural districts. Specifically, “not in MSA” identifies districts with lower median income and education levels but higher poverty, proportion of single mothers and SNAP recipients, and GINI indices of inequality compared to the other definitions. These districts also have the lowest SES composite for Black and Hispanic residents and the highest for White residents among the definitions.
Comparing Definitions of Rural School Districts, Economic Structure, and Economic and Social Context.
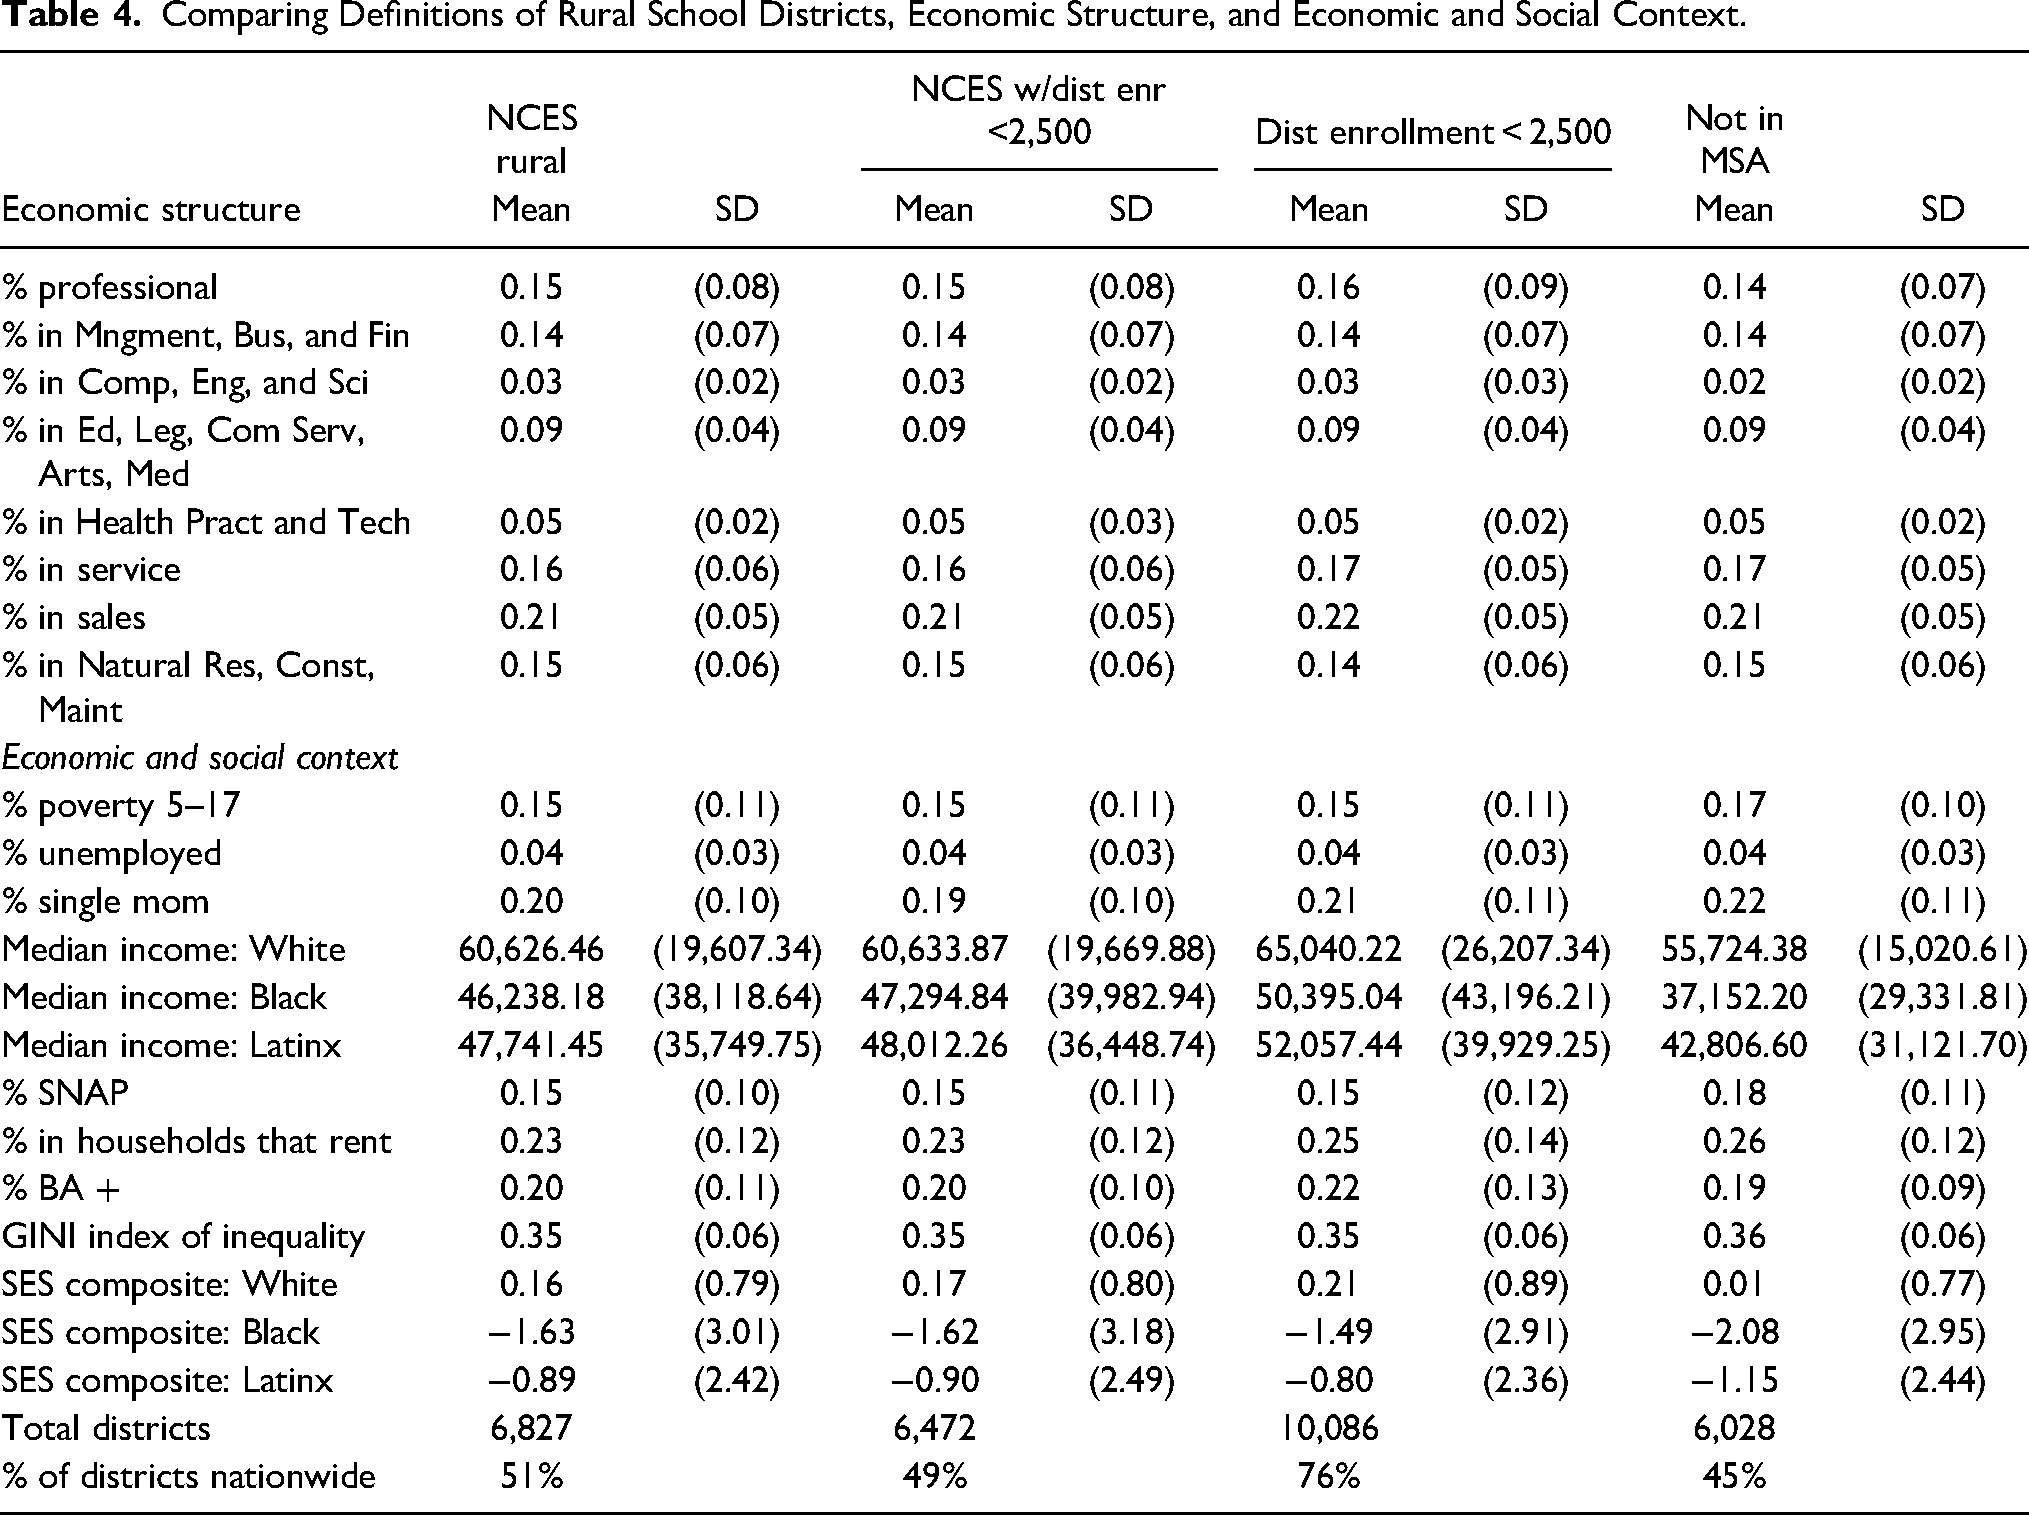
Table 5 presents academic and equity-related outcomes across the definitions of rural districts. The results illustrate that there are small differences in student achievement across the different definitions of rural districts. Using enrollment of fewer than 2,500 captures slightly higher-achieving districts whereas “not in MSA” identifies districts with lower reading and math achievement. Unlike the other definitions of rural school districts, using “not in MSA,” White students are higher achieving than Asian students in ELA and math. White–Black and White–Latinx achievement gaps are also larger when rural school districts are operationalized as “not in MSA.”
Comparing Definitions of Rural School Districts, Student Achievement, and Equity-Related Outcomes.
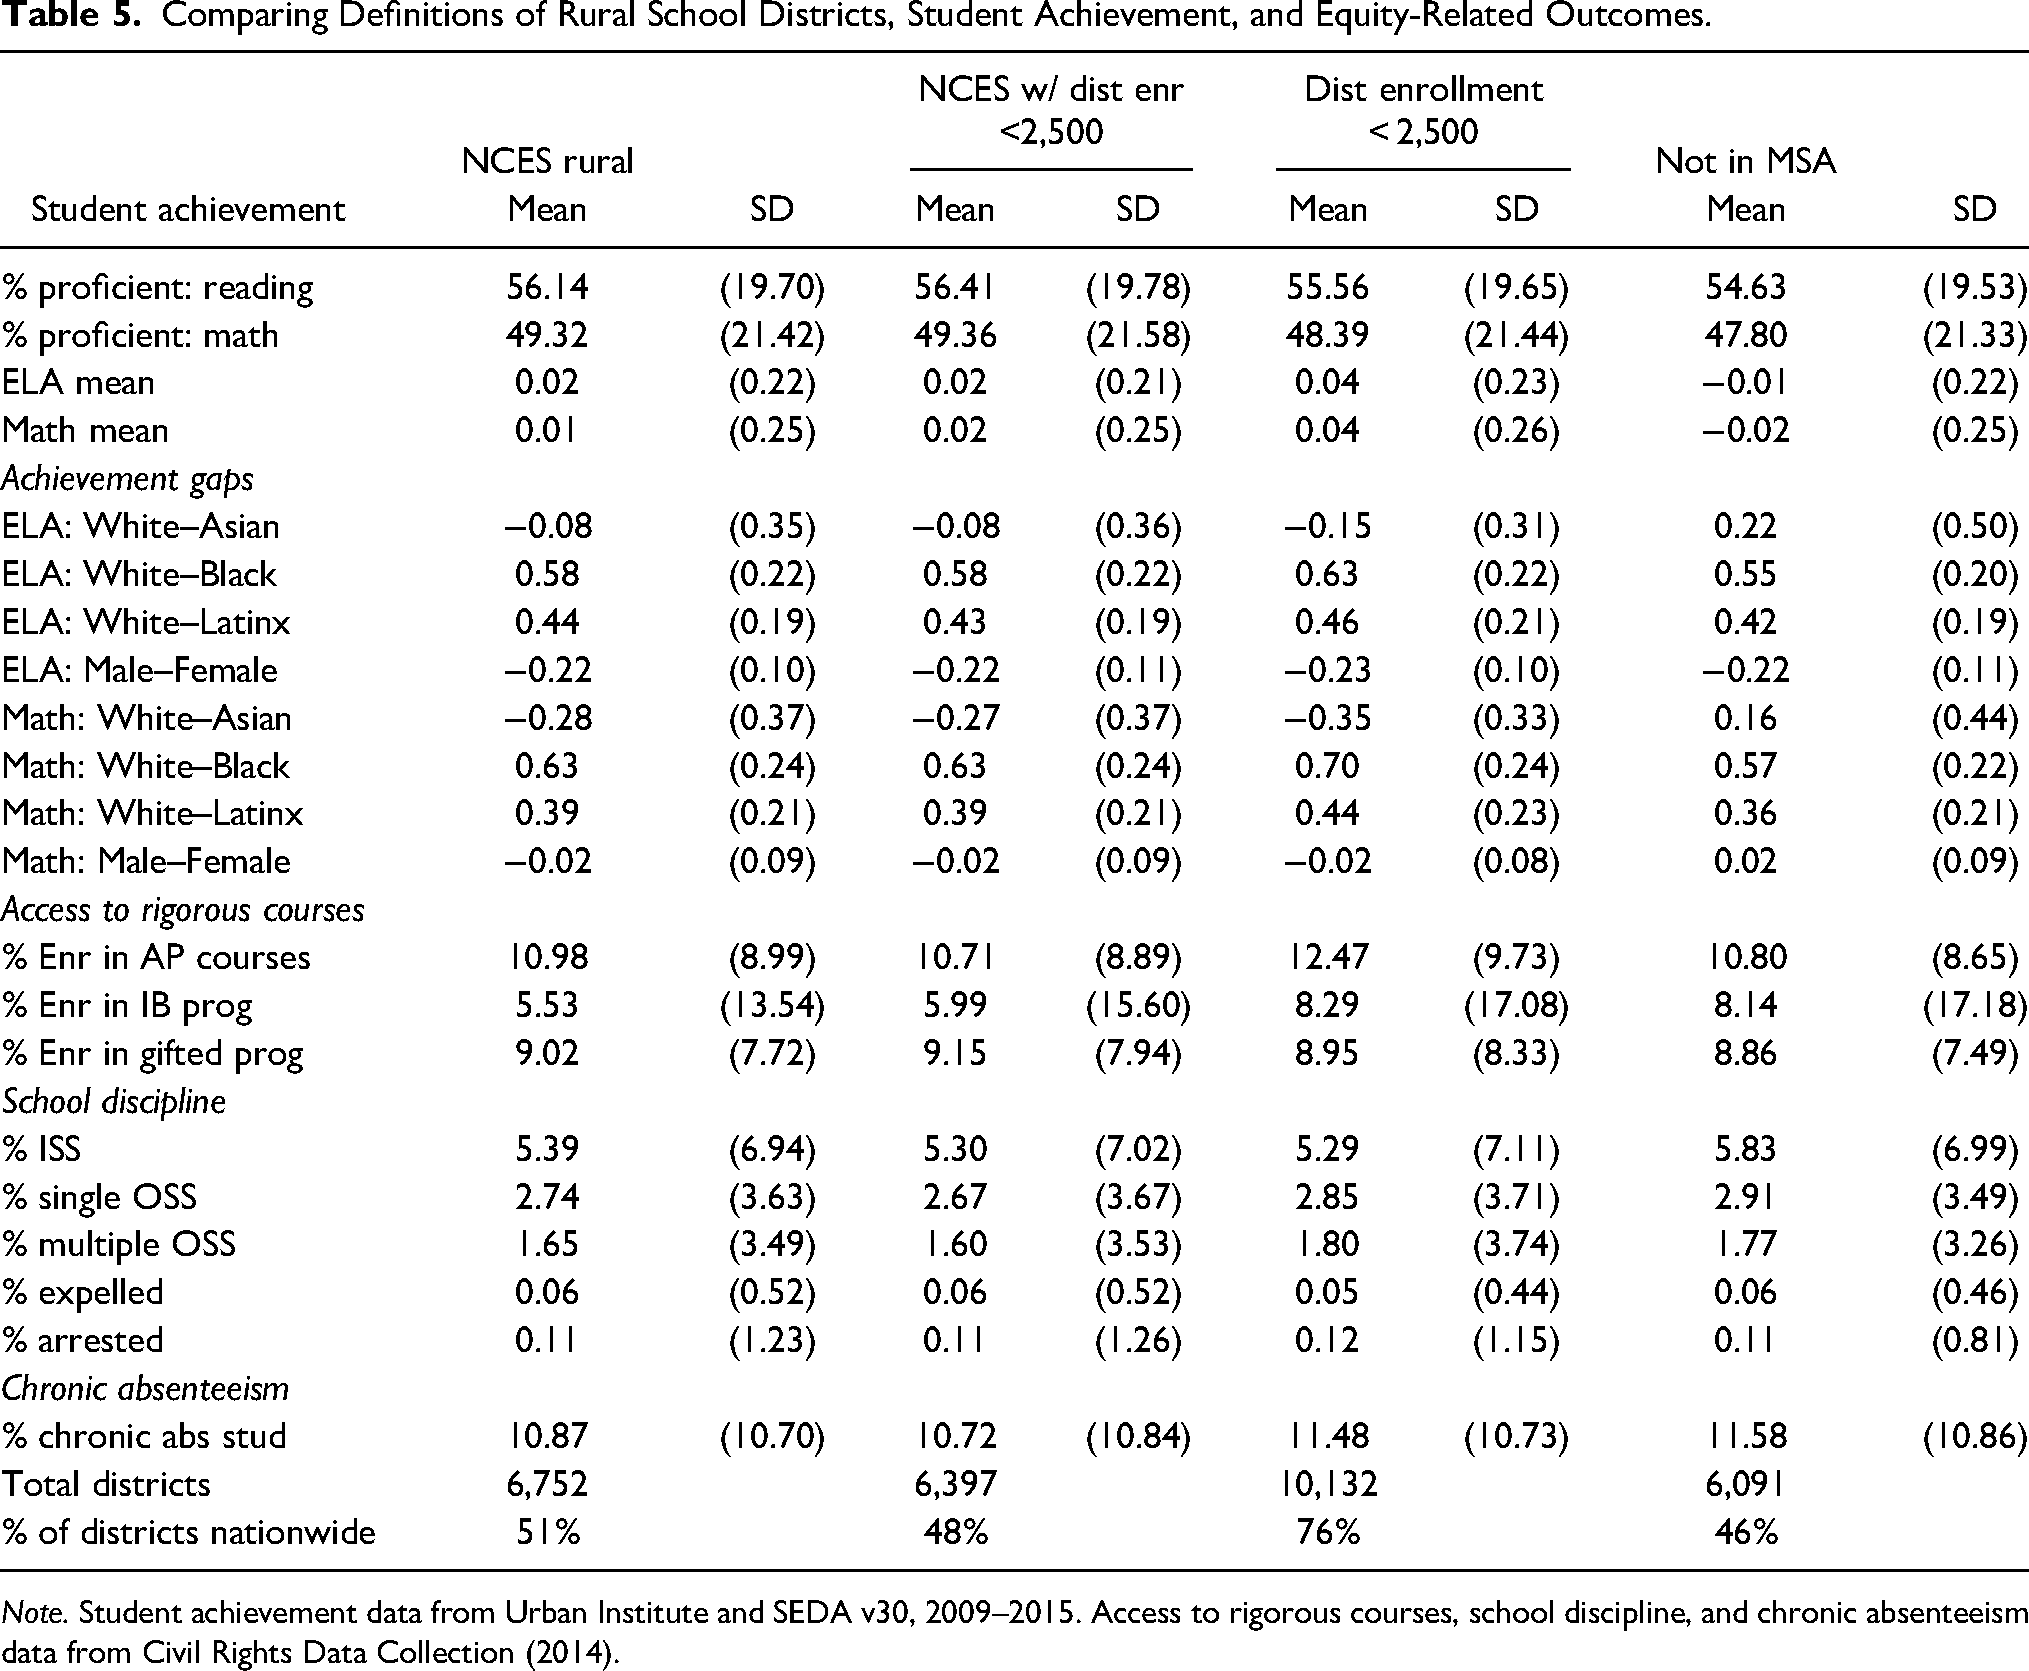
Note. Student achievement data from Urban Institute and SEDA v30, 2009–2015. Access to rigorous courses, school discipline, and chronic absenteeism data from Civil Rights Data Collection (2014).
Table 5 also illustrates that there are differences in the access to rigorous courses across the definitions of rural districts. The NCES locale code captures districts with a higher proportion of AP enrollment and IB enrollment as well as higher enrollment in gifted programs relative to the NCES code in tandem with the enrollment filter of fewer than 2,500 students. Rural districts defined solely by district enrollment have the highest proportion of students in AP and IB courses as well as gifted programs. Similar to access to rigorous courses, the results indicate that there is slight variation in school discipline (the proportion of students being suspended, expelled, and arrested) across the definitions of rural school districts. Suspension rates (both ISS and OSS) are slightly higher when “not in MSA” operationalized rural school districts. Expulsions and arrests are almost identical across the definitions. Racial disparities in suspensions in rural districts exist, regardless of the operationalization of rurality. Despite their low enrollment, Black students and Latinx students have higher suspension rates (both ISS and OSS) than their White counterparts. “Not in MSA” identifies districts with higher suspension rates relative to NCES-based definitions of rural school districts. Using enrollment of fewer than 2,500 captures a set of districts with a higher proportion of enrollment in AP courses relative to other definitions. Chronic absenteeism also varies across the definitions of rural districts and is highest when rural districts are defined as “not in MSA.” Overall, using “not in MSA” identifies districts with larger racial achievement gaps, higher suspension rates and chronic absenteeism relative to other operationalizations of rural districts.
Rural Versus Urban Districts
Table 6 compares the operationalizations of rural school districts to urban school districts, as identified by the NCES urban-centric code (roughly 6% of districts are classified as urban). Table 6 illustrates statistically significant differences in the size and complexity, demographic composition, and segregation between rural and urban districts, regardless of the definition of rurality. Overall, urban districts have more schools and larger student enrollment than rural districts. Urban districts are also more defined by the presence of charter schools than rural districts. There are more charter schools and a larger proportion of students enrolled in charter schools in urban districts. The results suggest that the size and complexity of districts as well as school choice are distinguishing features between rural and urban districts.
Comparing Definitions of Rural and Urban Districts.
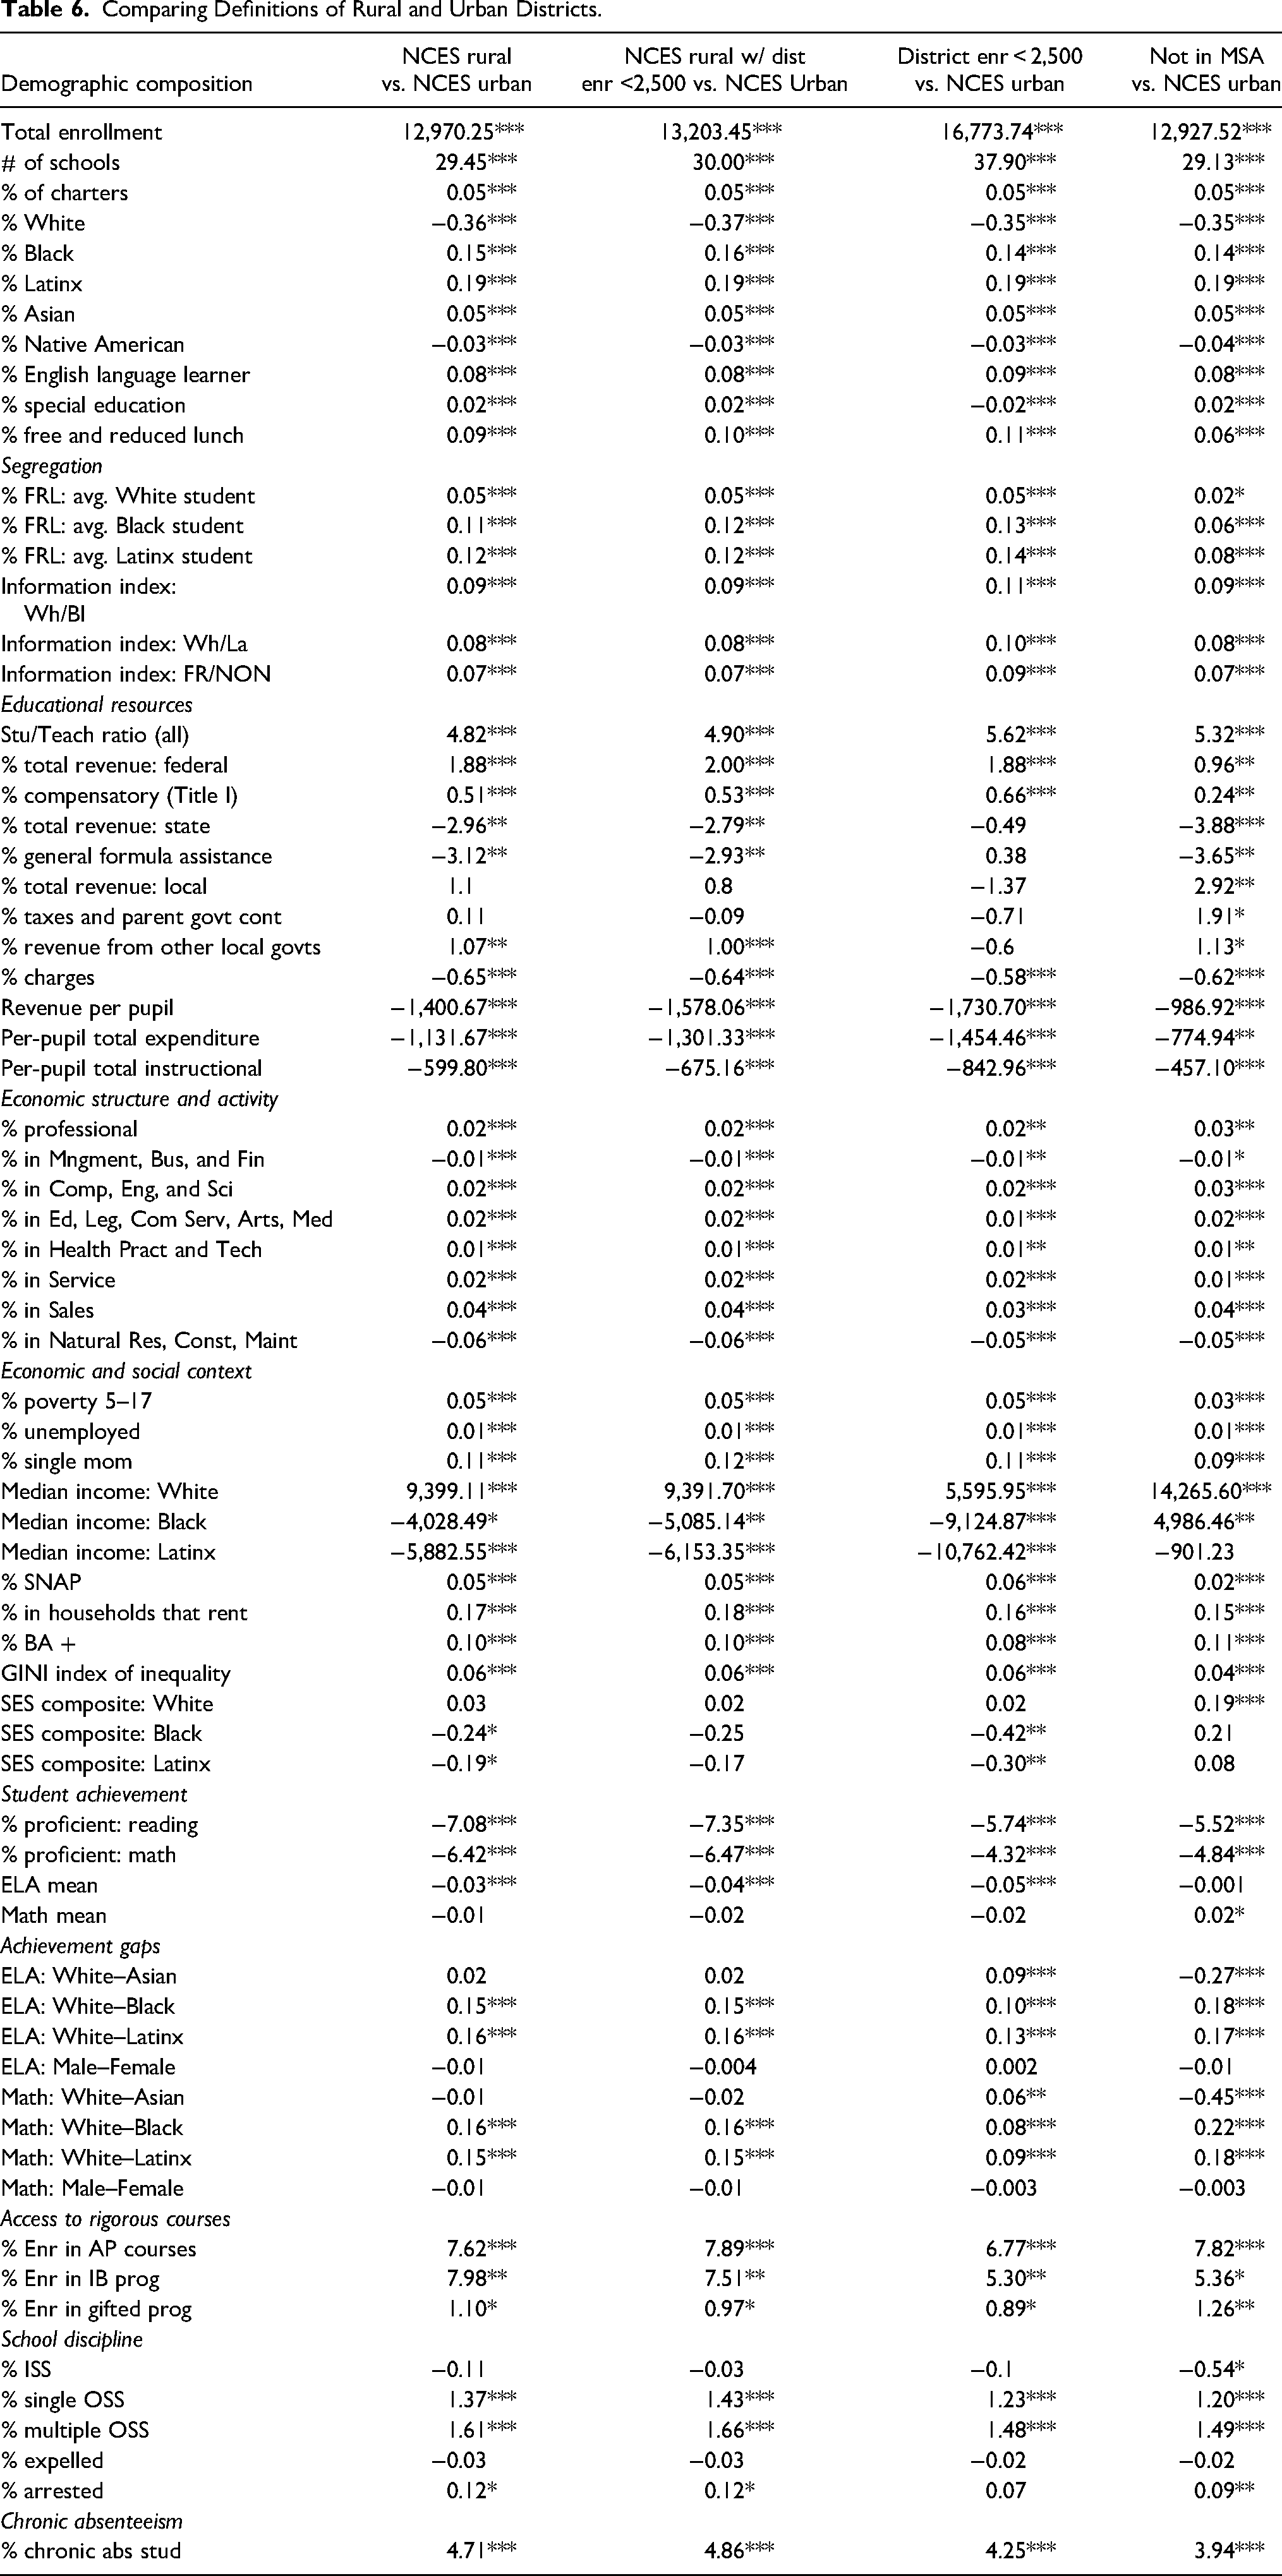
The results also highlight that student demographic composition is another differentiator between urban and rural districts. Rural school districts are largely White whereas urban districts are characterized by significantly higher proportions of Black and Latinx students. However, rural districts have a higher proportion of Native American students regardless of the operationalization of rurality. Urban districts also have a higher proportion of FRL students and serve a larger proportion of ELL students and special education students (to a lesser extent) than rural districts. Urban districts are also more segregated than rural districts, and students are more exposed to poor students in classes in urban districts relative to rural districts. Another differentiating feature between urban and rural districts is educational resources. Rural districts have higher per-pupil spending, higher per-pupil revenue, and lower student/teacher ratio than urban districts.
Table 6 also demonstrates that rural and urban districts differ in the proportion of revenue they receive from federal, state, and local sources. Relative to all definitions of rural school districts, urban districts receive a larger percentage of total revenue from federal sources. When rural districts are defined using “not in MSA,” there is a noticeably smaller difference in the percent of total revenue from federal sources with urban districts relative to other definitions of rural districts. The results indicate that rural districts receive a larger share of total revenue from state sources than urban districts. This finding is congruent with prior studies that found that rural public schools receive large shares of revenues from the state (52%) compared to city (46%) and suburban (42%) schools (Provasnik et al., 2007). Many states provide rural schools with a disproportionately large share of school funding resources as a result of the higher relative cost of running and maintaining a rural school. (Showalter et al., 2019). When rural districts are defined using enrollment of fewer than 2,500 students, there is no statistically significant difference between the percent of the total revenue of state sources. Rural districts operationalized as “not in MSA” have a larger gap in state funding relative to urban districts.
The percent of total revenue from local sources varies across the comparisons of rural and urban districts. Both NCES-based definitions of rural districts capture districts that have no statistically significant differences in local funding from urban districts whereas the “not in MSA” classification of rural districts identifies districts that have a higher proportion of local funding relative to urban districts. Unlike other definitions of rurality, rural districts defined as “not in MSA” have a significantly higher percentage of the revenue of taxes and government contributions than urban districts. Overall, the results indicate that there are variations in the revenue of state and local sources among definitions of rural and urban districts.
Table 6 also demonstrates that there are statistically significant differences in the economic structure and urban and rural districts. Urban districts have a slightly higher proportion of residents in most occupations suggesting a more diverse economic structure and activity in urban districts relative to rural districts. Rural districts have a larger proportion involved in natural resources, construction, and maintenance. Differences in the economic and social context of rural and urban districts are similar whether one uses the NCES code with or without the enrollment filter. The results indicate that White poverty is similar in urban and rural districts, whereas Black and Latinx poverty are higher in urban districts. Higher poverty in urban districts relative to rural districts, as illustrated in Table 6 when rurality is defined using NCES based and enrollment based, is seemingly inconsistent with insights that nonmetropolitan and rural areas typically have higher poverty than metropolitan and urban areas (Isserman, 2005).
The results illustrate contradictory patterns in income and education by race/ethnicity. White income is higher in urban districts by roughly $9,500, whereas Black and Latinx income is higher in rural districts by roughly $4,000 and $6,000, respectively. Yet, urban districts are more educated relative to rural districts, regardless of race and ethnicity. Thus, using the NCES-based definitions of rural and urban school districts suggests that more educated Black and Latinx residents in urban districts have a lower income than less educated Black and Latinx residents in rural districts. The GINI index of inequality illustrates that inequality is higher in urban districts compared to rural districts, especially for Latinx and Black residents.
Table 6 also illustrates differences in student achievement and equity-related outcomes across urban and rural districts. Regardless of the definition of rural school districts, the results show that rural districts have a higher proportion of students proficient in reading and math than urban districts. Achievement in reading and math is also significantly lower in urban districts and achievement disparities are also significantly higher in urban districts. Chronic absenteeism is also higher in urban districts compared to rural districts.
Specification Checks
Prior studies have highlighted that the variety among rural schools poses an additional challenge in defining rural (Greenough & Nelson, 2015). Kettler et al. (2016) highlighted that studies using the urban-centric NCES locale code did not distinguish between fringe, distant, and remote rural locales. Less than a handful of studies since Kettler et al.'s (2016) review have compared NCES rural subtypes (Kryst et al., 2018). This is especially important given that Greenough and Nelson (2015) found that three-fifths of rural districts are classified as fringe, the closest classification to urban areas, and Kettler et al. (2015) found that rural fringe were demographically similar to schools in suburbs than rural distant and rural remote. In the first series of specification checks, I examine the differences among the NCES rural subtypes as well as how each rural subtype is statistically different from urban districts. The results indicate that even though rural fringe (those closest to an urbanized area) is the lowest proportion of rural districts, these districts also have no statistically significant differences across several indicators of economic structure and economic and social context. Similarly, there are also no statistically significant differences across several indicators of economic structure, economic and social context when rural distant districts (the majority of rural districts) are compared to urban districts.
Finally, I explore a definition of rural school districts that combines the “not urban” and “not metropolitan” empirical definitions of rural school districts. Isserman (2005) raised concerns about urban districts in nonmetropolitan areas and rural districts within metropolitan areas when using “not in MSA” as a definition of rurality. The results indicate that the larger concern is overlooked by rural districts in metropolitan areas. The majority of districts (53%) nationwide are located in metropolitan areas and roughly 37% of districts in metropolitan areas (just over 3,200 unique districts) are classified as rural using the NCES locale code. These districts are larger districts, largely White, with a lower proportion of FRL students.
Rural school districts may be operationalized as a combination of districts including: (a) districts that are “not in MSA” and (b) districts in metropolitan areas that are classified as rural using the NCES locale code in tandem with an enrollment filter of fewer than 2,500 students. The results indicate that the combined measure operationalizing rural districts identifies roughly 56% of districts as rural. Relative to the NCES rural code, these districts are smaller, have similar student demographic composition, and have a slightly higher proportion of FRL students. The combined measure captures a more socio-economically disadvantaged set of districts relative to the NCES locale code. Districts identified with the combined measure have a fairly similar access to rigorous courses but higher suspension rates and chronic absenteeism relative to the NCES rural districts. These districts have a slightly lower achievement relative to NCES rural districts with similar or lower achievement disparities. Similar to other conceptualizations of rural districts, the combined measure has statistically significant differences with urban districts in demographic composition, segregation, and economic structure. Differences in social and economic context are nuanced with no statistically significant differences in poverty and the proportion of single mother and SNAP recipients (regardless of race/ethnicity), as well as Black and Latinx unemployment and SES composite between rural and urban districts. Using the combined measure, White median income is significantly higher in urban districts but there are no statistically significant differences in Black median income. Latinx median income is significantly higher in rural districts relative to urban districts.
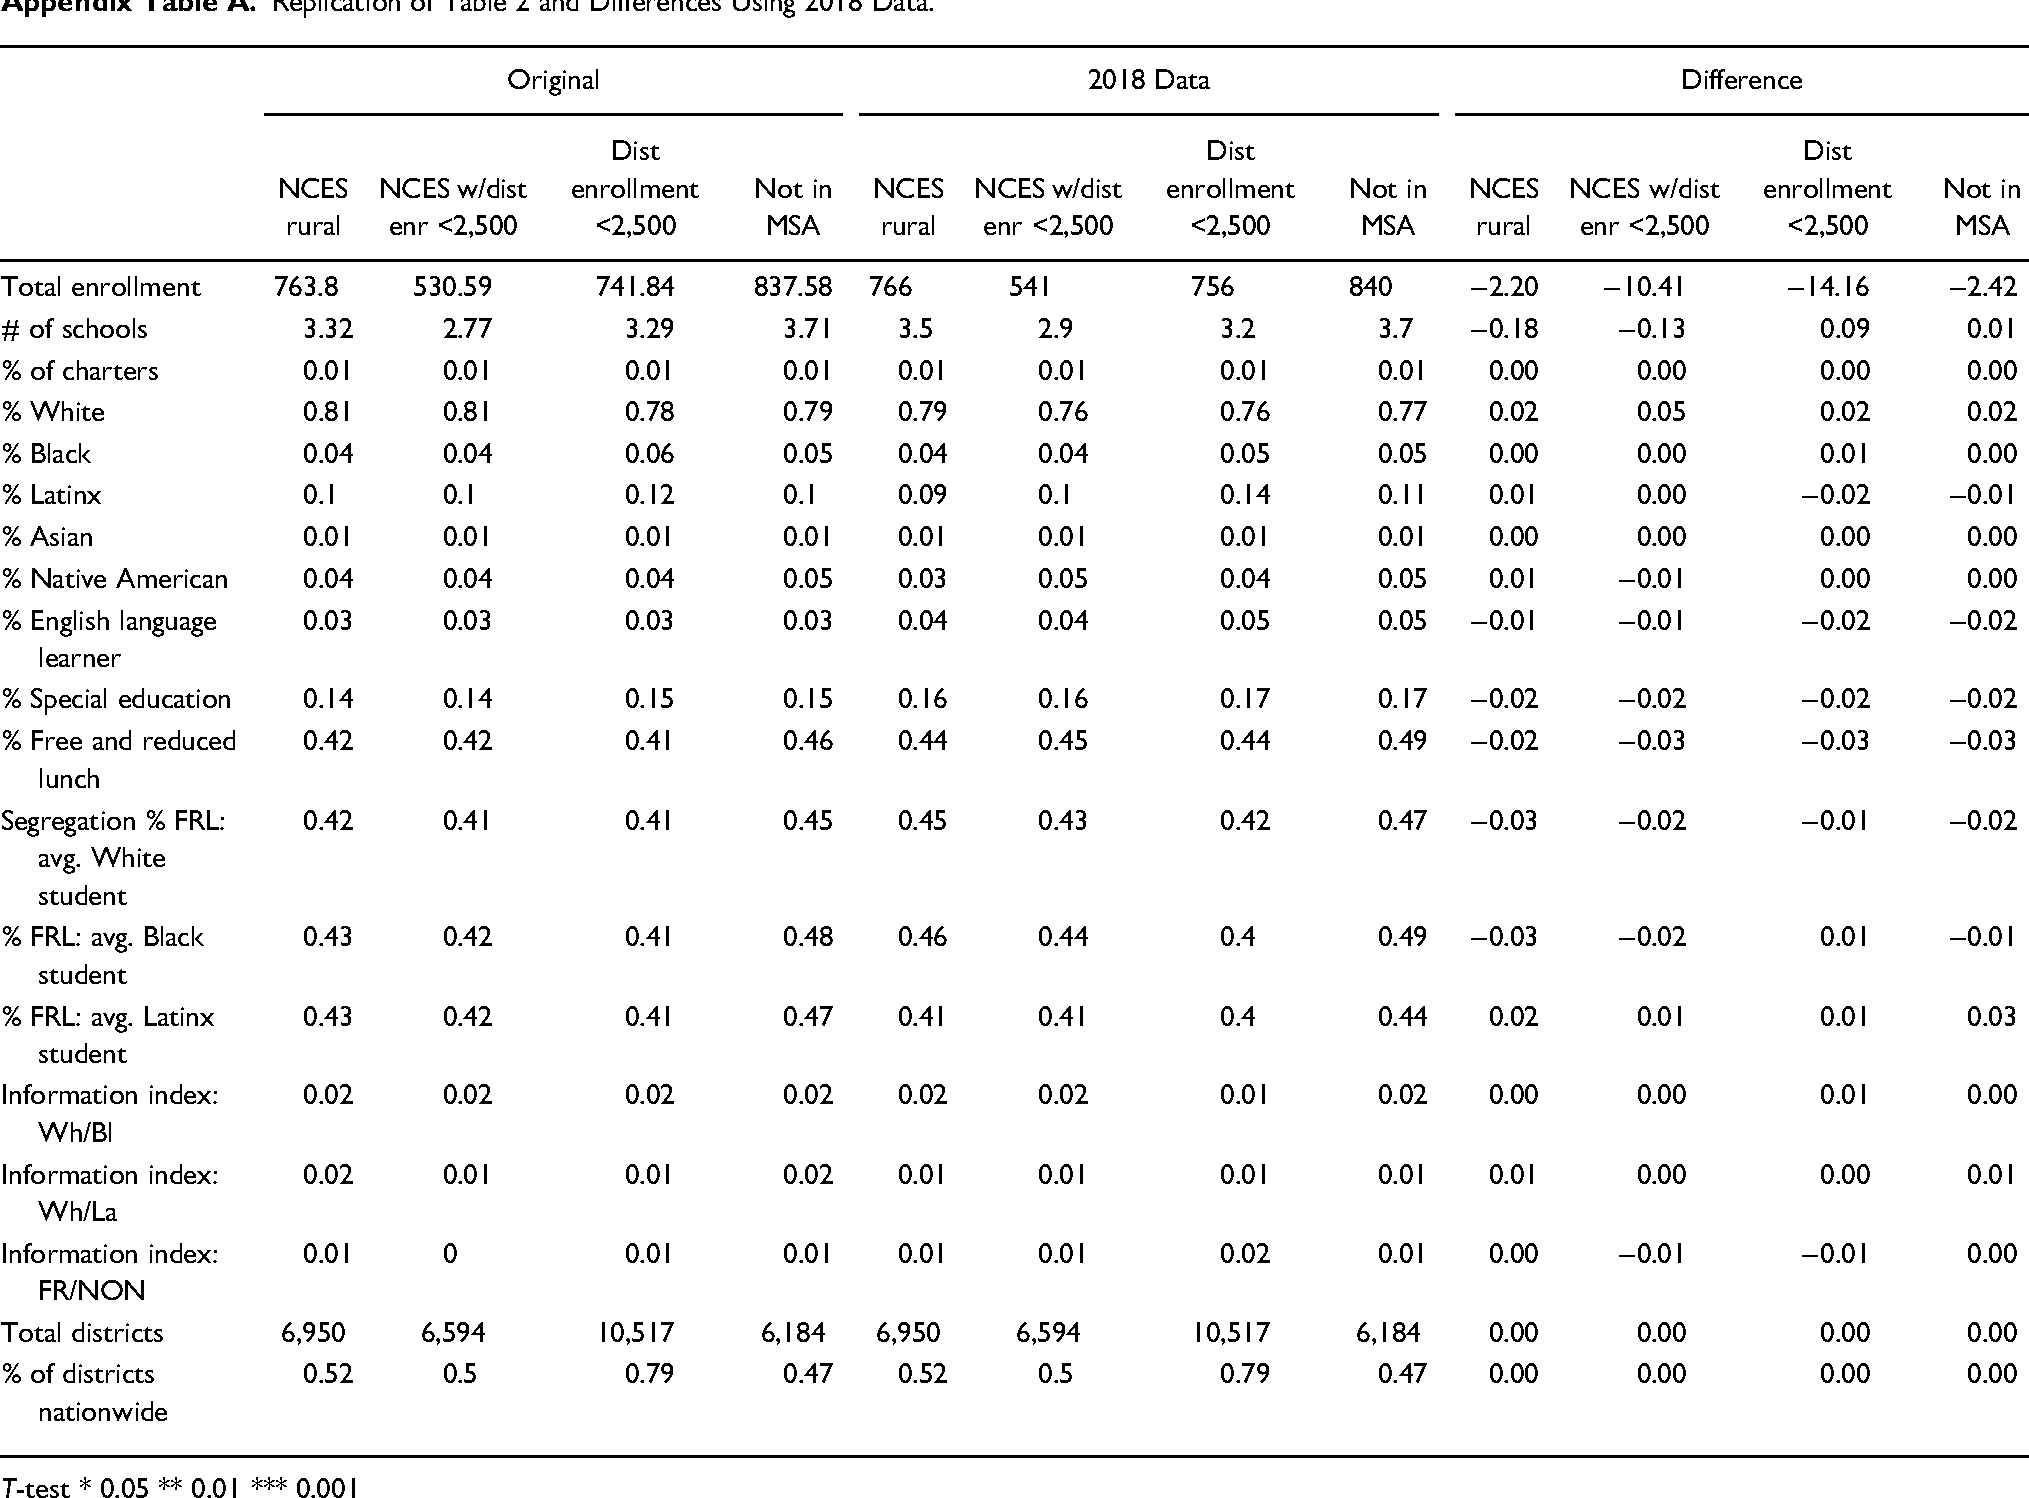
Finally, given the nationwide dataset and the large number of districts analyzed, it is reasonable that the latest year of data (the 2017–2018 school year), would show only small discrepancies in average results. This is shown in Appendix Table A, which provides a comparison of the values for Table 2 based on the data originally used in this study and the latest year of available data. All of the differences appear to be small and none are statistically significant, indicating that the findings and discussion of results will not be meaningfully affected by adding one more or the most recent year of available data.
Discussion
This study helps researchers, practitioners, and policymakers make sense of shifting school environments and social contexts. Similar to urban education, the conception of rural education is linked to physical and social context—“a district located in the midst of trees, unoccupied space, and farm land” (p. 556; Milner, 2012a). “Urban education” and “rural education” are typically used in racially coded ways (Gadsden & Dixon-Román, 2017; Horsford et al., 2021; Irby, 2015; Watson, 2011; Welsh & Swain, 2020). Race and racial issues play an important role in defining what is urban and what is rural. Rural is code for White whereas urban is code for citizens of color. However, Williams et al. (2021) highlight the growing racial diversity of rural districts in states such as Georgia where a quarter of rural schools are majority Black. This challenges the notion that rural is only White and acknowledges the changing population of rural districts. In addition to being racially coded, urban and rural education are also code words for social and economic contexts (Welsh, 2021). Urban is code for development and access to amenities and resources whereas rural is synonymous with undeveloped. Urban education and rural education have become almost synonymous with the economic and social contexts in which schools operate. The onset of the COVID-19 pandemic has reenergized classification of what is urban and what is rural as districts assess the damage, respond, and recover from the pandemic (Welsh, 2022). This study joins a growing number of recent works that have illustrated the definitional implications of urban education and rural education in education research and policy (Goddard & Toma, 2021; Irby, 2015; Welsh & Swain, 2020; Williams et al., 2021)
A synthesis of the rural education literature illustrates that a common, singular definition of rural is elusive. The results of this review support the prevailing notion that the concept of place largely defines rural and the conceptualization of rural as “not urban.” The results indicate that operationalizations of rural districts fall short of completely capturing the nuanced conceptual understanding of rurality. Among the definitions of rural school districts, there is little qualitative difference in student demographic composition and economic structure. Similar to prior studies highlighting the variation across rural districts (Burdick-Will & Logan, 2017; Drescher et al., 2022), the operationalizations of rural districts vary across numerous dimensions including the size and complexity of districts identified, segregation, student–teacher ratios and revenue sources, economic and social context, and student achievement and equity-related outcomes.
Regardless of the operationalization of rural school districts, there are statistically significant differences with urban districts across the size and complexity of districts, district demographic composition and segregation, educational resources, economic structure and economic and social context, and academic and equity-related outcomes. Rural districts are majority-White whereas urban school districts are characterized by diversity, particularly larger shares of Black and Latinx students. School choice in rural districts has been given little attention (Arnold et al., 2005; Mann et al., 2016), yet the results indicate the rural school districts have a limited number of charter schools and lower enrollment in these schools relative to urban districts. Thus, in many ways, school choice is a defining feature of urban districts. The results also demonstrate that urban districts have greater access to rigorous courses. Urban districts are characterized by larger disparities in both math and ELA than rural districts. The Black–White achievement gap is the largest disparity in both urban and rural districts. The results also indicate that there are significant differences in the use of suspensions between urban and rural school districts. Rates of both ISS and OSS are dramatically higher in urban districts relative to rural districts. The suspension rates of Black and Latinx students are also higher in urban districts. Chronic absenteeism is also higher in urban districts relative to rural districts.
Notwithstanding the distinct differences between rural and urban districts, the findings suggest that rural is more than “not urban.” Rural does not mean urban because of the diversity in rural and urban districts. Conceptualizations of rural districts often lack nuance, as rural and urban districts are similarly treated as a monolith. The evolving nature of urban districts (Milner, 2012a; Milner & Lomotey, 2013; Welsh & Swain, 2020) complicates the definition of rural as “not urban.” Moreover, the schooling, social, and cultural conditions of rural districts are developing along their own continuum. Parsing rurality among this variation in economic and social context and demographic changes is compounded by the emergence of alternative notions to traditional rurality such as rural cosmopolitanism (Sierk, 2017). Applying Isserman's (2005) urban–rural density typology, the results suggest that the definitions of urban and rural districts are influenced by growing numbers of mixed rural districts and mixed urban districts.
Implications and Directions for Future Research
Prior studies have raised concerns about the quality of rural education research (Arnold et al., 2005; Coladarci, 2007). Coladarci (2007) suggested that the extent to which research informs policy and practice is dependent on “the accumulation of knowledge.” This knowledge-building in turn is dependent on the definition of rurality and its scholarly implications. The results underscore the recommendations of prior studies (Coladarci, 2007; Duke & VanGronigen, 2021; Greenough & Nelson, 2015; Hawley et al., 2016) for greater attention to the definition of rural districts and the context (both schooling and social and economic) of these districts. More attention to the definition of rurality facilitates a more insightful comparison of results among rural education studies (Arnold et al., 2005). The results suggest that given the variation in the economic and social context of districts across the definitions of rurality, it is imperative that scholars include details and a discussion of the economic and social context when considering rurality. Whether studies are examining rural educational issues or policy and practices in rural contexts, educational researchers ought to define rural and situate study sites along the continuum of rural districts and schools. More comprehensive details on rural districts across the four categories employed in this study can help bolster the generalizability of studies and better interpretation of results on the different types of rural districts. Scholars may use a narrative approach to complement further numerical details on the context. Studies should also use the three NCES rural subtypes (fringe, distant and remote). Future research can further explore how the characteristics of rural and urban districts are changing over time.
In conclusion, this study adds to the discussion of the complexities involved in differentiating urban and rural districts in light of ongoing demographic, social, and economic shifts. The findings highlight the need for a more granular understanding of the conditions and circumstances of rural communities and how they shape rural schools. Indeed, as rural and urban districts continue to encroach on each other, teasing apart the relative prosperity and poverty of districts have important implications for education policy and research (Burdick-Will & Logan, 2017; Duke & VanGronigen, 2021; Lee et al., 2020; Peguero et al., 2021; Strayhorn, 2009). The expansion of the knowledge base on rural educational issues and context can be enhanced and propelled by greater attention to defining and operationalizing the changing nature of rural districts. One of the starting points of a research and policy agenda to improve rural schools is grappling with the slippery nature of conceptualizing and identifying rural schools. It is my hope that researchers continue to deepen definitional studies of the constantly changing schooling environments given the significant scholarly and practice implications. For instance, the definition of districts, especially outside of metropolitan areas, may have school finance implications (e.g., categorization of districts determining the eligibility for federal and state funding), teacher labor market implications (e.g., difference in teachers’ working conditions and well-being across contexts), as well as implications for organizing insights on education policy and practice across place and space.
Footnotes
Declaration of Conflicting Interests
The author declared no potential conflicts of interest with respect to the research, authorship, and/or publication of this article.
Funding
The author received no financial support for the research, authorship, and/or publication of this article.
Author Biography
Appendix
Replication of Table 2 and Differences Using 2018 Data.
| Original | 2018 Data | Difference | ||||||||||
|---|---|---|---|---|---|---|---|---|---|---|---|---|
| NCES rural | NCES w/dist enr <2,500 | Dist enrollment <2,500 | Not in MSA | NCES rural | NCES w/dist enr <2,500 | Dist enrollment <2,500 | Not in MSA | NCES rural | NCES w/dist enr <2,500 | Dist enrollment <2,500 | Not in MSA | |
| Total enrollment | 763.8 | 530.59 | 741.84 | 837.58 | 766 | 541 | 756 | 840 | −2.20 | −10.41 | −14.16 | −2.42 |
| # of schools | 3.32 | 2.77 | 3.29 | 3.71 | 3.5 | 2.9 | 3.2 | 3.7 | −0.18 | −0.13 | 0.09 | 0.01 |
| % of charters | 0.01 | 0.01 | 0.01 | 0.01 | 0.01 | 0.01 | 0.01 | 0.01 | 0.00 | 0.00 | 0.00 | 0.00 |
| % White | 0.81 | 0.81 | 0.78 | 0.79 | 0.79 | 0.76 | 0.76 | 0.77 | 0.02 | 0.05 | 0.02 | 0.02 |
| % Black | 0.04 | 0.04 | 0.06 | 0.05 | 0.04 | 0.04 | 0.05 | 0.05 | 0.00 | 0.00 | 0.01 | 0.00 |
| % Latinx | 0.1 | 0.1 | 0.12 | 0.1 | 0.09 | 0.1 | 0.14 | 0.11 | 0.01 | 0.00 | −0.02 | −0.01 |
| % Asian | 0.01 | 0.01 | 0.01 | 0.01 | 0.01 | 0.01 | 0.01 | 0.01 | 0.00 | 0.00 | 0.00 | 0.00 |
| % Native American | 0.04 | 0.04 | 0.04 | 0.05 | 0.03 | 0.05 | 0.04 | 0.05 | 0.01 | −0.01 | 0.00 | 0.00 |
| % English language learner | 0.03 | 0.03 | 0.03 | 0.03 | 0.04 | 0.04 | 0.05 | 0.05 | −0.01 | −0.01 | −0.02 | −0.02 |
| % Special education | 0.14 | 0.14 | 0.15 | 0.15 | 0.16 | 0.16 | 0.17 | 0.17 | −0.02 | −0.02 | −0.02 | −0.02 |
| % Free and reduced lunch | 0.42 | 0.42 | 0.41 | 0.46 | 0.44 | 0.45 | 0.44 | 0.49 | −0.02 | −0.03 | −0.03 | −0.03 |
| Segregation % FRL: avg. White student | 0.42 | 0.41 | 0.41 | 0.45 | 0.45 | 0.43 | 0.42 | 0.47 | −0.03 | −0.02 | −0.01 | −0.02 |
| % FRL: avg. Black student | 0.43 | 0.42 | 0.41 | 0.48 | 0.46 | 0.44 | 0.4 | 0.49 | −0.03 | −0.02 | 0.01 | −0.01 |
| % FRL: avg. Latinx student | 0.43 | 0.42 | 0.41 | 0.47 | 0.41 | 0.41 | 0.4 | 0.44 | 0.02 | 0.01 | 0.01 | 0.03 |
| Information index: Wh/Bl | 0.02 | 0.02 | 0.02 | 0.02 | 0.02 | 0.02 | 0.01 | 0.02 | 0.00 | 0.00 | 0.01 | 0.00 |
| Information index: Wh/La | 0.02 | 0.01 | 0.01 | 0.02 | 0.01 | 0.01 | 0.01 | 0.01 | 0.01 | 0.00 | 0.00 | 0.01 |
| Information index: FR/NON | 0.01 | 0 | 0.01 | 0.01 | 0.01 | 0.01 | 0.02 | 0.01 | 0.00 | −0.01 | −0.01 | 0.00 |
| Total districts | 6,950 | 6,594 | 10,517 | 6,184 | 6,950 | 6,594 | 10,517 | 6,184 | 0.00 | 0.00 | 0.00 | 0.00 |
| % of districts nationwide | 0.52 | 0.5 | 0.79 | 0.47 | 0.52 | 0.5 | 0.79 | 0.47 | 0.00 | 0.00 | 0.00 | 0.00 |
T-test * 0.05 ** 0.01 *** 0.001