
Abstract
Numerous studies document the inequitable distribution of teacher quality across schools. We focus instead on the distribution of principal quality, examining how multiple proxies for quality, including experience, teachers’ survey assessments of leaders, and rubric-based practice ratings assigned by principals’ supervisors, vary by measures of school advantage, using administrative data from Tennessee. By virtually every quality measure, we find that schools serving larger fractions of low-income students, students of color, and low-achieving students are led by less qualified, less effective principals. These patterns persist across urban, suburban, and rural settings. Both differential hiring/placement and differential turnover patterns by principal quality across school characteristics contribute to these patterns. Simulation evidence suggests that hiring and turnover vary in relative importance to principal sorting patterns according to the measure of quality examined and that differential principal improvement across contexts may matter as well. Complementary analyses of national survey data corroborate our main results.
Keywords
The quality of a school’s leadership is a key determinant of its performance and the opportunities it provides. Aside from higher test scores (Branch, Hanushek, & Rivkin, 2012; Coelli & Green, 2012; Grissom, Kalogrides, & Loeb, 2015), effective principals have been linked to stronger teacher instructional practices, greater teacher morale and satisfaction, reduced teacher turnover, more positive learning climates, higher quality of professional development and coherence of programs, and more positive parental assessments (e.g., Boyd, Lankford, Loeb, & Wyckoff, 2011; Brewer, 1993; Grissom, 2011; Grissom & Loeb, 2011; Ladd, 2011; Sebastian & Allensworth, 2012). Recognition of the link between how effective the school’s principal is and school outcomes has led state policymakers to target principal performance in a spate of recent reform efforts, including changes to preparation, licensure requirements, and evaluation (Cheney & Davis, 2011; Clifford & Ross, 2011; Cosner, Tozer, Zavitkovsky, & Whalen, 2015). It has also increased federal attention to principal quality, evidenced most recently in the Every Student Succeeds Act’s highlighting of leadership as a school improvement target toward which states and districts could direct federal funds (Herman et al., 2017).
With the observation that high-quality principals matter for school success comes concern that principal quality is not allocated equitably across schools. This concern stems from the robust conclusion from teacher labor market studies that less qualified, lower performing teachers are systematically found in the schools with the largest numbers of historically marginalized students (e.g., Clotfelter, Ladd, & Vigdor, 2005; Hanushek, Kain, & Rivkin, 2004; Lankford, Loeb, & Wyckoff, 2002). Studies generally assert that because facilities, resources, and other aspects of working conditions are poorer (see Simon & Johnson, 2015), teaching positions in those schools are less desirable, resulting in greater difficulties recruiting qualified teachers, higher turnover, and systematic migration of high-quality teachers toward higher achieving schools (Boyd et al., 2005; Guarino, Santibañez, & Daley, 2006), though it is possible that race and class biases affect mobility as well. To the degree that principal sorting mirrors teacher sorting, students from marginalized backgrounds will have less access to the kind of high-quality leadership that can sustain school improvement, likely reinforcing disparities in students’ opportunities to learn among schools at opposite ends of the socioeconomic spectrum.
Although it makes sense that principal sorting would be similar to teacher sorting—nearly all principals are former teachers, after all, and likely have many similar work preferences—institutional differences between teacher and principal labor markets may disrupt this alignment. For example, in many districts, teacher hiring decisions are decentralized to the school level, potentially creating competition for good teachers among schools even in the same district. Uniform salary schedules, which prevent districts from differentiating teacher pay across schools, mean that schools with higher nonpecuniary benefits (i.e., working conditions) are better positioned to compete for high-quality teachers. Moreover, collective bargaining agreements typically give districts minimal power to dismiss or transfer teachers (Cohen-Vogel & Osborne-Lampkin, 2007). These factors combine to limit districts from acting strategically with regard to the allocation of teachers across schools. In contrast, principals are more akin to “middle managers” in the larger district bureaucracy (Morris, Crowson, Hurwitz, & Porter, 1982), and districts have greater control over where they are placed. Principal hiring decisions typically are centralized, limiting principals’ local opportunities to move. Few districts collectively bargain principal contracts, meaning that districts have greater freedom to move principals to different schools. 1 Also, because salary schedules are much less common for principals than teachers, districts may have greater power to compensate principals for moving them to more challenging leadership positions. 2 In short, patterns of principal sorting need not be as inequitable as those for teachers, particularly within school districts, where district administrators theoretically have greater capacity to place high-quality principals into needier schools.
The question of whether principal quality parallels teacher quality in being inequitably distributed is an empirical one. Unfortunately, research on principal sorting (or principal labor markets more generally) is sparse (Clotfelter, Ladd, Vigdor, & Wheeler, 2006; Loeb, Kalogrides, & Horng, 2010). We contribute to this small literature by examining the sorting of public school principals using two data sources. The first is a decade-long longitudinal administrative data set from Tennessee that allows us to observe principal quality measures across schools with different characteristics over time. The second is nationally representative data on principals from the Schools and Staffing Survey (SASS), with which we assess the degree to which the patterns of sorting observed in the Tennessee data hold more generally. These data allow us to extend analysis beyond the urban districts that often have been the focus of prior work to make comparisons to principal labor market patterns in suburban and rural districts.
Using these two rich data sources, we ask the following main research questions.
Research Question 1: How are measures of principal quality distributed across schools with different concentrations of traditionally marginalized students, including low-income students, students of color, and low-achieving students?
Research Question 2: To what degree do differences in the kinds of principals hired into schools educating different groups of students explain principal sorting patterns?
Research Question 3: To what degree does differential principal turnover contribute to gaps in principal quality among different types of schools?
Sorting Among Educators
A substantial literature documents the inequitable distribution of educator quality across schools. Most of this work focuses on the distribution of teachers, showing a robust pattern that schools with larger proportions of students of color, students from low-income backgrounds, and low-achieving students tend to be staffed with teachers with lower qualifications, including less teaching experience and lower likelihoods of full certification (Clotfelter et al., 2005; Goldhaber, Lavery, & Theobald, 2015; Lankford et al., 2002). More recently, the growth of student-level data systems has allowed researchers to move beyond qualifications measures to examine the distribution of outcome-based measures of teacher performance, such as value-added, as well (Glazerman & Max, 2011; Goldhaber et al., 2015; Goldhaber, Walch, & Gabele, 2014; Isenberg et al., 2013; Sass, Hannaway, Xu, Figlio, & Feng, 2012). This line of work reports similar overall patterns: Students from marginalized backgrounds have less access to high-performing teachers.
In contrast, surprisingly few studies have systematically explored the distribution of principal quality, though some evidence suggests similar distributional patterns with respect to principal qualifications. For example, in North Carolina in the 1990s and early 2000s, the average licensure-related test scores among principals serving the highest poverty schools were 0.3 to 0.5 standard deviations lower than those of principals serving the lowest poverty schools (Clotfelter et al., 2006). Other principal qualifications, such as length of tenure, were also unequally distributed. Similarly, principals of Texas schools with larger low-income populations and lower math achievement had less experience in that school (Branch et al., 2012). In Miami, schools with a large number of marginalized students tended to have principals with less experience, less education, and an undergraduate degree from a less competitive institution (Loeb et al., 2010).
Less evidence exists on the distribution of job performance–related measures. 3 Conceptual and empirical challenges make accurate measures of principals’ value-added to student test scores, a common outcomes-based measure for teachers, difficult to estimate (Grissom et al., 2015). A few studies look instead at the distribution of low-stakes assessments of principal leadership. For example, studies that use teacher surveys to quantify the quality of leadership in a school tend to find negative correlations with the fractions of Black students, Hispanic students, and/or students receiving free or reduced-price lunch (Boyd et al., 2011; Clotfelter et al., 2006; Grissom, 2011; Ladd, 2011).
The mechanisms driving these patterns have been left underexplored. That is, it is unclear to what extent the inequitable distribution of principal quality arises from patterns across schools in principal placement, turnover, or sorting across schools over the principal career. Many principals express preferences for working in schools that are high-achieving and have fewer low-income students, perhaps because they also express preferences for other school factors correlated with student characteristics, such as parent participation, resource availability, and school safety (Loeb et al., 2010). These preferences can affect hiring by limiting the pool of qualified principal candidates for vacancies in such schools and affect turnover by making it more likely that a qualified principal seeks employment in schools more aligned with his or her preferred working conditions. At the same time, district leaders may mitigate these impacts by, for example, prioritizing hiring principals for lower income or lower achieving schools who are both highly qualified and committed to working in a more challenging school environment or targeting compensation or other resources toward retaining principals in those schools. Because principals are in middle management positions under more direct control of central leadership and less likely to be protected by collectively bargained contracts, principals may be more constrained than teachers in moving to schools with their preferred characteristics.
Prior work finds that the characteristics of principals hired differ by the concentration of student poverty in the school. For example, in their study of North Carolina, Clotfelter et al. (2006) find that brand new principals account for 67% of principals hired into schools with a majority of low-income students, compared to just 60% for other schools. They also conclude that the concentration of less qualified principals in high-poverty schools is driven largely by patterns of entry, with novice principals in those schools having systematically lower qualifications than their colleagues in low-poverty schools. The authors hypothesize that these differences may reflect the generally lower qualifications of the teaching pool from which those schools typically draw administrators. Loeb et al. (2010) similarly find that high-poverty schools in Miami are much less likely than low-poverty schools to fill a principal vacancy with an experienced principal. They find, however, much less stark patterns in principal qualifications among novice principals than the North Carolina study. First-time principals in their data in high- and low-poverty schools had similar levels of total experience in the district and similar educational qualifications.
Higher rates of turnover can also contribute to principal quality disparities. Several studies suggest that principals are more likely to leave schools with large numbers of low-income, low-achieving, or racial/ethnic minority students (Clotfelter et al., 2006; Fuller & Young, 2009; Gates et al., 2006; Grissom & Bartanen, 2018). Higher turnover rates mean lower principal tenure in the school and more frequent vacancies, which can further exacerbate quality differences resulting from differential principal hiring in schools with larger traditionally marginalized populations. That is, if principal job performance improves with experience (Clark, Martorell, & Rockoff, 2009), then frequent turnover means systematic replacement of outgoing principals with newer principals who are less likely to be effective.
Building on prior research, we begin by documenting patterns in the distribution of principal quality in Tennessee. We then use the 2011–2012 SASS to explore (to the extent possible) the degree to which these patterns hold nationally. The Tennessee data offer two main advantages in examining the distribution of principal quality over what has been possible in prior work. First, we can use the Tennessee data to construct more comprehensive measures of principal qualifications from principals’ prior job histories. This is particularly important for examining hiring disparities as many new-to-school principals do not have prior principal experience. Second, the Tennessee data permit examination of the distribution of quality using not only qualifications measures and the kinds of survey-based teacher reports of leadership used in prior work but also measures of effectiveness from the statewide principal evaluation system, such as supervisors’ rubric-based ratings of principal practice. Standardized performance ratings can provide a more explicit accounting of gaps across schools based on actual leadership practice, which may not correlate strongly with qualifications. While more limited in the measures it makes available, SASS allows for a nationally representative look at principal quality measures.
Data and Measures
Our main analyses draw on longitudinal administrative personnel data provided by the Tennessee Department of Education (TDOE). Tennessee is a relatively large and diverse state, operating approximately 1,800 schools in 146 districts that serve 996,000 students, 31% of whom are Black or Hispanic and 58% of whom are eligible for subsidized lunches. 4 The personnel files provide principal background and job history data from 2002 to 2017. We match these data to school files that contain annual information on schools’ racial/ethnic composition, free/reduced lunch rates, and average performance on the state’s standardized math and reading achievement tests 5 as well as information from the Common Core of Data (CCD) about school locale type (urban, suburban, town/rural 6 ). This latter information is only available beginning in 2007, so we focus our analysis on the period from 2007 to 2017. 7 In each year, we identify approximately 1,700 principals. Descriptive statistics for principals and schools are shown in Table 1.
Descriptive Statistics

Note. Includes principals in Tennessee from 2006–2007 to 2016–2017. Supervisor and teacher ratings are available beginning in 2011–2012. FRPL = free/reduced-price lunch; SLLA = School Leaders Licensure Assessment.
Measuring Principal Quality in Tennessee
The key empirical challenge to investigating the distribution of principal quality across schools is that direct measures are difficult to come by. Fortunately, Tennessee has invested in creating multiple measures of principal effectiveness, two of which we use in this analysis. Additionally, we construct a variety of plausible proxies for principal quality that have been used in prior work.
The first measure comes from the Tennessee Educator Acceleration Model (TEAM) for the 2011–2012 through 2016–2017 school years. TEAM is the state’s educator evaluation system. Fifty percent of the TEAM evaluation for principals comes from ratings of principal performance on a rubric pegged to the Tennessee Instructional Leadership Standards. 8 These ratings are based on formal observations conducted by the principal’s supervisor. In this analysis, we use principals’ average yearly observation scores—the measure used by the state to calculate summative evaluation ratings. 9 We refer to this measure as supervisor ratings.
A potential concern with rubric-based observation scores is that they conflate differences in effectiveness with differences in school context or in how principal performance is judged by the district. One approach to mitigate this bias is to “residualize” the scores—namely, regress them on school characteristics and compute the residuals. This procedure mechanically removes any correlation between ratings and the contextual characteristics included in the model. However, to the extent that there are true differences in principal quality by school context (e.g., between high- and low-poverty schools), this type of residualization will overcorrect for bias from contextual differences. 10 Instead, we residualize supervisor ratings on district fixed effects, which forces the average score in each district to be zero. We also estimate multivariate models that regress the unadjusted scores on school contextual variables and district fixed effects, which limits the identification of principal quality gaps to schools within the same district. 11
Additionally, we use low-stakes survey responses of teachers that assess their school’s leadership. The responses are from the Tennessee Educator Survey, a yearly statewide survey of teachers jointly administered by the Tennessee Education Research Alliance and the TDOE. 12 In the first 3 years of the survey, teachers were randomly assigned to respond to different modules, one of which contained a set of questions evaluating their principal’s leadership. Items ask, for example, whether the school’s principal consistently monitors student academic progress, communicates a clear vision for the school, or sets high standards for teaching. Beginning in 2014–2015, the survey was redesigned to administer these leadership items to all teachers. Finding that responses measured a single latent principal performance construct, we compute the standardized factor score, which we refer to as teacher ratings. 13
Beyond these direct measures of principal quality, we examine several principal qualifications measures that are plausible proxies for principal quality. The first is principal experience. Research suggests that school performance is lower under novice principals and that principal effectiveness increases as they gain experience (Béteille, Kalogrides, & Loeb, 2012; Clark et al., 2009; Dhuey & Smith, 2014). We thus create two measures of novice principal: an indicator for the principal being in his or her first year as a principal and an indicator for being in the first 3 years. Across years, 11% of Tennessee principals are in their first year, on average, and 33% are in their first 3 years (see Table 1). 14 Prior work also suggests that school performance is lower following administrative turnover (Béteille et al., 2012; Miller, 2013), so we create a variable for first year in school and first 3 years in school for principals beginning in a new school regardless of whether they have prior experience as a principal elsewhere. Eighteen percent of principals are in their first year as principal in the school, and 47% are in their first 3 years, on average.
The next set of measures is based on principals’ educational experiences. We create an indicator for holding an education specialist degree or doctorate as one’s highest degree. Evidence on the link between degree attainment and principal performance is minimal, though at least one study found that principals with specialist and doctoral degrees were more likely to engage in management behaviors associated with greater student learning gains (Grissom & Loeb, 2011). Forty percent of Tennessee principals hold one of these degrees. Also, for principals seeking initial certification since the 2003–2004 school year (when the state first required the test), we obtained School Leaders Licensure Assessment (SLLA) scores from the Educational Testing Service (ETS) and matched them to the personnel file. 15 The SLLA is a test of knowledge believed necessary for competent professional practice and is aligned to the Interstate School Leaders Licensure Consortium leadership standards. In total, we have SLLA scores for 25% of the sample; rates of missingness were very similar across each of our categories of school context. 16
The Unequal Distribution of Principal Quality Across Schools
We begin by examining the distribution of principal qualifications and effectiveness across different categories of Tennessee schools. Specifically, Table 2 categorizes schools according to four proxy measures of societal (dis)advantage: average test score performance (levels), student poverty, percentage of students of color in the school, and locale type (i.e., urban, suburban, town, rural). The achievement index, which is the average standardized student-weighted score for math and reading in the school, is shown by quintile: lowest quintile, middle 60%, and highest quintile. Student poverty is split into three categories by the fraction of the school’s student body that is eligible for free or reduced-price lunch (FRPL): less than 20%, 20% to 80%, and more than 80%. 17 We refer to these groups as low-poverty, medium-poverty, and high-poverty, respectively. The percentage of students of color is similarly broken into three groups (0%–20%, 20%–80%, 80%–100%). 18 For each quality measure (columns), we conduct significance tests for the difference between the first and second/third school group. Specifically, the p-values refer to the coefficients from a regression model where the relatively “advantaged” school group (highest quintile of achievement, 0%–20% FRPL, 0%–20% students of color, suburban locale) is the omitted category. 19
Distribution of Principal Quality by School Characteristics in Tennessee

Note. Asterisks indicate significant differences from the base categories (highest quintile of achievement, 0%–20% FRPL, 0%–20% students of color, suburban). FRPL = free/reduced-price lunch.
p < .10. **p < .05. ***p < .01.
Looking across measures of principal quality, a clear, consistent pattern emerges. As in prior studies of the distribution of teacher qualifications (e.g., Lankford et al., 2002), schools with large proportions of low-achieving students, low-income students, and students of color are more likely to employ inexperienced principals, principals who are new to that school, principals who obtained lower scores on the SLLA, and principals who were rated lower by their supervisors and teachers. For example, 13% of schools in the lowest achievement quintile employ a first-year principal compared to only 9% of schools in the highest quintile. Low-achievement schools are similarly more likely than the highest achievement schools to employ a principal who is new to the school (23% to 15%). Principals in the lowest achieving schools also score 3.3 points lower on the SLLA than principals working in low-poverty schools, which equates to 39% of a standard deviation in the SLLA distribution, a large difference.
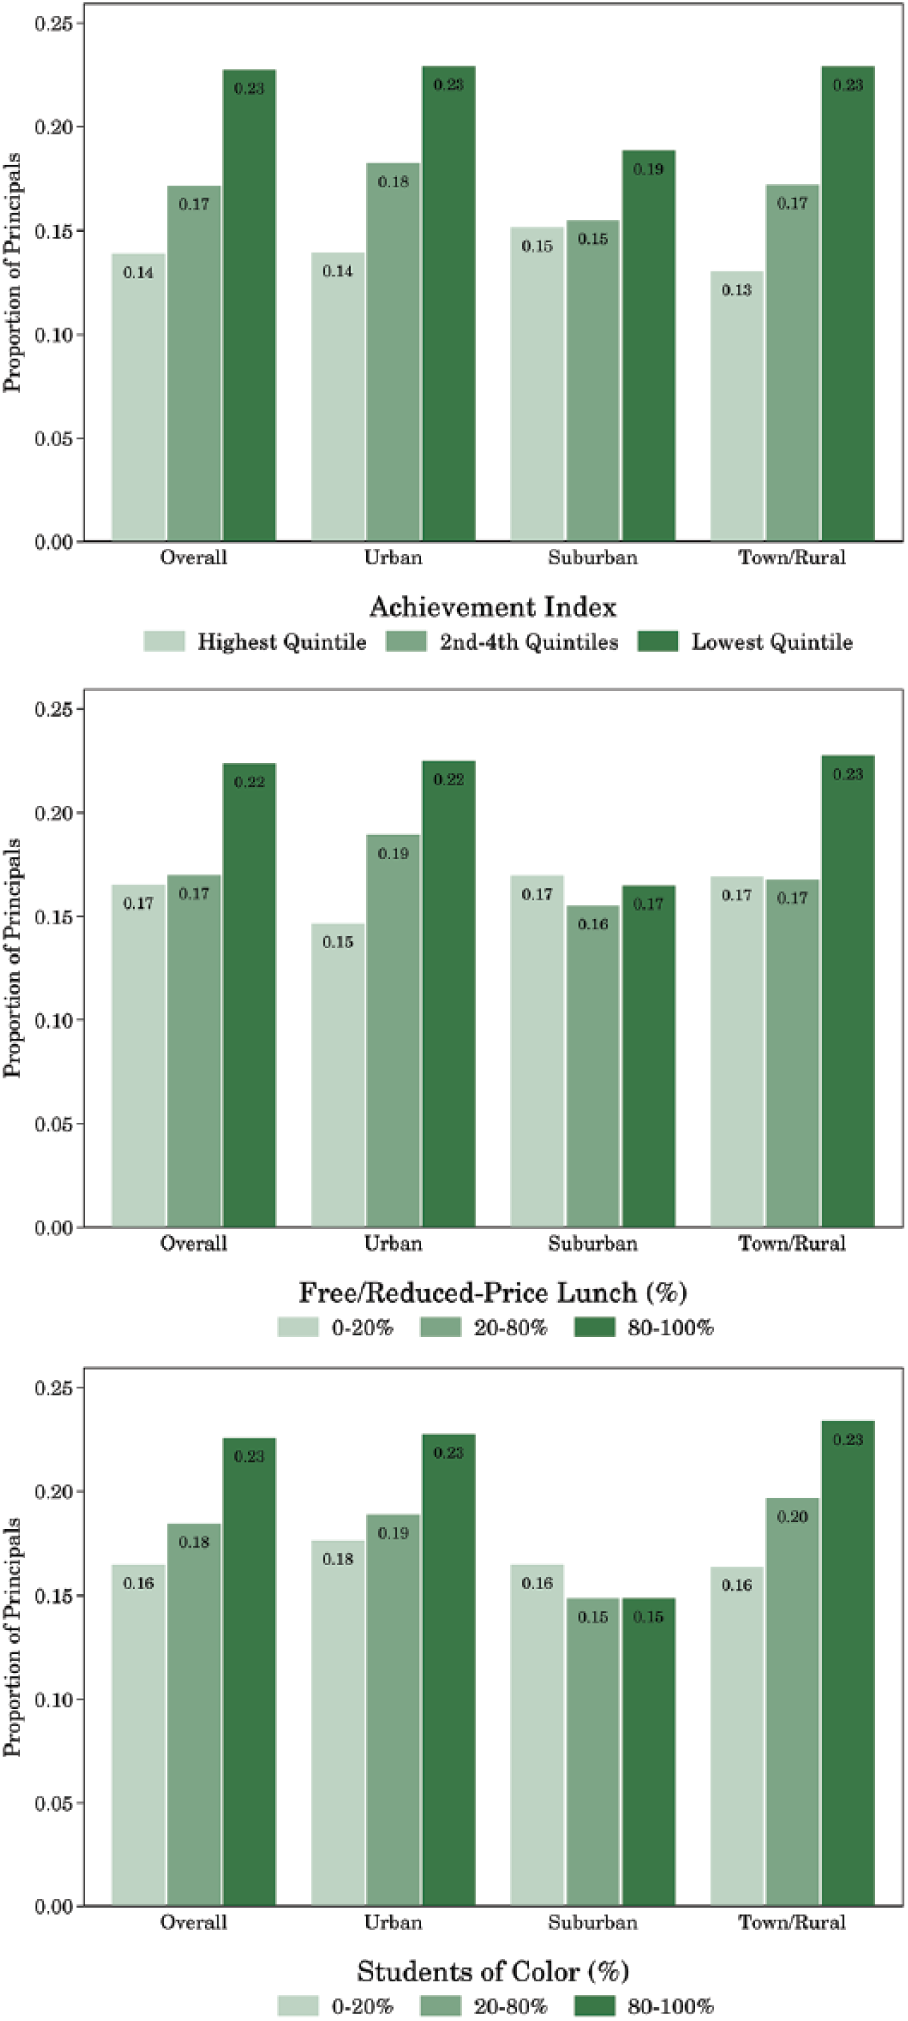
Figure 1 further illustrates the disparities in principal experience and tenure. For each individual panel, the breakdown by school characteristics (school achievement in Panel A, student poverty in Panel B, and students of color in Panel C) is shown overall and within locale groups (urban, suburban, town/rural). Importantly, patterns tend to hold across locale types despite their differences in labor markets and distributions of student characteristics. Schools attended by larger numbers of marginalized students in all geographic contexts have more inexperienced principals.

Principal experience and tenure by school characteristics in Tennessee.
Table 2 shows that principals in low-achievement schools are, on average, more than one-third of a standard deviation below average in terms of effectiveness as measured by supervisor ratings, and the gap between principals in low-achievement versus high-achievement schools is an astounding 0.88 SD (p < .01), or about half a rating point. Similar disparities exist between schools across poverty, race/ethnicity, and locale. Comparing high- and low-poverty schools, the disparity in supervisor ratings is more than a full standard deviation. As an additional check, we examine “adjusted” scores that rely on within-district variation in school characteristics. Here, we still see that there are substantial differences between low-achievement and high-achievement schools, high-poverty and low-poverty schools, and schools serving low and high percentages of students of color, though the magnitude of the disparities is smaller. Additionally, there are no differences in adjusted scores by locale type, which makes sense given that there is little variation in school locale within districts. That we still find disparities in ratings even after adjusting for between-district differences further suggests true differences in average principal quality between schools serving higher and lower numbers of marginalized students. 20
When effectiveness is measured using teacher perceptions of leadership performance (teacher ratings), principals in low-poverty and high-achievement schools are more effective than principals in high-poverty and low-achievement schools (p < .01), though the disparities are smaller in magnitude. Similarly, schools in urban areas and with large numbers of students of color tend to have lower rated principals.
Figure 2 shows meaningful disparities in terms of the full distribution of supervisor (Panel A) and teacher ratings (Panel B). Vertical lines show the mean differences from Table 2. One possibility is that the mean differences in ratings are driven by the propensity to have more or fewer very low or very high scoring principals. Figure 2 demonstrates that this is largely not the case—the distribution of ratings has a similar bell shape across school contextual categories. The one clear exception to this pattern is supervisor ratings in low-poverty schools, where there are a large number of principals who have nearly perfect supervisor ratings and almost no principals who score more than one standard deviation below the mean. 21

Distribution of principal ratings by school characteristics.
Studies demonstrate that sorting patterns for teachers systematically disadvantage urban schools (e.g., Lankford et al., 2002). Table 2 shows that town/rural schools in Tennessee face principal quality deficits that are as large or larger. For instance, town/rural principals have the lowest scores on the SLLA and are more likely to employ inexperienced and new-to-school principals. As in studies of teachers, suburban schools show a consistent pattern of advantage in most measures of leadership quality.
Finally, one question raised by Table 2 is the extent to which the descriptive disparities in principal quality by different measures of school context are driven by one contextual measure that happens to be correlated with the others. To explore this possibility, we estimate multivariate models for a selected set of principal quality measures. By including all of the school contextual categories in a single model, we can see whether one is relatively more important in explaining disparities. As shown in online Appendix Table A1, the disparities in principal quality are most clearly tied to differences in the average achievement level of the school; though for some measures, poverty maintains a correlation even after achievement is accounted for.
Disentangling Sorting: Hiring and Turnover
Inequitable sorting of principals by school characteristics can occur in two main ways: Schools attended by higher concentrations of marginalized students can tend to hire less qualified and less effective principals, or they can be less likely to retain high-quality principals when they hire them. This section examines these two mechanisms. Differentiating between hiring and turnover helps illuminate what policy approaches might be useful for reducing the quality gaps.
Quality of New Hires
First, we examine the characteristics of newly hired principals in Tennessee. That is, we summarize the characteristics of principals in their first year in a given school regardless of whether they have prior principal experience. Means for all new hires and for new hires broken down by school characteristics are shown in Table 3. The first columns show different types of prior administrative experience. The last two columns show the proportion of new hires with an education specialist or doctoral degree and the average SLLA score.
Qualifications of New Hires by School Characteristics in Tennessee

Note. Asterisks indicate significant differences from the base categories (highest quintile of achievement, 0%–20% FRPL, 0%–20% students of color, suburban). AP = assistant principal; SLLA = School Leaders Licensure Assessment; FRPL = free/reduced-price lunch.
p < .10. **p < .05. ***p < .01.
The average new hire in a high-achievement school has 5.3 years of prior experience as a principal or assistant principal (AP) compared to 4.6 years for new hires in low-achievement schools. This gap reflects longer preparation as an AP (3.3 years vs. 2.7 years) rather than more prior experience as a principal. There also are large differences between high-/medium-achievement (28%) and low-achievement (12%) schools in whether the new hire served as an AP in the same school. We also find that low-achievement schools are less likely to hire (or be able to hire) principals with an EdS/doctorate degree and that their new hires have lower average SLLA scores. Patterns are similar by student poverty, with differences between high- and low-poverty schools in AP experience even more pronounced.
Disparities in hiring among schools serving different proportions of students of color are less clear due to different hiring patterns in urban/suburban versus town/rural schools. Across almost all measures of administrator experience, schools in town/rural settings hire less qualified principals. The average newly hired principal in a town/rural school has roughly 1.3 years of prior principal experience compared to 2 years in urban/suburban schools. The same disparity exists for AP experience; roughly 80% of newly hired principals in urban/suburban schools have AP experience compared to 66% in town/rural schools. One reason for the large disparity in AP experience across locales is that town/rural schools tend to have smaller schools with fewer administrators, providing aspiring principals fewer opportunities to serve as APs. Additionally, while town/rural schools have new hires with lower average SLLA scores, they are slightly more likely to have a terminal degree, mirroring a pattern in Table 2.
While observable characteristics such as prior experience help illustrate hiring disparities among schools with different characteristics, we are ultimately interested in comparing the effectiveness of these new hires. Supervisor ratings follow similar patterns as found in Table 2. There are stark differences across different categories of school advantage. New hires in high-achievement and low-poverty schools have above-average supervisor ratings (0.03 SD and 0.29 SD) compared to new hires in low-achievement and high-poverty schools, where ratings are well below average (–0.63 and –0.63, respectively). As before, we find an advantage for suburban schools (–0.26) relative to town/rural (–0.38) and urban (–0.49) schools. Teacher survey measures show similar patterns.
One challenge in examining the supervisor and teacher ratings from the first year in a principal’s school is that their distributions may not be clean to interpret if they are biased by school characteristics. Again we can compare the adjusted ratings, which account for differences in average ratings between districts. Using these adjusted ratings narrows the gaps compared to the first column; however, our substantive findings remain the same.
As as an additional measure, we examine the ratings of new-to-school principals from their prior job if they were working as an administrator. These ratings may be affected by the characteristics of the prior school but should nonetheless reflect the district’s assessment of the leader’s effectiveness (and presumably, the best available evidence about the leader’s effectiveness at the time he or she was hired into the new school). Table 4 reports the results. 22 The average new hire with prior principal experience has a below-average supervisor rating (–0.23). However, more effective principals sort to more advantaged schools. For example, the average of prior-year ratings among newly hired principals in high-achievement schools is 0.13 compared to –0.47 in low-achievement schools. Comparing the adjusted prior ratings, the gap shrinks to roughly 0.25 SD but is still statistically significant at a 95% confidence level. Similar differences exist when we classify schools by student poverty, race/ethnicity, and locale. Disparities in prior ratings of new hires are similar in magnitude to the disparities in first-year scores, supporting the contention that disparities are not completely driven by a tendency for principals in advantaged schools to receive higher evaluation scores. 23 Finally, among new hires with supervisor ratings as an AP, the difference between low-achievement and high-achievement schools is more than half a standard deviation, with an even larger disparity between high-poverty and low-poverty schools (0.79 SD).
Effectiveness of New Hires by School Characteristics in Tennessee

Note. Asterisks indicate significant differences from the base categories (highest quintile of achievement, 0%–20% FRPL, 0%–20% students of color, suburban). AP = assistant principal; FRPL = free/reduced-price lunch.
p < .10. **p < .05. ***p < .01.
Principal Turnover
We turn to principal turnover in Tennessee to investigate the second possible reason for principal sorting. Table 5 summarizes the proportions of principals who leave their positions (binary turnover) in addition to five differentiated turnover categories: (a) transfer to a different school in the same district; (b) transfer to a school in a different district; (c) move to a central office position; (d) move to a non-principal, school-level position; and (e) leave the education system. On average, 18% of Tennessee principals leave their positions each year. Four percent move to another school in the district, less than 1% move to another school in a different district, 3% are promoted to a central office position (e.g., instructional supervisor, superintendent), 3% are demoted to a school-based position (e.g., assistant principal, teacher), and 7% are no longer working in the Tennessee public education system.
Principal Turnover in Tennessee

Note. Transfer (within) are principals who move to another principal position in the same district, while transfer (across) are moves to a different district. Promotions are principals who move to a central office position. Demotions are principals who move to a non-principal school-level position (e.g., assistant principale). Exits are principals who are no longer working in the K–12 system (e.g., retirements, moves out of state). Asterisks indicate significant differences from the base categories (highest quintile of achievement, 0%–20% FRPL, 0%–20% students of color, suburban). FRPL = free/reduced-price lunch
p < .10. **p < .05. ***p < .01.
Schools with larger marginalized populations systematically face higher turnover rates. The largest gap is between low-achievement and high-achievement schools (23% vs. 14% turnover rate). Additionally, 22% of principals at high-poverty schools do not return as principals the following year, compared to 17% at low-poverty schools. Urban schools (21%) have substantially higher turnover rates than suburban (16%) and town/rural (17%) schools. Examining specific types of turnover, we find that principals in low-achievement, high-poverty, more nonwhite, and urban schools are the most likely to transfer within the district (6%). Approximately one-third of principal turnover cases involve position changes—to either central office or lower school-level positions. Principals working in low-achievement and high-poverty schools have the highest rates of demotion and are the most likely to exit the education system.
Figure 3 breaks down principal turnover rates by school characteristics within locale groups. Across all three panels, patterns for both urban and town/rural schools tend to mirror the overall pattern: substantially higher turnover in the least advantaged schools. Suburban schools follow this same pattern with respect to achievement, but their rates of turnover between traditionally advantaged and disadvantaged schools are more similar for the other two measures. 24
Principal turnover by school characteristics in Tennessee.
Simulating the Principal Quality Gap
While the previous section documents substantial hiring and turnover differences across schools according to measures of marginalization, we have not yet identified the degree to which each of these mechanisms drives the principal quality gap in Tennessee. Next we conduct a simulation to uncover the relative importance of these components. We draw on a framework described in Goldhaber, Quince, and Theobald (2018) that examines teacher quality gaps in North Carolina and Washington. Here we provide a basic description and results; online Appendix C contains the details of the simulation (including all of the parameters used). The intuition of our analysis is to use the observed rates of hiring and turnover to simulate the quality gap over time, beginning from an arbitrary equal distribution of principal quality. Starting from an assumed equal distribution allows us to examine the extent to which differential rates of hiring and turnover contribute to the unequal distribution of principal quality.
To be specific, we conduct separate simulations that examine gaps among high-achievement, middle-achievement, and low-achievement schools for two measures of principal quality: principal experience and supervisor ratings. For principal experience, we split principals into three groups: 0 to 2 years, 3 to 5 years, and 6 or more years of prior principal experience. For supervisor ratings, placement is determined by the quartile ranking of average adjusted observation score from the current year and all prior years. We use the average of prior and current scores to minimize instability in ratings while still allowing principals to vary in their effectiveness over time. We operationalize the principal quality gap as the difference in the percentage of “low-quality” (i.e., 0–2 years of experience or bottom quartile of ratings) principals between low-achievement (or middle-achievement) and high-achievement schools.
The components of the principal quality gap in our simulation are exits, promotions, demotions, transfers, new hires, and reclassifications (i.e., moves from one quality category to another). 25 Differences in these rates across categories of school advantage will affect the distribution of principal quality. Reclassifications capture changes in principal experience and supervisor ratings over time. Instead of assuming that a principal’s quality is fixed, our simulation allows for principals to gain experience and change effectiveness (i.e., receiving higher or lower supervisor ratings). For principal experience, differential reclassification cannot contribute to principal quality gaps as all principals gain experience at the same rate. For supervisor ratings, however, we allow for the possibility that principals in high-achievement and low-achievement schools reclassify (i.e., move between quartiles in the distribution of scores) at different rates.
To parse out the individual contribution of each component of the principal quality gap, we run a separate simulation for each component in which all other components are equal across school groups. We repeat this procedure for each component and sum the individual gaps to obtain the total gap in principal quality (Goldhaber et al., 2018). For both principal experience and supervisor ratings, the simulated gap is very close to the actual gap, which suggests our simulation is a reasonable approximation for sorting dynamics in Tennessee.
Table 6 contains the simulation results for principal experience. Panel A shows the gap between low-achievement and high-achievement schools in terms of the proportion of principals with fewer than 3 years of prior principal experience. Panel B shows the gap between middle-achievement and high-achievement schools. The simulation begins (year 0) with no principal quality gaps and runs for 10 years. The rightmost column shows the contribution of each component as a percentage of the total gap. We focus our discussion of the results on the gaps between low-achievement and high-achievement schools.
Simulated Principal Quality Gap, Inexperienced Principals (0–2 years of experience)

Note. Each gap represents the difference between the given school category and highest quintile achievement schools in the percentage of principals with two 2 fewer years of prior principal experience. Online Appendix C describes the simulation details, including tables with the parameters derived from the Tennessee data. The “true gap” between low-achievement (middle-achievement) and high-achievement schools is 0.11 (0.07).
The gap between low-achievement and high-achievement schools is 0.11, which means a low-achievement school is 11 percentage points more likely to be led by an inexperienced principal than a high-achievement school. This gap closely mirrors the empirical gap shown in Table 2. The largest contributor to this experience gap is differential exit rates. For example, if the only difference between principals in high- and low-achievement schools was their exit rates, the principal experience gap would be 5.3 percentage points. Similarly, higher demotion rates in low-achievement schools increase the relative proportion of inexperienced principals. These components operate similarly in terms of increasing the principal quality gap; principals lost to exit or demotion are filled by new hires, who tend to have less experience.
Principal transfers also contribute to quality gaps, though to a lesser extent. This contribution is driven by two factors. Low-achievement schools have higher overall transfer rates (see Table 5), and the probability of moving from a low-achievement to high-achievement school is greater than the probability of moving from a high-achievement to low-achievement school. 26
In contrast, promotion and hiring actually decrease gaps, albeit only slightly. While overall promotion rates are roughly equal between principals in high- and low-achievement schools, promoted principals in high-achievement schools tend to be more experienced than their counterparts in low-achievement schools. Thus, the loss in experience due to promotions is greater in high-achievement schools, which shrinks the quality gap. For hiring, low-achievement schools are slightly less likely than high-achievement schools to hire an inexperienced principal, which also shrinks the quality gap. 27
Table 7 shows the simulation results for supervisor ratings. Panel A shows that the quality gap is 0.14, meaning that the difference between low-achievement and high-achievement in the proportion of principals in the bottom quartile of supervisor ratings is 14 percentage points, which is almost exactly equal to the empirical gap. The gap between middle-achievement and high-achievement schools in Panel B is smaller (0.09), but the contribution of the individual components to the total gap is similar.
Simulated Principal Quality Gap, Low-Rated Principals (bottom 25% supervisor rating)
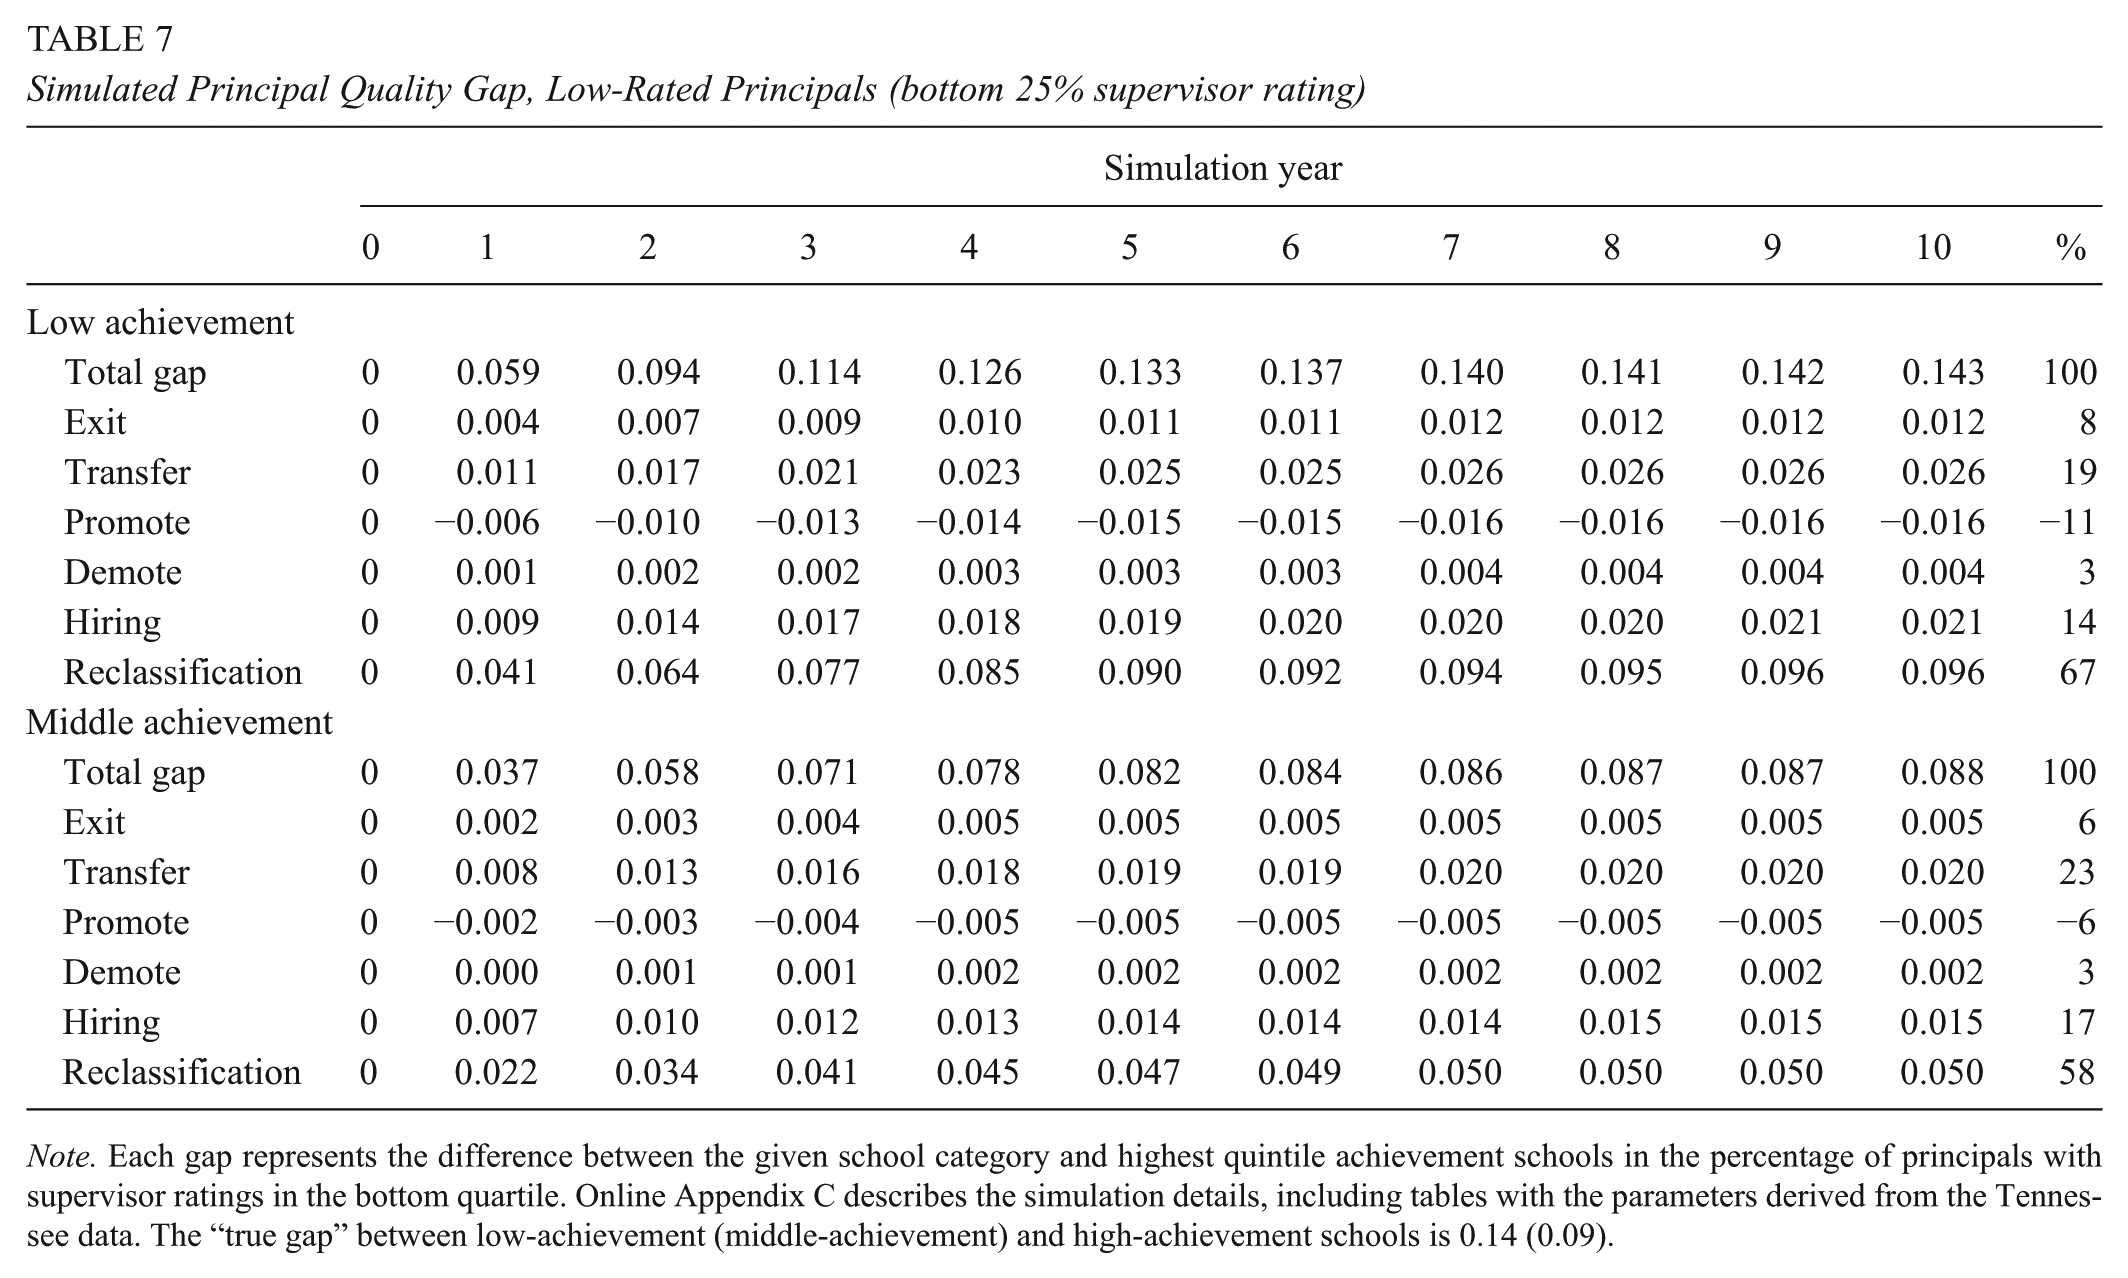
Note. Each gap represents the difference between the given school category and highest quintile achievement schools in the percentage of principals with supervisor ratings in the bottom quartile. Online Appendix C describes the simulation details, including tables with the parameters derived from the Tennessee data. The “true gap” between low-achievement (middle-achievement) and high-achievement schools is 0.14 (0.09).
In contrast to the experience simulation, exits and demotions contribute little to the supervisor ratings gap. Instead, two-thirds of the total gap is explained by differential reclassification rates of principals in high-achievement versus low-achievement schools. Online Table C15 shows that principals in high-achievement schools are more likely than principals in low-achievement schools to improve their ratings over time, particularly among those in the bottom quartile. For example, among those with ratings in the bottom 25% of the distribution in a given year, the probability of moving into the middle 50% in the following year is 34% for principals in high-achievement schools compared to 26% for principals in low-achievement schools. Relatedly, principals in low-achievement schools are also more likely to move down in the distribution. Among principals working in low-achievement schools who score in the top quartile of ratings in a given year, 17% will move out of the top quartile in the following year compared to 12% of principals in high-achievement schools. These differential reclassification rates help produce the disparities in adjusted supervisor ratings shown in Table 2.
The remainder of the quality gap is explained by transfers and hiring. Movement from low-achievement to middle- or high-achievement schools is infrequent, but it is more likely among principals with average to high supervisor ratings. 28 Low-achievement schools are also more likely to hire a principal that scores in the bottom quartile in their first year (48%) than high-achievement schools (41%). Despite their higher frequency in low-achievement schools, exits and demotions explain very little of the ratings gap because they are concentrated among principals with the lowest ratings. Finally, promotion rates actually serve to decrease the quality gap between high-achievement and low- or medium-achievement schools as the greatest rates of promotion to central office are among highly rated principals in high-achievement schools.
What do we learn from these simulation results? First, the drivers of principal sorting vary by the measure of principal quality. The disparity in principal experience between low-achievement and high-achievement schools shown in Table 2 is largely a function of higher turnover rates, which we documented in Table 5. Because replacement principals tend to be relatively inexperienced regardless of the achievement level of the school, these higher turnover rates translate to low levels of principal experience in low-achievement schools. However, when we consider how those principals are rated by their supervisors, we come to different conclusions. Principals who leave their positions tend to have lower ratings, on average (Grissom & Bartanen, 2018), and partly as a result, higher turnover rates are not the main driver of disparities in supervisor ratings. Instead, disparities result from the tendency of low-rated principals in high-achievement schools to move out of the bottom quartile of ratings at higher rates than principals in low-achievement schools. Principals in low-achievement schools do not improve their ratings over time to the same degree as their colleagues in other schools. 29
Do Tennessee’s Patterns Hold Nationally?
To assess the generalizability of the Tennessee findings, we draw on data from the 2011–2012 SASS, administered by the National Center for Educational Statistics (NCES). Although cross-sectional and more limited in measures of principal quality, SASS data are nationally representative, collected from a stratified random sample of public schools. The analysis reported in the following utilizes data on approximately 7,500 public schools. In addition to the main survey, NCES implemented the Principal Follow-Up Survey (PFS) in the year following to collect information on the responding principal’s whereabouts. We utilize PFS data to calculate measures of principal turnover.
Table 8 summarizes the distribution of principal quality nationally. Schools are categorized by three of the same four categories, with the only difference being that we do not have a measure of school achievement. Distributional patterns observed among schools in Tennessee appear to hold nationally. Schools with the highest concentrations of marginalized students are led by less qualified principals. High-poverty schools, for example, employ principals with 1.3 fewer years of experience, on average, than low-poverty schools. They are also more likely to employ inexperienced principals (i.e., principals in their first to third year) than those in the lowest category (28%–20%). Their principals have spent 0.5 fewer years in that school building. They are also less likely to hold an education specialist degree or a doctoral degree (34% compared to 40% in the low-poverty group).
Distribution of Principal Quality by School Characteristics in the 2011–12 SASS

Note. SASS survey weights used. Asterisks indicate significant differences from the base categories (0%–20% FRPL, 0%–20% students of color, suburban). Total principal experience does not include current year. Teacher ratings not mean zero due to weighting. SASS = Schools and Staffing Survey; FRPL = free and reduced-price lunch.
p < .10. **p < .05. ***p < .01.
Moreover, on average, they score 0.24 standard deviations lower on the subjective performance measure constructed from teacher survey responses. 30 Each of these differences is statistically significant. The patterns are similar or even more pronounced when looking across percentage students of color. 31 However, somewhat in contrast to Tennessee, the national data show less of a clear suburban advantage in terms of principal quality measures. While rural/town schools are more likely to employ novice principals than suburban schools (8% and 6%, p < .05) and their principals are less likely to hold an education specialist degree or a doctoral degree (33% and 40%, p < .01), they have similar experience levels and performance ratings from teachers. Urban schools are led by principals with lower performance ratings than suburban schools (p < .01). In addition, they tend to hire principals with fewer years of experience than those in suburban schools (p < .01).
Table 9 replicates, to the extent possible, the hiring and turnover patterns using the SASS data. In comparison to the Tennessee data, for new hires, we have fewer measures of prior experience and performance. We find that while new hires in schools serving low proportions of FRPL-eligible students or students of color tend to have more years of prior principal experience, the differences are small in magnitude and not statistically significant. Similar to our findings in Tennessee, new hires in traditionally disadvantaged schools have lower average performance (as rated by teachers) in their first year than new hires in more advantaged schools. Also, while principal turnover rates nationally (22%) are higher than in Tennessee (18%), turnover disparities by school categories mirror our prior findings. For example, 28% of principals in high-poverty schools turned over after 2011–2012 compared to 21% in low-poverty schools (p < .01). 32 Nationally, transfers are the largest driver of turnover disparities.
Hiring and Turnover by School Characteristics in the 2011–12 SASS

Note. SASS survey weights used. Asterisks indicate significant differences from the base categories (0%–20% FRPL, 0%–20% students of color, suburban). Total principal experience does not include current year. Teacher ratings not mean zero due to weighting. SASS = Schools and Staffing Survey; FRPL = free and reduced-price lunch.
p < .10. **p < .05. ***p < .01.
Discussion and Conclusions
Our analysis of principal quality measures by student characteristics finds strong evidence of inequitable leadership sorting. By virtually every measure we examine, less advantaged schools face leadership quality deficits; schools with large proportions of low-income students, students of color, and low-achieving students are led by principals with weaker qualifications and lower performance ratings. Also, although mostly overlooked in prior work, these gaps are often just as apparent in rural schools as in their urban counterparts.
The lamentable punch line of such sorting is that the kind of effective leadership required for school success is scarcer in precisely the kinds of school that would benefit from it most. For instance, in Tennessee, 38% of principals in schools in the bottom quintile of achievement are in their first 3 years on the job. Research demonstrates that novice principals generally have less developed instructional leadership, school management, and problem-solving skills, which likely are necessary for school improvement (e.g., Daresh, 1986; Grissom & Loeb, 2011; Leithwood & Steinbach, 1995). Less experienced principals in these schools may be even less prepared, having served less time—though only about half a year less—in AP positions, often the training ground for future principals (Bastian & Henry, 2015). More important than the experience differences, practice ratings for principals in these same schools fall well below average. Prior work has shown that lower practice ratings predict lower student achievement growth, higher turnover rates among effective teachers, and other key school outcomes (Grissom & Bartanen, 2019; Grissom, Blissett, & Mitani, 2018). In short, principals in the schools with the greatest needs are the least positioned to drive improvement, and the patterns of principal sorting we observe likely contribute to opportunity and performance gaps between schools serving higher and lower concentrations of marginalized student populations.
Inequitable principal sorting is thus a significant policy problem. Addressing it requires understanding its drivers. Our analysis suggests that these inequitable distribution patterns are driven both by higher turnover among principals in challenged schools and disparities in hiring of new leaders to replace departing principals. For instance, the yearly principal turnover rate of schools in bottom quintile of student achievement in Tennessee is 23% compared to 14% for schools in the highest quintile. High rates of turnover in such schools in rural areas in Tennessee are particularly striking. Similar disparities exist across a broad range of principal characteristics and categories of school advantage. New hires have fewer total years of administrator experience, lower performance ratings from their prior roles as assistant principals, lower licensure examination scores, and lower effectiveness in their first year; though, importantly, data limitations mean that we cannot be sure whether these differences are driven by differences in districts’ hiring practices or decisions or differences in application and job-seeking behavior by candidates with higher or lower qualifications. Moreover, our simulation results uncover that principals in more challenged schools may improve more slowly with experience as well, further exacerbating quality gaps.
Importantly, districts likely have more policy options in addressing inequitable principal sorting than they have in the case of teachers. Administrators typically do not collectively bargain contracts, and salaries often are not set by salary schedules. As middle management, principals are more subject to district-level reassignment decisions. Indeed, district reassignment decisions may constitute part of the problem if district leaders choose to move principals in challenging leadership environments more frequently; a limitation of our analysis is that we cannot differentiate principal-initiated transitions from district-initiated ones. We suggest that districts direct their efforts toward stemming principal turnover in low-income or low-achieving schools by prioritizing school leadership stability in their own personnel decisions and through targeted retention strategies aimed at reducing voluntary turnover, such as retention bonuses or increased mentoring, coaching, and other supports for principals leading especially challenging schools. When vacancies in such schools arise, districts should concentrate efforts on recruiting high performers with proven track records of leadership effectiveness, potentially varying pay to compensate principals for taking on ambitious leadership assignments. As Clotfelter et al. (2006) argue, less traditional options, such as housing assistance programs, may also be effective in addressing principal sorting since principals often seek jobs near their homes, which may not be near the kinds of schools that need high-quality leadership most. In addition, proactive programs to build pipelines of effective leadership candidates can help districts compensate for what might otherwise be a scarce supply of high-quality leaders available to fill such leadership positions (Turnbull, Anderson, Riley, MacFarlane, & Aladjem, 2016).
Attention to creating pipelines of well-prepared leaders coupled with coaching and related strategies may also help address the pattern of lower returns to experience that our simulation results identify as a potentially important contributor to principal quality gaps. However, we caution that few studies have investigated principal development and how it may vary by school characteristics, and measurement in this area is a particular challenge. Additional research on principal improvement is necessary before we draw firm conclusions from this finding.
The analysis we have provided here is descriptive, aimed at providing an initial look at principal quality and some suggestion of the mechanisms that drive it. Future research should consider the strategies school districts employ to recruit, hire, and place principals and how these strategies affect sorting patterns. It should also delve deeper into the factors that drive principal turnover by school characteristics (Grissom & Bartanen, 2018) and how districts can be successful in reducing leadership turnover. Another useful extension would be to explore principal quality in a sample of schools in which racial/ethnicity diversity could be considered in a more specific or nuanced fashion; small samples of schools with large numbers of Asian, Pacific Islander, and Native American students, for example, prevent us from drawing strong conclusions about principal sorting with respect to such schools. Finally, research might also consider how accountability and evaluation systems may exacerbate or ameliorate patterns of principal sorting.
Supplemental Material
DS_10.1177_2332858419850094 – Supplemental material for Principal Sorting and the Distribution of Principal Quality
Supplemental material, DS_10.1177_2332858419850094 for Principal Sorting and the Distribution of Principal Quality by Jason A. Grissom, Brendan Bartanen and Hajime Mitani in AERA Open
Footnotes
Notes
Authors
JASON A. GRISSOM is associate professor of public policy and education at Vanderbilt University’s Peabody College and faculty director of the Tennessee Education Research Alliance. His research interests include K–12 education policy, educator labor markets, school district governance, and school leadership.
BRENDAN BARTANEN is assistant professor in the Department of Educational Administration and Human Resource Development at Texas A&M University. His research interests include school leadership, educator labor markets, and measurement of educator effectiveness.
HAJIME MITANI is assistant professor of educational leadership at Rowan University. His primary research interests are school leadership and school finance.
References
Supplementary Material
Please find the following supplemental material available below.
For Open Access articles published under a Creative Commons License, all supplemental material carries the same license as the article it is associated with.
For non-Open Access articles published, all supplemental material carries a non-exclusive license, and permission requests for re-use of supplemental material or any part of supplemental material shall be sent directly to the copyright owner as specified in the copyright notice associated with the article.