
Abstract
To increase participation in science, technology, engineering, and mathematics (STEM) studies and careers, some states have promoted inclusive STEM high schools. This study addressed the question of whether these high schools improve the odds that their graduates will pursue a STEM major in college. State higher education records were obtained for students surveyed as seniors in 23 inclusive STEM high schools and 19 comparison schools without a STEM focus. Propensity score weighting was used to ensure that students in the comparison school sample were very similar to those in the inclusive STEM school sample in terms of demographic characteristics and Grade 8 achievement. Students overall and from under-represented groups who had attended inclusive STEM high schools were significantly more likely to be in a STEM bachelor’s degree program two years after high school graduation. For students who entered two-year colleges, on the other hand, attending an inclusive STEM high school was not associated with entry into STEM majors.
Science, technology, engineering, and mathematics (STEM) expertise is widely viewed by policymakers as both the engine for economic prosperity and as necessary for addressing critical global challenges such as climate change and infectious diseases. For individuals, earning a bachelor’s degree in a STEM field is positively associated with a higher likelihood of employment and higher lifetime earnings (Carnevale, Cheah, & Hanson, 2015). At the same time, the likelihood of earning a STEM bachelor’s degree is negatively correlated with being Hispanic or Black, being female, or coming from a low-income or immigrant family (National Science Board, 2018). Policymakers have used the metaphor of a “perfect storm” to describe the threat posed by the combination of a world economy increasingly based on STEM expertise and U.S. demographic trends marked by declining proportions of the subgroups most likely to pursue STEM education and careers (i.e., Asian and White males). A National Academies of Sciences, Engineering, and Medicine committee concluded that only by enlarging the STEM pipeline and reinventing STEM education in a way that attracts, supports, and sustains the participation of students from all kinds of backgrounds can the United States meet its needs for science and technology innovation, economic prosperity, and social well-being (National Academies, 2005). Moreover, regardless of whether or not the predicted macroeconomic consequences hold, disparities in participation rates in STEM fields have significant implications for income inequality and social mobility in America.
In this context, a number of philanthropic organizations began exploring the concept of STEM-focused high schools that would recruit students from groups under-represented in STEM fields rather than the students with the highest scores on competitive examinations (Bill & Melinda Gates Foundation, 2005; Carnegie Corporation of New York, 2009). Such schools began opening in significant numbers in the first decade of this century (Means, Confrey, House, & Bhanot, 2008), and a number of states launched initiatives to create such schools at scale (Lynch, Peters-Burton, & Ford, 2015). Like many educational innovations, these inclusive STEM high schools (ISHSs) caught on because the idea was compelling, even though there was little empirical evidence at the time supporting the premise that schools accepting students on the basis of interest in STEM rather than demonstrated aptitude or prior achievement could in fact prepare those students for a STEM college major (National Research Council, 2011).
We define an ISHS as a secondary school or self-contained school-within-a-school that: (a) enrolls students on the basis of interest rather than aptitude or prior achievement; (b) provides students with more intensive STEM preparation than conventional high schools do; and (c) expresses the goal of giving all its students the preparation to succeed in a STEM major in college. Note that this definition excludes schools with intensive STEM programs in which some students participate but others do not. It also excludes schools focused on preparing students for technical fields and programs that do not require a bachelor’s degree. It does include schools focused on a particular STEM field (e.g., engineering) as well as those schools preparing students for college STEM majors in general. This definition encompasses, but is not restricted to, schools using curricula that integrate the four STEM disciplines and those that stress project-based learning approaches (Honey, Pearson, & Schweingruber, 2014). Thus, the curriculum and instructional practices may vary across different ISHSs, but they tend to share some common features: a rigorous STEM-focused college preparatory curriculum for all students; use of project- or problem-based pedagogy; an extensive network of supports for students who need assistance mastering the curriculum; incorporation of career, technology, and life skills; supportive school climate; and partnerships with external organizations to support out-of-school STEM experiences (LaForce, Noble, King, Holt, & Century, 2014; Lynch et al., 2018). Some organizations and states, including Texas, have codified these features in inclusive STEM school design and school designation guidelines (see, for example, www.thetrc.org/TSTEM2017/img/TSTEM/tstemblueprint.pdf).
Prior Research
A considerable body of work examines the precursors of STEM bachelor’s degree attainment and the developmental sequence of STEM participation gaps. Female, Hispanic, and Black students, as well as those from low-income families, are less likely than Asian and White males and students from higher-income families to enter college with plans to major in a STEM field (National Academies of Sciences, Engineering, and Medicine, 2016). Much of this gap can be attributed to differences in the kinds of mathematics and science courses these students take in high school and their lower participation in STEM-related activities, either because their high schools do not offer these learning opportunities or because students have not chosen or been encouraged to engage in them (Aschbacher, Li, & Roth, 2010). ISHSs are a strategy for eliminating gaps in STEM learning opportunities and expectations for under-represented groups during secondary school, and there is some evidence to suggest that they do so (Means et al., 2017). But even when Hispanic, Black, and low-income students enter college with the intention to major in STEM, they are more likely than other students to change to a non-STEM major or leave college altogether (Chang, Eagan, Lin, & Hurtado, 2011). Research on the likelihood that ISHS graduates will enter and persist in STEM college majors has been lacking.
Although test scores are not the best predictor of STEM major entry and persistence (Wang, 2013), much of the empirical research on the effectiveness of inclusive STEM schools has focused on their impacts on test scores. A study analyzing achievement test outcomes for students spending two years in one of six Ohio ISHSs, compared with conventional high schools drawing from the same middle schools, found that only two of the six ISHSs had a positive impact on students’ science achievement, with the other four having negligible or even negative impacts (Gnagey & Lavertu, 2016). A much larger study by Saw (2017) used data from five student cohorts, comparing test scores of students from 42 Texas ISHSs (“T-STEM academies”) with those of students from all other Texas high schools (1,580 unique schools) and found a positive impact of T-STEM attendance for Grade 11 mathematics achievement but not for achievement in other subject areas. Using data from 12 ISHSs in North Carolina and 27 T-STEM academies in Texas, Means et al. (2017) found small effects on test scores: there was a small advantage for North Carolina ISHS attendance in terms of science scores on the ACT college entrance test (with an effect size of +.17 standard deviation units) but not ACT mathematics scores; in the Texas sample, ISHS attendance was associated with slightly higher scores on both mathematics and science Grade 11 achievement tests (with an effect size of +.19 for both mathematics and science).
Test scores, of course, do not tell the whole story of school success. Numerous studies have found that the level of mathematics and science courses taken in high school is the best predictor of entry into college STEM majors (Adelman, 2006; Astin & Astin, 1993; Chen & Weko, 2009; Crisp, Nora, & Taggart, 2009; Mendez, Buskirk, Lohr, & Haag, 2008; Smyth & McArdle, 2004; Tyson, Lee, Borman, & Hanson, 2007; Wang, 2013). Working with large samples of ISHSs in two states, Means and colleagues (2017) found that both students in general and students from groups under-represented in STEM have higher likelihoods of taking advanced STEM courses in high school, particularly precalculus or calculus, if they attended an ISHS.
Theoretical frameworks developed to explain college persistence can be applied to the issue of remaining in the STEM pipeline. Social cognitive career theory, as articulated by Lent, Brown, and Hackett (1994; 2000), hypothesizes that persistence in STEM is a function of an individual’s goals (e.g., the desire to obtain a STEM degree and career), self-efficacy (e.g., belief that you can do the things needed to succeed in a STEM major), and positive outcome expectations (e.g., belief that if you complete a STEM major you will get a desirable STEM job). Eccles’s (2009) expectancy-value theory adds values and identity to this sociocultural model, emphasizing the student’s current identity and the identity she thinks she may hold in the future, as well as the student’s values, and the expected return on efforts.
In line with Eccles’s work, empirical studies confirm the importance of interest in and identification with one or more STEM subjects as predictors of continued STEM studies. Maltese and Tai (2011), for example, found that high-school students’ interest in mathematics and science is more predictive of entry into a STEM major than achievement test scores. Importantly, analyses predicting entry into STEM college majors for students in the NELS:88 longitudinal study by Huang, Tadesse, Walter, and Peng (2000) concluded that after controlling for differences in students’ attitudes toward mathematics and science and the courses they took in these subjects during high school, students of different ethnicities and socioeconomic backgrounds are equivalent in terms of likelihood of entering a college science or engineering program. However, recent analyses of High School Longitudinal Study of 2009 (HSLS) data by Saw, Chang, and Chan (2018) indicate that these students are less likely than higher-SES White male high-school students to be interested in STEM careers. Moreover, for all ethnicities, socioeconomic levels, and genders, students’ interest in STEM is quite volatile during the high-school years; only about a third of the HSLS students who expressed an interest in a STEM career as high-school freshmen maintained that interest through the end of Grade 11 (Saw, Chang, & Chan, 2018).
The Grade 12 Student Survey instrument designed for the present study was influenced by expectancy-value theory and includes scales measuring current sense of identity with respect to science and mathematics as well as interest in a future as a STEM professional. Self-efficacy measures in science and mathematics were included as well.
Case studies and survey data suggest that ISHSs implement practices that seek to foster STEM interest and identification with STEM occupations in their students (LaForce et al., 2014; Lynch et al., 2018; Means et al., 2016). Means et al. (2017) used data from 12th graders in large samples of ISHSs in North Carolina and Texas and found positive ISHS impacts on sense of identity as a science person and interest in entering a STEM career. Positive ISHS impacts on these attitudinal outcomes were found for students from under-represented groups as well as for students overall. Means and colleagues did not, however, find any impact of ISHS attendance on students’ sense of self-efficacy in either mathematics or science.
While the evidence base for ISHS effectiveness is mixed with respect to achievement test scores and positive with respect to a number of high-school outcomes known to correlate with entry into a STEM major, the research literature lacks any evidence with respect to the question of whether ISHSs have long-term impacts on whether their graduates actually major in a STEM field. College in general, and STEM programs of study in particular, pose many challenges for students, especially those from under-represented groups (Chang et al., 2011). Even if ISHSs do provide their students with the advanced coursework they need for STEM majors and the motivation to go on in STEM, they may not have equipped their graduates with the full range of academic behaviors or the resilience to overcome the challenges of STEM coursework. This study is the first to address this gap in the literature by using a large dataset to examine the impact of attending an inclusive STEM-focused high school on postsecondary outcomes.
The overarching research question for the present study is: Does attending an ISHS increase the likelihood that a student will attend college, take more STEM courses in college, and declare a STEM major? Three parallel, more focused research questions address the issue of whether the same ISHS impacts hold for Hispanic, female, and low-income student subgroups, which are traditionally under-represented in most STEM fields and were intended beneficiaries of the ISHS strategy. (We do not address a comparable research question for Black students because their numbers within our sample of Texas ISHSs were too small to model reliably. Black students are the focus of another of our ISHS studies, which uses samples from North Carolina.)
The current study was designed to address this question by comparing the likelihood of having declared a STEM college major two years after high-school graduation for students drawn from ISHS and comparison school graduates, after accounting for clustering within schools and controlling for student demographic characteristics and for achievement prior to high-school entry. Some STEM majors, such as engineering, must be declared in the freshman year at many colleges, but most can be declared as late as the spring term of the sophomore year. Our main outcome was operationalized as having a declared STEM major in a baccalaureate program two years after high-school graduation (i.e., at the end of the sophomore year for those who entered college in the fall after high-school graduation).
This study also examines STEM course-taking in both two- and four-year colleges, recognizing that the former can be the first stage of working toward a bachelor’s degree. Nationally, low-income students and students from underserved minorities who enter higher education are more likely to do so through the community college system (National Academies of Sciences, Engineering, and Medicine, 2016), but ISHSs typically encourage their students to apply to four-year colleges. Degree completion rates generally and STEM degree completion rates in particular are higher at four-year colleges than at two-year colleges (National Academies of Sciences, Engineering, and Medicine, 2016). In addition, the bachelor’s degree is the necessary first step toward earning a graduate degree, which increases career choices and lifetime earnings even further. For these reasons, we examine two-year and four-year college STEM majors separately.
General Approach
Using Texas K-12 school-level data, we first identified T-STEM academies (ISHSs) and non-STEM comparison high schools serving students who were similar in terms of academic achievement prior to high-school entry (i.e., Grade 8 achievement test scores). In spring 2014 a survey was administered to graduating seniors at 23 ISHSs and 19 comparison schools, of which 10 were comprehensive high schools and nine were small schools of choice without a STEM focus. Subsequently, the Education Research Center at the University of Texas matched the survey data files to state K-12 student data records and to higher education data for students attending any Texas college, two- or four-year, public or private, between fall 2014 and spring 2016. Propensity score weighting was used to ensure that students in the comparison school sample were very similar to those in the ISHS sample in terms of demographic characteristics and prior achievement. We then employed hierarchical modeling to estimate the strength of the relationship between attending an ISHS and having enhanced achievement and postsecondary outcomes as documented in state data systems.
Method
School Sample and Recruiting
Identification of ISHSs in Texas was straightforward because the requirements for designation as a T-STEM include the school design and implementation criteria stipulated in our definition of an ISHS, and the Texas Education Agency (TEA) maintains a list of T-STEM schools. In 2013 there were 77 designated T-STEM schools, 51 of which opened prior to 2010–2011, thus making them likely to have a senior class in 2013–2014 that could participate in a survey of 12th graders. We gathered information about the research approval process of the district or charter management organization governing each of these schools. Several large Texas districts were not approving any external non-mandated data collections at the time we were recruiting schools, reducing the number of potential study schools. Of the 42 Texas ISHSs invited to participate in our study, 30 agreed and 27 of these went on to administer the Grade 12 Student Survey in the spring of 2014. In addition, 24 of the 42 schools also participated in a survey of their freshman class, administered in the fall of 2013, and a second survey of this same class when they were seniors in the spring of 2017.
For each ISHS agreeing to participate in the study, we sought a non-STEM high school serving a similar student body. Using state school-level data, we looked for both comprehensive high schools serving students in a neighborhood attendance zone and small schools of choice that did not have a STEM focus. (Most of the latter were Early College High Schools, another popular high-school reform model in Texas.) District or charter management organization offices and schools were recruited for the comparison group using procedures identical to those employed with the T-STEM schools. Both ISHS and non-STEM schools were offered a $200 honorarium for a school staff member to coordinate survey administration and an incentive payment of $800 to $1,500, depending on the size of the school and the survey response rate achieved. School recruiters worked their way down the list of potential school matches until they found a comparison school willing to participate or until they exhausted the list of potential matches.
In identifying potential comparison schools, we sought schools serving students similar to those in the ISHS under consideration that were not geographically close to a STEM school (so students did not have the ready option of choosing a STEM-focused high school). Of the 55 comprehensive high schools recruited for the study, 14 agreed to participate and 10 returned Grade 12 Student Surveys. Of the 45 non-STEM small schools of choice that we approached about study participation, 13 agreed and nine returned the Grade 12 Student Surveys, giving us a total of 19 comparison schools, roughly balanced between comprehensive high schools and small schools of choice without a STEM focus. Online Supplemental Table S1 shows school characteristics for the 27 ISHSs and 19 comparison schools in the study as well as those of all Texas T-STEM academies and all non-T-STEM academies with a 12th grade in 2013–2014. The ISHSs in our study sample were very similar to the universe of T-STEM academies in terms of their percentages of minority and low-income students, attendance rates, and average Grade 8 achievement scores for their incoming ninth graders. The percentages of minority and low-income students were higher in T-STEM academies than in Texas high schools as a whole, but the mean Grade 8 mathematics and science scores for their incoming ninth graders were very similar. The study’s sample of comparison schools was selected to match the ISHSs in our sample as closely as possible, and the two samples are quite similar with respect to percentages of minority and low-income students. The average Grade 8 science scores for incoming students were modestly higher for the study ISHSs, while the study comparison schools had a slight edge in terms of average Grade 8 mathematics scores for incoming freshmen.
Instruments and Data Sources
Grade 12 Student Survey
The student survey was designed to collect data on variables shown to predict entry into STEM college majors in prior empirical research. Survey items and scales addressed students’ high-school experiences in their STEM courses; extracurricular and leisure-time activities related to STEM; overall academic and STEM orientation; academic and personal supports received through their high school; plans for the year following graduation; and interest in STEM careers. Further detail on the survey scales and analyses of survey responses from students at ISHSs and comparison schools can be found in Means et al. (2017).
Grade 9 Student Survey
The survey administered to entering ninth graders elicited reports of their level of interest in STEM subjects, interest in pursuing a STEM career, and their STEM-related activities and interest levels during middle school.
Texas K-12 Administrative Data
The Texas Education Research Center (ERC) at the University of Texas at Austin linked our survey data to the state’s K-12 education data collected by the TEA. We used student enrollment and demographic data from the Public Education Information Management System (PEIMS) and student eighth-grade achievement scores on the Texas Assessment of Knowledge and Skills (TAKS). TEA Grade 8 achievement score records were found for 974 of the 1,132 ISHS students who took the Grade 12 Student Survey (86%) and for 2,128 of the 2,400 comparison school students who took the survey (89%). From the state K-12 administrative data records, we obtained student demographic information and eighth-grade achievement scores in reading, mathematics, and science for use as covariates in our analytic models. Because of the importance of Grade 8 achievement scores in controlling for achievement level prior to high school, we deleted from our sample any students who had not taken the regular form of at least one of the Grade 8 state tests (i.e., students who were not tested or were given modified tests that were simplified or developed using alternate academic achievement standards). This reduced our sample to 2,864 students: 867 from ISHSs and 1,997 from comparison schools. We refer to these students as the Grade 12 Survey Sample.
Texas Higher Education Data
Both public and private higher education institutions in Texas submit individual student reports electronically to the Texas Higher Education Coordinating Board (THECB) every semester documenting college attendees’ enrollment and graduation status. Two sets of THECB student-level datasets were used in this study. One set is college enrollment status and major reported at the beginning of each semester. The other is courses taken and grades for each student as of the final day of each semester. We merged survey data, TEA data, and college enrollment and course-taking pattern files together. THECB enrollment records were found for 621 of the 867 students in the ISHS Grade 12 Student Survey sample (72%) and for 1,313 of the 1,997 comparison school survey takers (66%). We refer to these students as the College-going Sample. Similarly, THECB course-taking records in one or more of the fall 2014 to spring 2016 terms were found for 593 of the 867 students in the ISHS Grade 12 Survey Sample (68%) and for 1,268 of the 1,997 comparison school survey takers (63%). We assume that survey sample members without either type of THECB record did not attend a Texas higher education institution during this time period. College courses taken earlier than fall 2014, while students in our sample were still in high school, were not included in the analysis. (Doing so would likely have advantaged the ISHSs, because the T-STEM Academies Blueprint called for mechanisms enabling students to earn 12 or more college credits during high school.)
Coding for Applied and Core STEM Courses and Majors
Any empirical investigation of STEM postsecondary outcomes must develop an operational definition of STEM, given the fact that the research literature continues to debate its meaning as a construct (Honey et al., 2014). Because this study deals with STEM outcomes rather than STEM as a philosophy of curriculum and instruction, we started with the simple approach of treating STEM as a course of study in science, technology, engineering, or mathematics.
We examined a variety of occupational and field of study classification systems: The Bureau of Labor’s Standard Occupation Classification System (www.bls.gov/soc/soc_structure_2010.pdf); the National Center for Education Statistics’ Classification of Instructional Programs (CIP) codes (https://nces.ed.gov/pubs2002/cip2000/) and its glossary definition of STEM (https://nces.ed.gov/programs/raceindicators/glossary.asp); the Georgetown Center on Education and the Workforce college major and occupational classifications (Carnevale et al., 2015); the National Science Board science and engineering indicators (National Science Board, 2016); the classification of STEM majors and occupations used in ACT’s Conditions of STEM report series (ACT, 2014); the STEM-designated degree program list used by the Department of Homeland Security (www.ice.gov/sites/default/files/documents/Document/2016/stem-list.pdf); and prior STEM education research studies (e.g., Aschbacher et al., 2010; Tyson et al., 2007).
Different organizations and researchers have applied different criteria in deciding what counts as STEM. The science and engineering indicators reports of the National Science Board, for example, treat psychology and other social sciences as STEM and exclude medical studies, while many other sources do not. We considered using the definition of a STEM major in the science and education indicators, which reflect the fields of study that the National Science Foundation supports. But because our interest centers on issues of social mobility, equity, and economic value, we chose instead to adopt the taxonomy used by the Georgetown Center on Education and the Workforce, which defines STEM as four groups of majors with subgroups within each: biology and life sciences; computers, statistics, and mathematics; engineering; and physical sciences (Carnevale et al., 2015). We refer to these as “Core STEM” majors. In addition, we identified a set of STEM-related occupationally focused majors that are common in two-year colleges (and increasingly available in baccalaureate-awarding colleges as well) and that qualify degree- or certificate-earners for employment in the relevant occupation, such as medical or dental technician and cybersecurity. We refer to this latter set of majors as “Applied STEM.” In classifying individual courses as Core STEM, we relied on the CIP codes, which are incorporated into the Texas higher education data system, and then mapped these codes to the Georgetown major groupings.
Students who took our Grade 12 Student Survey subsequently attended 112 different Texas institutions of higher education. Their course records contained 7,830 different courses, subsumed under 704 different prefixes, and 271 different major fields of study. While the majors were reported consistently across campuses using CIP codes, course names were campus specific. Since it would be resource-prohibitive to obtain and examine the syllabi of 7,830 individual courses, we coded only course prefixes, which were fewer in number and quite consistent across campuses. For example, it was assumed that all courses listed under Chemistry (“CHEM,” “CH,” or “CHE,” depending on the campus) were courses in chemistry, which would be Core STEM. One of the researchers identified what each of the course prefixes stood for using publicly available resources, and subsequently applied the Core STEM, Applied STEM, and Non-STEM classification scheme to each course.
Two researchers coded each major listed in the data set as Core STEM, Applied STEM, or Non-STEM. For those majors with ambiguous names that made them difficult to categorize, we used publicly available resources to identify the specific courses required for the major to see whether they were predominantly in Core STEM subjects or were more practical and occupational in nature. Cases in which the two researchers applied different codes to a major were discussed with the lead author, who cast a tie-breaking vote.
Analysis Approach
Descriptive Analysis
As a first analytic step, we calculated means for the characteristics of students from our ISHS and comparison school survey samples to ascertain the extent to which students in the ISHS and comparison school survey samples were similar to each other at the start of high school.
Propensity Score Weighting
Two sets of propensity score weights were applied to create comparison school samples as similar as possible to the ISHS student sample in terms of eight demographic variables (including gender, ethnicity, English proficiency, parents’ education, and parent employment in STEM) and five achievement variables (mainly Grade 8 achievement test scores). The first set of propensity score weights was applied to the 1,997 comparison school students in the Grade 12 Student Survey Sample. Using the same procedures, a second set of propensity score weights was developed for the 1,313 comparison school students with records in the Texas higher education data system (i.e., the College-going Sample). The objective of this two-step process was to make sure that among those students with higher education records the demographics and Grade 8 achievement levels of the comparison group were well-matched with those of the ISHS students, despite possible variations attributable to different college-going rates. When the analysis moved to student subgroups (Hispanic, female, economically disadvantaged), we followed the same procedure to compute propensity score weights to create equivalent ISHS and comparison school samples. The full set of variables used for weighting is listed in Table 1.
Descriptive Key Information on ISHS vs. Comparison Class of 2014 Students Who Participated in 12th-Grade Survey, Before and After Propensity Score Weighting

Comparison schools differ from ISHSs at p < .05; ** p < .01; ***p < .001.
Propensity score weighting was conducted to weight comparison students to match ISHS students.
Weighted column descriptive statistics use weights generated from ISHS vs. comprehensive propensity score weighting model.
ISHS: inclusive STEM high schools.
Hierarchical Modeling
Because students are clustered within high schools, we performed analyses using hierarchical modeling to compare outcomes for students who were 12th-graders in ISHSs with those who were in comparison schools, adjusting for student demographic characteristics and eighth-grade achievement scores using propensity score weights.
For each set of comparisons, we posited a hierarchical model with student and school levels for the same set of outcomes. The ISHS impact was estimated at the school level. The hierarchical model for student-level outcomes took the form:
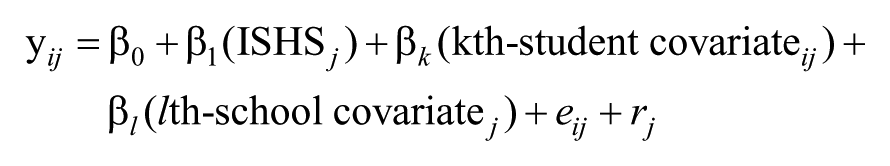
where i is students, j is schools, Yij is a student outcome, and ISHS equals 1 for students in an ISHS school and 0 for students in a comparison school. e
ij
and r
j
are student and school random effects.
For our main research question concerning likelihood of pursuing a STEM major, we used the survey sample and coded a “0” for students not found in the higher education data (indicating that they had not declared a STEM major in a Texas college). For analyses of postsecondary credit accumulation, grade point average, and course-taking patterns, we used the smaller sample of students in the higher education database for our analyses, dropping students who did not attend a Texas higher education institution from the denominator.
Results
Student Variable Balance
Grade 12 Survey Samples
The demographic and Grade 8 achievement data for the survey samples from ISHS and comparison high schools prior to weighting are shown in columns 2 and 3 of Table 1. As can be seen from the data, students from the ISHS and comparison high schools were similar in terms of ethnic backgrounds and English proficiency, but there were some differences between the two groups. A larger proportion of the comparison school students were female (54% compared with 48%) and comparison school students were more likely to report having a parent in a STEM profession. ISHS students, on the other hand, were more likely to report that one or more of their parents had earned a bachelor’s degree. In terms of Grade 8 test scores, students in our sample of comparison schools had higher scores in science (ironically) while ISHS students had higher scores in math, reading, and social studies. Although significant statistically at p < .05, these differences were all less than .25 standard deviation units in magnitude and thus amenable to statistical control in our models.
After propensity score weighting as described above, there were no statistically significant or substantial differences between the ISHS Student Survey Sample and the weighted comparison school Grade 12 Student Survey Sample (compare columns 2 and 4 in Table 1). The propensity score weighted sample was used in the hierarchical modeling of ISHS impacts.
Similar patterns of differences in the unweighted descriptive data for students who had attended the two types of high school were found for the Hispanic, female, and economically disadvantaged student subsamples. Again, we applied propensity score weighting to create a comparison high school graduate sample that did not differ from the ISHS graduate sample on any of the measured characteristics. The original descriptive data and weighted data for these subgroups within the Grade 12 Student Survey Sample are available in Tables S2–S4 in the online supplemental material.
College-going Samples
We went through the same process of propensity score modeling and weighting for the subset of the survey-taking sample that had records in the Texas higher education data system. A limitation of this study is that the Texas higher education records do not include students from our sample schools who went to college outside of Texas. However, available data suggests that this was a very small group. According to the Integrated Postsecondary Education Data System (IPEDS) Enrollment Survey by the National Center for Educational Statistics, 58.7% of Texas students graduating high school in spring 2014 (the year our survey was administered to seniors) entered college somewhere in the U.S. the next fall. The Texas Education Agency reports that 57% of all Texas high-school graduates in the Class of 2014 attended a Texas college that fall (Texas Higher Education Board, n.d.). Although possible sample differences or differences in how college attendance was measured by the two agencies may introduce some error when these estimates are combined, the difference of less than 2% between these two estimates suggests that only a small percentage of Texas 2014 high-school graduates went to out-of-state colleges the next fall.
Table 2 shows the original and weighted samples for those students in our survey sample who had Texas higher education records. Since the samples in Table 2 include the majority of students in the samples in Table 1, it is not surprising that differences between graduates of the two kinds of high schools are similar to those in Table 1 prior to weighting. Again, after propensity weights are applied to the comparison school sample, the two samples are very similar, and there are no significant differences in any of the measured characteristics. The descriptive data and weights for the college-going Hispanic, female, and low-income subgroups are available in Tables S5–S7 in the online supplemental material.
Descriptive Key Information on ISHS vs. Comparison Class of 2014 Students Who Participated in 12th-Grade Survey Who Attended Any Postsecondary Institution in Texas, Before and After Propensity Score Weighting

Comparison schools differ from ISHSs at p < .05; ** p < .01. Propensity score weighting was conducted to weight comparison students to match ISHS students.
Weighted column descriptive statistics use weights generated from ISHS vs. comprehensive propensity score weighting model.
ISHS: inclusive STEM high schools.
Impact Analyses
College Entrance
Table 3 shows the proportion of students in the ISHS and comparison high-school survey samples found in Texas higher education records as college attendees in fall 2014. It also shows the percentage found in Texas higher education records at any point between fall 2014 and spring 2016.
ISHS Impact on College Enrollment for Class of 2014 Students Who Participated in the 12th-Grade Survey, Propensity Score Weighted HLM Model-Estimated Values

ISHS students differ from comparison school students at p < .05.
Source: Texas longitudinal student data; predicted values from hierarchical linear models (HLM) for each of the dependent variables shown in the left-hand column, adjusting for differences in school and student characteristics between ISHS and comparison schools. Separate analyses were conducted for two-year college and four-year college entrants. Covariates data obtained from Texas Education Research Center data.
ISHS: inclusive STEM high schools.
Although the raw sample means in Table 3 appear to suggest that ISHS graduates are more likely than their counterparts from comparison schools to enter a four-year college in the fall after high-school graduation, after adjusting for the many demographic, prior achievement, and school characteristics in the analytic model, there is no significant difference. Nor does the type of high school attended make a difference in the four-year-college-going rate for Hispanic and female students. There is a statistically significant ISHS impact, however, for economically disadvantaged students. The odds of their entering a Texas four-year college the fall after high school or any time from 2014 to spring 2016 are increased by 75% and 80%, respectively, for economically disadvantaged students who went to an ISHS (p < .05).
STEM College Major
The central research questions for this study are addressed by the data in Table 4. The model-adjusted impact estimates indicate that having attended an ISHS does indeed increase the likelihood that two years after high school an individual will have declared a major in a Core STEM field at a four-year college. ISHS graduates were nearly three times more likely (odds ratio = 2.80) than their peers who graduated from comparison high schools to declare a STEM major in a four-year college. Importantly, given the inclusion mission of ISHSs, the likelihood of having declared a STEM major at a four-year college is significantly higher also for Hispanic, female, and economically disadvantaged students if they attended an ISHS. For Hispanic, female, and low-income students who attended four-year colleges, those who had gone to ISHSs all had odds of declaring a STEM major that were more than triple those for their peers who had gone to a comparison high school (with odds ratios of 3.53, 3.29, and 4.31 for Hispanic, female, and economically disadvantaged students, respectively).
ISHS Impact on Latest Declared Major in a STEM Field for Students Who Participated in the 12th-Grade Survey, Propensity Score Weighted HLM Model-Estimated Values

ISHS students differ from comparison school students at p < .05; ** p < .01; *** p < .001.
Source: Texas longitudinal student data; predicted values from HLM models for each of the dependent variables shown in the left-hand column, adjusting for differences in school and student characteristics between ISHS and comparison schools. Separate analyses were conducted for two-year college and four-year college entrants. Covariates data obtained from Texas Education Research Center data. Seventeen ISHS and 24 comparison students who attended Texas private colleges that do not report college major to ERC were removed from the analytic sample.
ISHS: inclusive STEM high schools.
In contrast, among the students we surveyed in grade 12, the type of high school they had attended had no relationship to likelihood of declaring a STEM major in a two-year college. Nevertheless, the ISHS impact on likelihood of declaring a STEM major in a four-year college was large enough that the impact on likelihood of being in a STEM Core major in any college was also significantly positive, as shown in Table 4.
STEM Credits and GPA
As noted above, the higher education course-taking records contained 593 of the 974 students surveyed in ISHSs and 1,268 of the 1,997 comparison school survey takers. We used propensity score weighting to make sure the ISHS students and the comparison school students in the higher education course-taking records were very closely matched in terms of demographic background and Grade 8 achievement measures. Propensity score-weighted hierarchical modeling was conducted to examine the accumulation of STEM course credits and grades for graduates of the two types of high schools. Table 5 shows the impact of ISHS attendance on STEM coursework and grades for those who started at two-year colleges and for those who started at four-year colleges. These data, like the STEM college major data, suggest that the positive effect of ISHS attendance is confined to those students who attend four-year colleges. Among students who go to four-year colleges, there is a positive advantage related to ISHS attendance in terms of the number of Core STEM courses completed between fall 2014 and spring 2016. There was no significant ISHS effect on total number of courses completed in four-year colleges or on grades in Core STEM courses. With respect to the latter null finding, it should be kept in mind that this GPA was computed over a larger number of courses, and presumably more advanced STEM courses, for the ISHS graduates than for the comparison high-school graduates.
ISHS Impact on Postsecondary STEM Course-taking Patterns for Class of 2014 Students Who Participated in the 12th-Grade Survey and Took College Classes in Texas from Fall 2014 to Spring 2016, by College Type
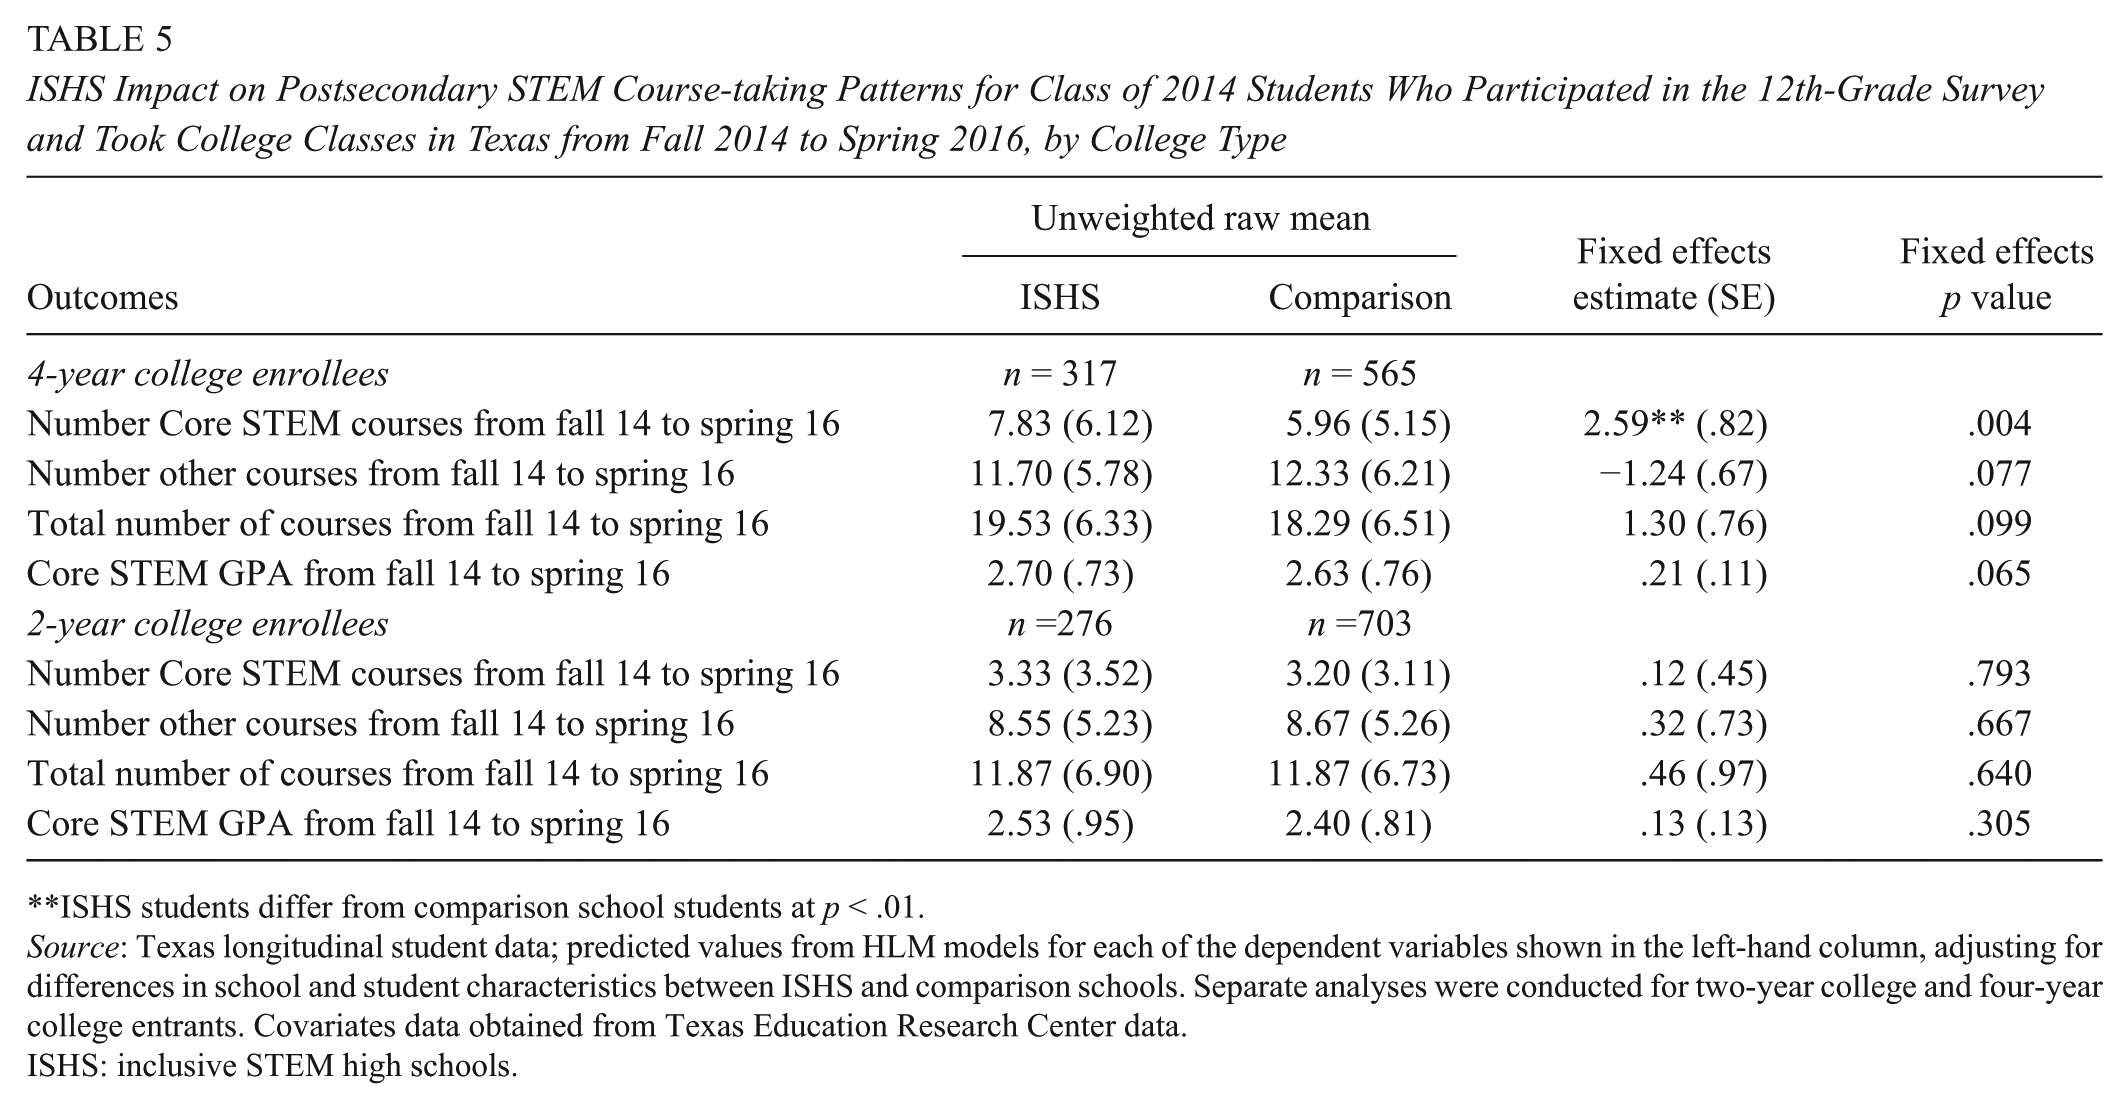
ISHS students differ from comparison school students at p < .01.
Source: Texas longitudinal student data; predicted values from HLM models for each of the dependent variables shown in the left-hand column, adjusting for differences in school and student characteristics between ISHS and comparison schools. Separate analyses were conducted for two-year college and four-year college entrants. Covariates data obtained from Texas Education Research Center data.
ISHS: inclusive STEM high schools.
For those ISHS and comparison school graduates who went to two-year colleges, there was no significant difference in terms of number of Core STEM courses taken, total number of courses completed, or GPA in STEM courses.
Separate analyses for Hispanic, female, and low-income students, shown in Table 6, generally reveal the same pattern of positive ISHS impacts only for number of Core STEM courses taken for those attending four-year colleges, with the exception of a positive advantage in terms of STEM GPA for female students who graduated from ISHSs and then attended a two-year college.
ISHS Impact on Postsecondary STEM Course-taking Patterns for Class of 2014 Students Who Participated in the 12th-Grade Survey and Took Any College Classes in Texas from Fall 2014 to Spring 2016, by Subgroup and College Type

ISHS students differ from comparison school students at p < .05; ** p < .01.
Source: Texas longitudinal student data; predicted values from HLM models for each of the dependent variables shown in the left-hand column, adjusting for differences in school and student characteristics between ISHS and comparison schools. Separate analyses were conducted for two-year college and four-year college entrants. Covariates data obtained from Texas Education Research Center data.
ISHS: inclusive STEM high schools.
Limitations and Sensitivity Analyses
Although our statistical model controlled for a host of school-level and student-level variables potentially affecting high school and postsecondary outcomes, our design could not rule out selection bias. We did not have a measure of the level of interest in STEM subjects for ISHS and comparison school students before they started high school. Logically, one would expect students choosing to go to an ISHS to have more interest in STEM than other students with similar demographic characteristics and academic profiles. Could pre-existing differences in STEM interest and experiences account for what appears to be a positive impact of ISHS attendance on the odds of entering into a STEM college major?
The next logical question specifically concerns the likelihood that self-selection into ISHSs would introduce this much bias or more into our impact estimates. Although we don’t have prior STEM interest measures for the Class of 2014 students for whom we have postsecondary outcome data, we do have such measures for students in the Class of 2017 in the same high schools. These students were surveyed as entering high-school freshmen and then again as graduating seniors. Online Supplemental Table S8 shows the characteristics of ISHS and comparison school students in this younger student cohort before and after propensity score weighting. Two survey factors were used to measure STEM interest prior to high school: STEM as a favorite subject in middle school and the number of middle school STEM activities (sum of eight items on attending math and science clubs, competitions, camps, and study groups or a program where a student was tutored in math and science). When surveyed at the start of high school, 39% of ISHS students and 35% of the comparison student sample (weighted) cited a STEM subject as their favorite in middle school. The average number of middle school STEM activities they reported was 1.05 and .83 for ISHS and comparison students, respectively. These data suggest that students who chose to attend ISHSs were somewhat more active in STEM in middle school, but the difference was not large. We next examined the coefficients of these prior STEM interest and activity variables in a model estimating the impact of ISHS attendance on STEM career interest at the end of high school. We found that for this younger cohort, students who indicated on the Grade 9 Student Survey that STEM was their favorite middle school subject and that they had participated in more STEM activities during middle school were significantly more likely to be interested in a STEM career at the end of high school, even after controlling for ISHS attendance (fixed effects estimates of .05 and .41, and odds ratios of 1.05 and 1.50, respectively). These findings support the hypothesis that middle school STEM interest plays a role in explaining longer-term STEM-related outcomes. Although this second cohort of students has not moved along its education trajectory far enough to provide the postsecondary measures that we were able to analyze for the Class of 2014, we do have their Grade 12 outcomes. Using the same predictive model incorporating Grade 8 achievement scores, demographic variables, and school-level variables applied to look at postsecondary outcomes in Table 4, we examined these younger students’ Grade 12 outcomes. The results are shown in the Model A column of Table 7. Class of 2017 students who attended ISHSs experienced significantly better outcomes in terms of number of advanced math courses taken, likelihood of taking a technology course, likelihood of taking an engineering course, number of high-school STEM extracurricular activities participated in, number of informal STEM activities participated in, and STEM career interest at the end of high school.
ISHS Impact on Grade 12 Outcomes for Students in Class of 2017 Who Participated in the 12th-Grade Survey, With and Without Controlling for Prior STEM Interest and Activity

Model A: This analysis controls for school characteristics (PI status, percent minority, percent low income, average eighth grade science, average eighth grade math, urbanicity) and student demographic characteristics. It uses the sample of students with non-missing values on baseline STEM interest and middle school STEM activity level.
Model B: This analysis controls for school characteristics (PI status, percent minority, percent low income, eighth grade science, eighth grade math, urbanicity) and student demographic characteristics, baseline STEM interest, and middle school STEM activity level. It uses the same sample as Model A.
p < .05; ** p < .01.
ISHS: inclusive STEM high schools; PI: program improvement status.
We then added the middle school STEM activity and science interest scales into the model, with the results shown in the Model B column of Table 7. The same six Grade 12 outcomes, and no others, are statistically significant using the model that controls for STEM activity and interest prior to high school. Three of the impact estimates are slightly smaller in magnitude, two are slightly larger, and one remains the same. For interest in a STEM career at the end of high school, for example, comparing Model B with Model A reveals that the log odds for the impact of ISHS attendance changed only slightly from .31 (with an odds ratio of 1.38) to .28 (odds ratio of 1.34), both statistically significant at the p < .01 level. To sum up, after controlling for all of the student-level characteristics in Model A, adding controls for prior STEM interest and activity does not change inferences about ISHS impacts on Grade 12 outcomes.
If adding prior STEM interest and activity variables to the model used to generate the findings in Table 4 relating ISHS attendance to the likelihood of declaring a STEM major in a four-year college were possible and had the same degree of influence as that observed in the analyses predicting Grade 12 outcomes for the Class of 2017, the odds ratio for being in a STEM baccalaureate major in Table 4 would drop from 2.80 to 2.72, and the statistical significance would stay the same. This suggests that controlling for middle school STEM interest and activity would not substantively change inferences about ISHS impacts on more downstream, postsecondary outcomes.
Next, we applied the method described by Frank et al. (2013) to quantify the amount of bias associated with non-random assignment to treatment that would be necessary to invalidate the inference that ISHS attendance increases the odds of entry into a STEM major. In this framework, the robustness of an inference is a function of the percentage of the impact estimate that exceeds a threshold that would render the estimate statistically not significant. The estimated log odds for the impact of ISHS on entry into a STEM major in a four-year college is 1.03, with a standard error of .27. The threshold for statistical significance of this estimate at the .05 level is therefore .53 (.27*1.96). Using Frank et al.’s formula (estimate−threshold)/estimate, we calculated the percent bias that would invalidate the inference to be 49% ((1.03–.53)/1.03). This indicates that to invalidate the inference that ISHS attendance has an impact on declaring a STEM major in a four-year college on the full sample of students, 49% of the estimated effect would have to be due to bias. 1 In other words, 49% of the ISHS student sample would have to be replaced with students for whom ISHS had an effect of zero to invalidate the inference that ISHS attendance has a positive impact on likelihood of declaring a STEM major in a four-year college. This analysis provides evidence of the relative robustness of the estimated impact. In combination with the findings regarding the modest influence of prior STEM interest on high-school outcomes for the younger student cohort when the other student characteristics in the model are controlled for, the bias analysis suggests that the association between ISHS attendance and entry into STEM bachelor’s degree programs is not just an artifact of selection bias.
Discussion
The analyses reported here reflect positively on a major state education policy initiative addressing under-representation in STEM programs and careers. A large portion of the T-STEM academies with graduating classes in 2014 were included in the analyses. This study used a rigorous propensity score weighting approach to equate student samples from these STEM high schools with graduates of comparison high schools in order to estimate the strength of the relationship between attending an ISHS and enhanced postsecondary STEM academic outcomes. ISHS graduates were nearly three times as likely as their peers who had attended a non-STEM high school to be in a STEM bachelor’s degree program in a Texas four-year college or university two years after high-school graduation. What’s more, the relationship between attending an ISHS and being in a four-year college STEM major appears even stronger for Hispanic students, females, and economically disadvantaged students.
To put these findings in perspective, nationally 71% of students graduating from high school attend a four-year college the next fall (Fry & Taylor, 2013), but the figure is considerably lower for low-income, Black, and Hispanic graduates. Taking Hispanic students as an example, only 56% of Hispanic high-school graduates enter directly into a four-year college the next fall (Fry & Taylor, 2013). Among students who do go directly to a four-year college after high school, roughly equal proportions of Hispanic and White students (around 35%) indicate an intention to major in STEM on surveys taken as entering freshmen (Eagan, Hurtado, Figueroa, & Hughes, 2014). However, less than 25% of students who enter four-year colleges expecting to major in STEM actually complete a STEM degree within four years, and the completion percentage for Hispanic students with STEM intentions is lower at 12.3% (Eagan et al., 2014). Applying these estimates from prior research to Hispanic high-school graduates, the expected STEM pipeline yield of STEM bachelor’s degrees would be less than 2.5% (.56*.35*.12). Not all the students in our data set with a declared STEM major in a four-year college two years after high-school graduation will complete their course of study, of course, but most of the shifting out of STEM majors occurs in the first two years of college after taking an initial course in mathematics, engineering, or science (PCAST, 2010). The proportions of ISHS graduates, overall and for Hispanics and other subgroups, with declared STEM majors two years into their postsecondary experiences (shown in Table 4) suggest that Texas ISHS graduates will “beat the odds” for STEM degree completion.
These findings have important implications for education policy. They reinforce prior research (Huang et al., 2000; Maltese & Tai, 2011; Russell & Atwater, 2005) suggesting that high-school experiences are important in fostering continued STEM study among under-represented groups and demonstrate that a coordinated state strategy of fostering ISHSs (Young et al., 2017) can in fact make headway toward the national goal articulated by the President’s Council of Advisors on Science and Technology (PCAST, 2010): We must prepare all students, including girls and minorities who are under-represented in these fields, to be proficient in STEM subjects. And we must inspire all students to learn STEM and, in the process, motivate many of them to pursue STEM careers. (p. 6)
The major limitation of this study results from the inability to assign students to different kinds of high schools. Although a large number of student characteristics were controlled for using propensity score weights, and the analytic model included both high school and individual characteristics known to relate to education outcomes, there may have been unmeasured self-selection bias that was not adjusted in our model. Students and families opting for ISHSs have chosen this nontraditional environment. While half of the comparison schools in our study were also small schools that students and parents had opted into, a majority of the comparison school students in our sample attended the neighborhood high school for their attendance zone. Although we were not able to control for students’ STEM interest and activities prior to high-school entry in our analyses of postsecondary outcomes, we did examine the influence of these factors on educational and interest outcomes using a second cohort of students who were surveyed as ninth graders as well as in Grade 12. These latter analyses suggest that the inclusion of middle school STEM interest and activity variables in the analytic model has little influence on impact estimates based on the same set of covariates we used in our analysis of postsecondary outcomes.
A smaller limitation is the fact that postsecondary data were available only for students who went to a Texas college between 2014 and 2016. Students who went to college out of state are not included in our analyses. However, as noted above, statistics provided by IPEDS and the Texas Education Agency suggest that only something in the neighborhood of 2% of 2014 high-school graduates attended an out-of-state college the next fall. Moreover, the low-income and Hispanic students, who are of a particular concern in policies to broaden STEM inclusion, are less likely than more affluent students to leave their home state for college.
Finally, our study is limited by the fact it was simply too soon to capture the full course of these students’ higher education experiences, including transfers between community college programs and four-year colleges. Many students take more than four years to earn a bachelor’s degree and more than two years to earn an associate’s degree. And increasingly, college-goers attend more than one institution. For many low-income students especially, a community college is their first higher education experience, and there are gaps in college attendance. We also know that some students begin their studies at four-year institutions and then transfer to two-year institutions (Chen & Soldner, 2013). Future analyses should look at individual student trajectories across institution types and different programs of STEM study, including Applied as well as Core STEM.
The analyses presented here suggest several future directions for research on the transition between high school and postsecondary STEM education. One question concerns the characteristics of ISHSs, which prepare students for the rigor of STEM courses at the postsecondary level. Interview data collected by House, Iwatani, and Peters (2017) from small samples of ISHS and comparison school graduates who had declared an interest in STEM careers and the intention to enter a four-year college at the end of high school suggest several factors. ISHS graduates appeared to have entered college with a more realistic appraisal of the rigors of STEM courses and with a greater inclination to seek assistance proactively when encountering academic difficulties. The interviewed ISHS students were also more likely to be in the same college they had enrolled in initially and to be in a STEM program two years after high-school graduation.
If the “active ingredients” of the ISHS model that contribute to positive postsecondary outcomes can be identified, the next step would be to explore ways of embedding those ingredients into the school culture and STEM curriculum and instruction of larger neighborhood high schools. It is important also to relate the attitudinal and academic outcomes associated with ISHS attendance to more fine-grained analyses of individual students’ educational trajectories. We do not know why positive effects of attending an ISHS are found for students who attend four-year colleges and universities but not for those who attend two-year colleges. ISHSs generally promote attendance at four-year higher education institutions, but the same academic and attitudinal factors should be useful at both kinds of college. Students going from ISHSs to community colleges may be dealing with more responsibilities and stresses than their peers who go straight into four-year colleges in the fall after high-school graduation. Since so many students from low-income families and from under-represented groups do start at two-year colleges, it is important to understand the extent to which their goals are for Applied STEM certificates or associates degrees versus a stepping stone to a Core STEM bachelor’s degree, and the nature of their two-year college experiences and evolving education and career aspirations.
Supplemental Material
ERO806305_Appendices – Supplemental material for Broadening Participation in STEM College Majors: Effects of Attending a STEM-Focused High School
Supplemental material, ERO806305_Appendices for Broadening Participation in STEM College Majors: Effects of Attending a STEM-Focused High School by Barbara Means, Haiwen Wang, Xin Wei, Emi Iwatani and Vanessa Peters in AERA Open
Footnotes
Authors’ Note
This work was supported by National Science Foundation grants to Digital Promise Global (DRL-1817513) and to SRI International (DRL-1316920). Any opinions, findings, conclusions, or recommendations are those of the authors and do not necessarily reflect the position, policy, or endorsement of their organizations or the funding agency.
Notes
Authors
BARBARA MEANS directs learning sciences research at Digital Promise. Her work explores the implementation and effectiveness of innovations designed to broaden educational opportunities.
HAIWEN WANG is a senior research analyst at SRI Education. Her work employs statistical modeling to disentangle the influences of treatment and selection effects.
XIN WEI is a senior research analyst at SRI Education. She applies quantitative analysis to both experimental studies and analyses of large-scale administrative data sets.
EMI IWATANI is a research scientist at Digital Promise. Her research interest is in culturally responsive evaluation approaches to studying educational innovations.
VANESSA PETERS is a senior learning sciences researcher at Digital Promise. She focuses on how to implement digital learning approaches effectively.
References
Supplementary Material
Please find the following supplemental material available below.
For Open Access articles published under a Creative Commons License, all supplemental material carries the same license as the article it is associated with.
For non-Open Access articles published, all supplemental material carries a non-exclusive license, and permission requests for re-use of supplemental material or any part of supplemental material shall be sent directly to the copyright owner as specified in the copyright notice associated with the article.