
Abstract
Despite growing interest in the importance of nonacademic skills for student success, very few studies have examined the extent to which schools and teachers are associated with gains in these outcomes. This descriptive study adds to the nascent literature by examining the amount of school- and teacher-associated variation in kindergarten students’ executive function (EF) skill gains. Leveraging direct EF assessment data from a nationally representative sample of 10,800 public school kindergarteners, the analysis reveals no variation in EF gains among teachers within schools but substantial variation across schools. Additionally, it shows that school-associated variation in EF and academic achievement are weakly correlated, suggesting that some schools are associated with increases in student achievement but not with EF skills and vice versa.
Keywords
VAMs have not yet been applied to executive function (EF), which is a set of cognitive processes—including inhibitory control, working memory, and cognitive flexibility—that helps individuals focus, resist urges, and direct their actions to achieve goals (Diamond & Lee, 2011). Recent evidence highlighting the unique positive contribution of EF skills on academic achievement, particularly for high-poverty populations, has led many schools to adopt interventions to boost children’s EF skills (Best, Miller, & Naglieri, 2011; Blair & Diamond, 2008; Ursache, Blair, & Raver, 2012). A range of interventions have been shown to improve children’s EF skills, including class curricula, teacher trainings on behavior management, computer training programs, and even mindfulness and tae kwon do exercises (Diamond & Lee, 2011).
While the promotion of EF skills in education has become a popular topic in recent years, no research has examined the extent to which schools and teachers may differ in their promotion of these skills. In this descriptive study, I begin to address this gap by examining the variability in kindergarten students’ EF gains associated with schools and teachers.
Background
EF Construct and Its Development
EF skills help individuals focus on and persist in the attainment of goals, which are both critical components to academic success (Ursache et al., 2012). These skills are frequently described as the “air traffic control system of the brain,” where thoughts and impulses traveling throughout the brain are sorted and processed (Center on the Developing Child, 2011). Most scholars of EF agree that there are three related, yet distinct, components that constitute EF: working memory, or the ability to hold and manipulate information in your mind; cognitive flexibility, or the ability to shift your attention and perspectives; and inhibitory control, or the ability to remain focused on tasks when distractions are present (Diamond, 2006; Diamond & Lee, 2011).
The EF construct is closely related to self-regulation—another topic that has garnered significant interest in education circles as a critical component to early school success (Morrison, Ponitz, & McClelland, 2010; Schunk & Zimmerman, 1997). Morrison et al. posit the notion of behavioral self-regulation, which is closely related to EF and which they define as “the execution and manifestation of cognitive processes in overt behavior” (p. 206). Behavioral self-regulation is a higher-order term that differs from EF in that it focuses on the manifestation of numerous cognitive processes in “naturalistic, non-laboratory contexts such as the classroom, which may present unique regulatory challenges” (Morrison et al., 2010, p. 209; Calkins, Graziano, & Keane, 2007; Howse, Calkins, Anastopoulos, Keane, & Shelton, 2003). Morrison et al. illustrate the distinction with the example of student performance on a direct measure of EF: the Dimensional Change Card Sort. While a child may perform well on this task in an individualized assessment setting, he or she may still struggle in the classroom when completing a project, changing tasks, and cleaning up. In fact, research on the relationship between direct EF assessment measures and behavioral outcomes suggests that the correlation is modest (Blair, 2003). As such, there is interest in developing measures of “EF in context,” rather than the discrete and individualized measures of EF leveraged in the present study (Morrison et al., 2010, p. 210).
Numerous school-based interventions aimed at boosting young children’s EF skills have been evaluated (Diamond & Lee, 2011). Broadly, these interventions can be categorized as follows: (a) computerized training; (b) aerobic exercise, martial arts, and mindfulness; (c) classroom curricula; and (d) supplements to classroom curricula. The most popular computerized training program is Pearson’s CogMed, which has been shown to significantly boost children’s working memory skills in particular (Diamond & Lee, 2011; Melby-Lervåg & Hulme, 2013). To illustrate the content of the program, for example, one game asks children to disarm mines by selecting those on the screen in the specific order that they illuminate. As children progress through phases of the game, the demands placed on them increases, which is critical for sustained positive effects on EF (Holmes, Gathercole, & Dunning, 2009; Pearson, n.d.).
There is also evidence that aerobic exercise, martial arts, and mindfulness positively affect children’s EF development and, especially, the combination of all three (Diamond & Lee, 2011). For example, one experiment assigned students to either a treatment condition of tae kwon do or a control condition of standard physical education (Lakes & Hoyt, 2004). The children in the treatment group performed significantly higher than the control group on all dimensions of EF that were studied, including inhibitory control and perseverance. In addition to the physical demands of tae kwon do, the students began each session by self-monitoring and planning by asking questions such as “Where am I?” and “What am I doing?” which direct them to select and act on specific behaviors to attain a goal (Diamond & Lee, 2011).
The Tools of the Mind curriculum is one of the most well-known and most researched curricula aimed at boosting EF. The program is designed for preschool and kindergarten classrooms and is largely based on Vygotsky’s work (1980). The curriculum is child centered, play based, and focused on dramatic play. For instance, children plan a pretend scenario and determine the characters. The role of the teacher is to ensure that the children stick to their plan. In doing this, the teacher supports the students with diminishing levels of scaffolding so that they can develop a plan and carry it out as intended. A couple of program evaluations have shown positive effects on EF skills (Blair and Razza, 2007; Diamond & Lee, 2011), though more recent evaluations found no positive effects (Morris et al., 2010; Wilson & Farran, 2012).
Finally, a number of supplemental programs to curricula aim to boost EF skills. These programs, such as Promoting Alternative Thinking Strategies (PATHS) and the Chicago School Readiness Project (CSRP), largely focus on providing teachers with strategies to help their students develop better self-control, manage their feelings, and appropriately handle interpersonal problems (Diamond & Lee, 2011). For example, the CSRP helped Head Start teachers develop clear routines and rules, reward positive behavior, and establish a common language for addressing emotions in the classroom. There is evidence that PATHS and CSRP are both associated with improvements in children’s EF skills (Morris et al., 2010; Raver et al., 2008; Raver et al., 2011). That said, evidence from a cluster-randomized trial supplementing math and reading preschool curricula with elements from PATHS found that its inclusion did not add benefits for academic or socioemotional outcomes (Lonigan et al., 2015).
Together, these various interventions demonstrate that school-based efforts can indeed influence the development of EF in young children. Furthermore, a common thread between these programs is that teachers play a particularly significant role in setting the conditions necessary for EF development. Specifically, the involvement and judgement of teachers are necessary to continually increase the demands placed on children, a factor that is associated with the highest EF gains in these programs (Diamond & Lee, 2011). As a consequence, it is likely that teachers may vary in how effective they are in supporting children’s EF development. For example, some teachers may be more involved in pretend play activities, ensuring that character roles are defined and maintained throughout the activity. Also, simple alterations to the structure and processes of the school day, such as alternating how students line up to go to lunch, may help to boost children’s cognitive flexibility. Together, this review of EF programs and discussion of the roles that schools and teachers play in them helps to conceptualize some of the ways in which variation in school- and teacher-associated EF gains may occur.
Relationship Between EF and Academic Achievement
Many studies have demonstrated a strong correlational association between EF and academic achievement (Blair & Razza, 2007; Bull & Lee, 2014; Yeniad, Malda, Mesman, van Ijzendoorn, & Pieper, 2013), but fewer studies have shown that the relationship is causal (Jacob & Parkinson, 2015; Willoughby, Kupersmidt, & Voegler-Lee, 2011). In a recent meta-analysis, Jacob and Parkinson reviewed 67 studies on the relationship between EF and academic achievement. The authors found strong evidence that academic achievement and EF are related yet weak evidence on determining if the link is causal.
The conclusion from this meta-analysis that there is not robust evidence for causality has since been called into question (Crawford, 2015; Willoughby & Little, 2015). Willoughby and Little note that the meta-analysis consisted of small convenience samples, included varied and psychometrically weak measures of EF, and prioritized child intelligence as a confounding variable. The authors attempted to address the aforementioned limitations through an analysis of a nationally representative sample of children who were assessed from kindergarten through second grade. Using a within-person fixed effects approach that implicitly controls for time-invariant confounders, the authors found evidence that improvements in working memory were related to corresponding improvements in math and especially reading achievement. While these findings are not causal, they provide strong evidence that such a relationship exists.
Measuring the Influence of Schools and Teachers
Dating back to the Coleman report (1966), researchers and policy makers have had an interest in measuring the contribution of schools and teachers to students’ academic achievement. Through years of research on the topic, a robust literature has emerged demonstrating that teachers are the most important in-school factor contributing to students’ academic achievement gains (Chetty et al., 2011; Nye et al., 2004; Palardy & Rumberger, 2008; Rivkin, Hanushek, & Kain, 2005). Nye and colleagues authored a seminal review of teacher effects studies, estimating that the share of variation in student achievement attributable to teachers is a standard deviation (SD) between 0.07 and 0.20. Assuming that teacher effects are normally distributed, the authors estimated the difference between a teacher at the 25th percentile of the effectiveness distribution and the 75th percentile to be approximately a half SD in mathematics and a third SD in reading. Additionally, the authors found that variation in teacher effectiveness is larger in low-income schools than in high-income schools.
Despite the recent rise in school-based interventions aimed at boosting students’ social and emotional competencies, as well as other nonacademic outcomes (Durlak, Weissberg, Dymnicki, Taylor, & Schellinger, 2011), very few studies have examined the influence of schools and teachers on these outcomes. In fact, only two studies have used VAMs to examine the potential effects of teachers and schools on specific skills outside academic achievement (Jennings & DiPrete, 2010; Ruzek et al., 2014). Jennings and DiPrete examined the extent to which teachers influence students’ social and behavioral skills in early elementary school, using data from the 1998–1999 cohort of the Early Childhood Longitudinal Study–Kindergarten (ECLS-K). The authors found that the effect of teachers on students’ social and behavioral development is sizable and slightly larger than that for academic achievement. However, their measures to operationalize social and behavioral skills were not ideal, as the authors used teacher ratings, which are susceptible to reference bias (Duckworth & Yeager, 2015; West et al., 2014). As I discuss later, the outcome variables in the current study come from a direct cognitive assessment of children, provide reliable measures of the constructs, and eschew the reference bias associated with teacher-reported scales (Duckworth & Yeager, 2015).
Ruzek and colleagues (2014) used VAMs to measure teacher contributions to students’ motivational orientations and mathematics performance. The authors found that the amount of variation associated with teachers is smaller for motivational orientations than for mathematics achievement—the opposite of Jennings and DiPrete’s finding. Despite the smaller teacher effects on motivational orientation in comparison with mathematics performance, these effects were still practically significant. The authors estimated that a 1-SD shift in the distribution of teacher effectiveness in terms of student mastery orientation is associated with a 40% smaller decline in student mastery goals. Unlike Jennings and DiPrete (2010), who used teacher-reported survey measures, Ruzek and colleagues leveraged scores from self-reported student surveys.
Significance of the Early Grades
The transition to formal schooling is a critical juncture in children’s development, and their experiences in the early grades have lasting impacts on later life outcomes (Barnett, 2011). It is a period of great adjustment, particularly for children raised in poverty (Pianta & Walsh, 2014), and EF skills can play an important role in school adjustment (Ursache et al., 2012). Blair and Diamond (2008) outline the role that EF skills in early schooling play in preventing school failure. They suggest that EF’s promotion of goal-directed behavior facilitates individual agency and a sense that children are capable of independent learning. Children who lack these skills become frustrated and resistant to schoolwork, and they experience negative student-teacher relations. A focus on developing children’s ability to persist in tasks and become confident and independent learners, according to Blair and Diamond, facilitates acquisition of academic content.
In addition to children’s experiences in the early grades having a significant impact on later success, it is also the time when EF skills are developing most rapidly (Anderson, 2002; Best et al., 2011). Best et al. found that the rate of EF skill development is highest in early childhood (5–8 years old) and diminishes thereafter. In fact, by the age of 15, nearly all EF skill development is complete.
Present Study
Situated at the nexus of school and teacher effectiveness, EF, and early-grade education literatures, this descriptive study examines the variability in school- and teacher-associated changes in student EF skills in kindergarten. While this article cannot provide exact causal estimates of the effect of schools and teachers on EF gains in kindergarten, it does attempt to approximate this effect by controlling for prior assessment performance and a robust set of child, family, and school control variables. This study adds to the nascent literature that examines the extent to which student growth in nonacademic outcomes is associated with schools and teachers. I leverage the first-ever direct EF assessment data from a nationally representative sample of 10,800 public school kindergarteners to answer the following research questions:
Research Question 1: How large is the variation in school- and teacher-associated changes in student EF skills in kindergarten?
Research Question 2: How large is this variability in comparison with that for mathematics and reading achievement gains?
Research Question 3: To what extent is school- and teacher-associated variability in EF gains correlated with that of mathematics and reading achievement?
Given the established link between schools and teachers on student achievement outcomes, the first research question begins to examine how much schools and teachers may similarly contribute to EF gains. Relatedly, the second research question focuses on examining how comparable in magnitude school- and teacher-associated variability is between math and reading achievement gains on one hand and EF gains on the other. Finally, the third research question examines the extent to which school- and teacher-associated variability in EF and academic achievement gains is correlated.
Data
Data Source
To answer these questions, this study leverages data from the ECLS-K class of 2010–2011 (ECLS-K:2011), which is an ongoing project sponsored by the National Center for Education Statistics within the Institute of Education Sciences of the U.S. Department of Education (Tourangeau et al., 2015). The ECLS-K:2011 is a nationally representative sample >18,000 children who entered kindergarten in the fall of 2010 and who were followed through the end the 2015–2016 academic year. Information for the study was collected through parent, teacher, and school administrator surveys, as well as one-on-one assessments of children. The ECLS-K:2011 provides a unique opportunity to explore the relationship among teachers, schools, and students’ EF development with the inclusion of two direct assessment measures. It is the first nationally representative and longitudinal study of primary school–aged children that incorporates direct assessments of EF skills.
The ECLS-K:2011 employed a complex multistage sampling design, where 90 primary sampling units were first sampled, followed by public and private schools within each primary sampling unit and, finally, kindergarten children in each school. Data were collected from sample members in the fall and spring each academic year. During kindergarten, the full sample was included in the fall and spring data collection rounds. This analysis takes advantage of the pre- and postkindergarten assessment scores from the entire ECLS-K:2011 sample to isolate the growth of children’s EF and academic skills to the kindergarten school year.
Sample
A number of filters were used to derive the analytic sample. The entire kindergarten sample began with 18,170 participants. First, students who attended a private school (2,190 observations) were excluded because public schools are most amenable to policy intervention and are the focus of most VAM studies (Ladd, 2008). 1 Next, observations were excluded where the child had a different teacher or school between the fall and spring data collection periods in kindergarten (2,920 observations). If a student did not have the same teacher or school for the entire academic year, it would be impossible to associate the influence of that teacher or school on the students’ gains in academic achievement and EF. Finally, only (a) schools with two or more sampled classrooms and (b) classrooms with three or more sampled students were included in the final sample (2,270 observations). This restriction mirrors the approach used by other analyses of teacher and school effects based on ECLS-K data (Croninger, Rice, Rathbun, & Nishio, 2007; Jennings & DiPrete, 2010).
The final analytic sample thus included 10,790 students, 1,990 teachers, and 630 schools. 2 Averages included 5.4 students per class and 3.2 classes per school. I use sampling and replicate weights provided in the ECLS-K:2011 data set to account for nonrandom sampling, attrition between data collection waves, and the clustered sampling design (Tourangeau et al., 2015). Specifically, I use the W12ACO sampling weight and the W1C1–W1C80 replicate weights, which were incorporated using the jackknife replication method with two primary sampling units per stratum (JK2). Additionally, multiple imputation was used to address the large number of cases that would have been omitted during analysis of complete case data. Specifically, I utilized Stata’s MI command to generate 20 imputed data sets, and I used the chained equations methodology (Royston & White, 2011; StataCorp, 2013). 3
Outcome Measures
Dimensional Change Card Sort
The Dimensional Change Card Sort (DCCS) measures children’s cognitive flexibility, which is commonly referred to as shifting (Zelazo, 2006). In this task, children are asked to sort a series of 22 picture cards based on two criteria. Each card has either a red rabbit or a blue boat. There are two trays where children sort their cards: one with a red boat and one with a blue rabbit. In the first game (Color Game), children are asked to sort the cards into two groups according to the whether the card is red or blue. In the second game (Shape Game), children are asked to sort the cards into two groups based on whether the card is a rabbit or a boat. If the child performs well on the first two components of the DCCS, they are then given a third and final task with the cards (Border Game). In this game, cards are sorted on the basis of whether the card has a border. If the card has a border, the child is supposed to sort according to the color of the card; if the card has no border, the child is supposed to sort according to the shape of the image on the card. A composite score was used as the outcome, as recommended by the task developer to provide a measure of general performance across all three games.
Woodcock Johnson III: Numbers Reversed subtest
The Numbers Reversed subtest of the Woodcock Johnson III measures children’s working memory (Blackwell, 2001). In this task, an assessor asks the child to reverse a digit span that was presented orally. For example, an assessor would say “one-six,” and the child should respond “six-one.” All children begin with 5 two-number sequences; then, based on performance, the amount of numbers in the sequence increases to a maximum of eight numbers. I use the W score available in the data file for analysis. The W score is a standardized score based on a transformation of the Rasch Ability Scale, and it provides a uniform scale of equal intervals that represents a child’s ability as well as the difficulty of the item.
Mathematics achievement
The mathematics component of the cognitive assessment measures skills in conceptual knowledge, procedural knowledge, and problem solving. Specifically, the assessment captures achievement in number sense, properties, and operations; measurement; geometry and spatial sense; data analysis, statistics, and probability; and patterns, algebra, and functions. All children were given a common set of routing questions at the beginning of the assessment and were then assessed with a set of high-, medium-, or low-difficulty questions. Because all children did not receive the same set of questions, I used vertically aligned item response theory scores for analysis (Tourangeau et al., 2015).
Reading achievement
The reading component of the assessment includes questions that measure basic skills, such as print familiarity and letter recognition, as well as vocabulary knowledge and reading comprehension. The reading comprehension questions required children to define words, provide supporting detail, and make complex inferences. As with the mathematics assessment, I used item response theory scores provided in the data file for analysis (Tourangeau et al., 2015).
The four outcome variables (DCCS, Numbers Reversed, mathematics, and reading) were each converted into SD units, where each outcome has a mean of zero and an SD of one.
Covariates
The ECLS-K:2011 provides a wealth of information about children’s background characteristics that I leverage to attempt to account for nonrandom sorting of children into schools. I include indicator variables to account for the child’s gender, race, primary language spoken at home, presence of one or two guardians at home, center-based preschool attendance, and whether the child was repeating kindergarten. A continuous measure of socioeconomic status was used, as developed for the ECLS-K:2011. This standardized measure was derived from a combination of parents’ education, occupational prestige score, and household income. Other continuous control variables include the number of individuals living in the child’s home, the number of siblings that a child has, and the amount of time (in months) between the fall and spring assessments. This last measure was necessary because not all assessments were conducted at the beginning or end of the school year, so this variable accounts for different levels of “exposure” to kindergarten due to assessment timing.
In the parent survey, respondents were asked a series of questions about what types of activities their children participate in at home and how frequently they do them. Specifically, these items asked parents how often they (a) tell their child stories, (b) sing songs with their child, (c) help their child do art, (d) assign their child to do chores, (e) play games with their child, (f) talk with their child about nature, (g) build things with their child, (h) do sports with their child, and (i) practice reading and writing numbers with their child. These items form a single continuous Home Environment, Activities, and Cognitive Stimulation Scale, which is included to account for the varying levels of activity and subsequent stimulation children receive at home.
Summary statistics for all measures are presented in Appendix A, along with comparisons between the starting and analytic samples.
Methods
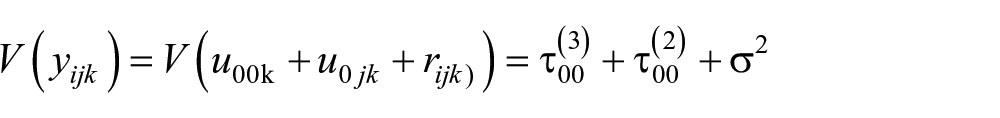
I measure the variation in student gains on the math, reading, and the two EF assessments associated with schools and teachers based on hierarchical linear models (HLMs; Raudenbush & Bryk, 2002). Specifically, I employ a three-level random intercept model that partitions variance in the outcome (Yijk) into variance among students within classrooms (rijk), variance among classrooms within schools (u0jk), and variance across schools (u00k). The model was specified as follows:

where Yijk is the standardized assessment score of student i in classroom j in school k,
The percentage of variance associated with each level of the model is the quotient of each level’s variance component divided by the total variance (Rabe-Hesketh & Skrondal, 2008). Specifically, I use the following specification to calculate the proportion of variance at each level of the model.


Following the guidance of Raudenbush and Bryk (2002), I first estimate a fully unconditional “null” model, which includes only the outcome variable. This model provides a baseline for the proportion of variance in assessment gains at each of the three levels. Next, I estimate the full, covariate-adjusted model that accounts for each child’s fall assessment performance, time between assessments, gender, race, home language, kindergarten entry age, number of parents, number of siblings, family size, socioeconomic status, center-based preschool attendance, whether the child is a first-time kindergartener, and a composite score for home environment, activities, and cognitive stimulation. Finally, I estimate a third model that includes the average socioeconomic status of the school to account for potential contextual effects of school demographics on student gains.
Next, to examine the extent to which school- and teacher-associated variation in one domain is correlated with others, I predict empirical Bayes estimates of the random effects components. Specifically, I predict the estimates for the school- and teacher-level random effects components for each of the four outcome measures and then examine the correlation among the estimates. Since there are a relatively small number of students per class and classes per school, the error associated with these estimates is large. While the data structure may not enable highly precise estimates, this method provides a general estimate of the extent to which school- and teacher-related variability is consistent across domains (Jennings & DiPrete, 2010).
While this analysis includes a range of covariates to attempt to control for the nonrandom selection of students into schools and to approximate the effect of schools and teachers on EF gains in kindergarten, these estimates are correlational and not causal. The discussion of random effects estimates does not imply causality—these estimates simply refer to the amount of variation that exists among students within classes, among classes within schools, and across schools. Furthermore, variance decomposition based on HLM provides insight into the amount of variation within each level of the hierarchy, but it does not reveal the overall magnitude of teacher and school effects. For example, if all the schools in the sample had an identical influence on EF gains, then the variance component would be equal to zero. This does not mean that schools have no influence on EF gains; rather, they do not vary in their effectiveness.
Finally, it is important to note that VAMs, as used in this study, refer to an analytic method that aims to measure the unique contribution of schools and teachers to students’ EF gains while accounting for differences in student background characteristics. In practice, VAMs vary widely in their specification (American Educational Research Association, 2015; American Statistical Association, 2014).
Results
The results presented in this section are organized as follows: (a) variance components from the null models for each outcome, (b) variance components from the conditional models for each outcome, (c) SDs of variance components from the full covariate-adjusted models, and (d) correlations among the random effects estimates.
Null Model Variance Components
The results for both the unconditional null models and the full covariate-adjusted models are summarized in Table 1, for each of the four outcomes. For each model, the three variance components, the total variance, and the percentage of variance attributable to each level of the model are provided. For both the unconditional mathematics and reading models, the majority of the variance in the outcome resides among students within classes (~79%). This finding is not surprising given the well-established link between student background and academic achievement. At the teacher level (teachers within schools), the percentage of variance is 4.4% in mathematics and 6.69% in reading. These classroom-level variance components are similar to those reported in analyses of ECLS-K data by Jennings and DiPrete (2010) and Palardy and Rumberger (2008). At the school level, 16.2% of the variance for mathematics and 14.6% for reading reside across schools, likely attributable to the nonrandom selection of families into schools based on their socioeconomic status.
Variance Components of Hierarchical Linear Models

Note. All estimates are weighted with W12ACO to adjust for the complex survey design of the Early Childhood Longitudinal Study–Kindergarten Class of 2010–2011. n = 10,800, rounded to the nearest 10, per guidelines of the National Center for Education Statistics. Standard errors are presented in parentheses.
DCCS = Dimensional Change Card Sort.
Student + socioeconomic status of the school.
The unconditional models for the two EF outcomes are similar, although they both indicate higher levels of variation among students within individual classrooms. For the Numbers Reversed measure, 88% of the variance is among students within classrooms, 1.5% among classrooms within schools, and 9.7% across schools. For the DCCS, 91.6% of the variance is among students within classrooms, 0.1% among classrooms within schools, and 8.3% across schools. These unconditional models provide only a raw decomposition of the variance in the outcomes and serve as a baseline from which to compare the variance components from the full models.
Conditional Model Variance Components
In Table 1, the conditional model variance components are presented in the second and third columns under the four outcome headers. There is essentially no difference between the second model (which conditions on the full set of child-level covariates) and the third model (which conditions on school-level socioeconomic status in addition to child-level covariates). As a result, I detail only the results from the full school- and child-level covariate models here. For the two academic achievement models, the introduction of prior achievement and demographic characteristics significantly reduced the proportion of variance that exists across schools. This is unsurprising given what is known about how children are differentially sorted into schools based largely on background characteristics. These models indicate that approximately 9% of the variation in mathematics reading resides at the school level. At the classroom level, the proportion of variance for mathematics was only slightly attenuated with the introduction of controls. For reading, the proportion of variance at the classroom level was essentially unchanged. This finding is likely attributable to the fact that (a) sorting based on student characteristics is more prevalent across schools and (b) within-school sorting is more prevalent in higher grades (Kalogrides & Loeb, 2013). Again, these results are largely consistent with intraclass correlation coefficients reported in prior analyses (Jennings & DiPrete, 2010; Palardy & Rumberger, 2008).
Similar to the full academic achievement models, the introduction of control variables significantly reduced the about of variance in the EF models that reside across schools. In fact, for Numbers Reversed, the percentage of school-level variance dropped from 9.7% to 2.4% between the two models. For the DCCS, the reduction was slightly less, dropping from 8.3% to 4.2%. The variance at the classroom level for the two EF outcomes is very small for Numbers Reversed (0.10%) and rounds to 0.00% for the DCCS. This finding means that there is very little, if any, variation in performance on these EF measures that is associated to differences among classrooms within schools. See Appendix B for an overview of alternative estimation strategies that were used as a robustness check. These checks yielded highly similar results to the full covariate-adjusted three-level HLM and provide support for the aforementioned variance components.
SDs of Variance Components
In Table 2, I present the SD of the school- and teacher-level variance components, which is the square root of the variance, for each of the four outcomes. While the variance components outlined in the previous section may appear small, especially for EF, it is unclear how practically significant those estimates are. By converting these estimates into SD units, it is possible to illustrate the association of a one-SD shift in the distribution of school or teacher random effects on each outcome. For the Numbers Reversed task, a one-SD shift in the distribution of school random effects corresponds to a 0.13-SD difference in EF assessment gains. For the DCCS, a one-SD shift in the distribution of school random effects corresponds to a 0.19-SD difference in EF assessment gains. These estimates for school-level random effects are similar to those for mathematics and reading achievement.
Standard Deviation Conversion of Random Effects
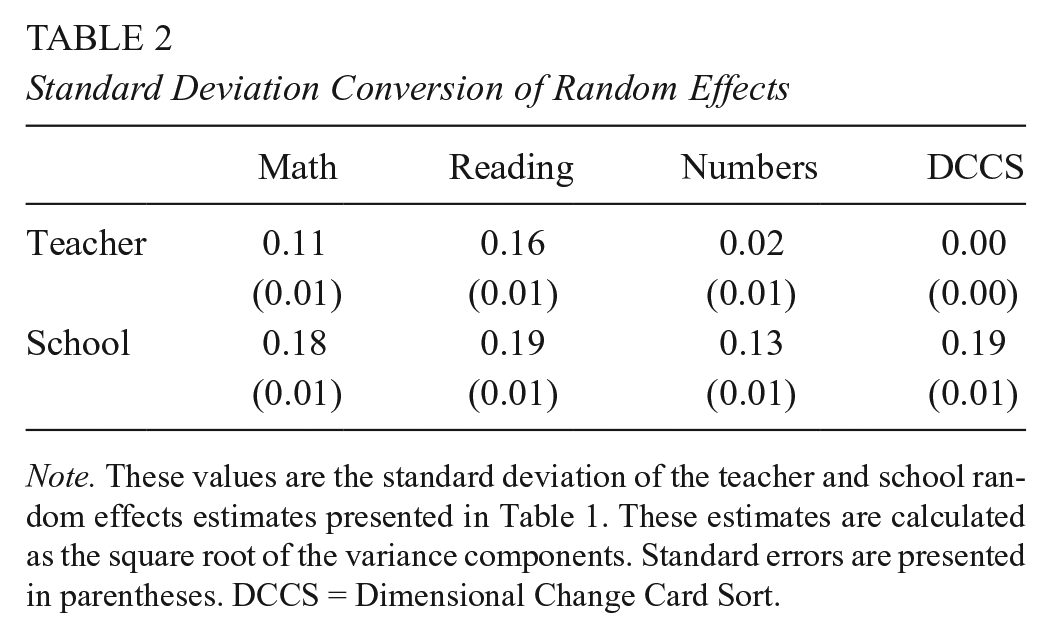
Note. These values are the standard deviation of the teacher and school random effects estimates presented in Table 1. These estimates are calculated as the square root of the variance components. Standard errors are presented in parentheses. DCCS = Dimensional Change Card Sort.
At the classroom level, the SDs of the random effects for EF are much smaller than those for academic achievement. In fact, for the DCCS, the SD of the classroom-level variance rounds to 0.00. For the Numbers Reversed measure, the SD of the classroom-level variance is 0.02, which suggests that a one-SD change in the distribution of teacher random effects is associated with a 0.02 difference in gains on the Numbers Reversed task. In sum, it appears that school-related variability in EF gains is substantial, while there is little to no variation associated with differences among classrooms within schools.
Random Effects Correlations
Table 3 summarizes findings from the final component of this analysis, which focuses on the extent to which school random effects estimates are correlated across the domains assessed in the ECLS-K:2011. Since the proportion of variance that resides among teachers within schools is essentially zero for the EF outcomes, I focus on only the school-level random effects. For the school random effects, mathematics and reading estimates are the most correlated at 0.44. Of the two EF measures, Numbers Reversed, which measures working memory, is more highly correlated with the academic outcomes than the DCCS, which measures cognitive flexibility. Ranging from 0.14 to 0.31, the correlations are small between the EF random effects and the academic achievement random effects. This finding suggests that school- and teacher-associated variability is loosely coupled between these two domains. Finally, the random effects estimates between the two EF measures are also weakly correlated (0.16).
Correlations of Random Effects Estimates

Note. These estimates are the correlation coefficients between estimates of kindergarten school-level random effects on academic achievement and executive function skills. DCCS = Dimensional Change Card Sort.
In sum, these findings provide evidence that (a) variation in EF gains among teachers within schools is essentially zero, (b) variation in EF gains across schools is smaller than that for academic achievement but still practically significant, and (c) school random effects on academic achievement and EF are not tightly coupled.
Discussion
The purpose of this study was to add to the nascent literature that leverages VAMS to measure the school- and teacher-associated variation in terms of student outcomes beyond academic achievement. Focusing on EF skills in kindergarten, this study provides preliminary evidence that schools, not teachers within schools, vary in their contributions to EF skill development. In fact, the amount of school-associated variability is sizable—a one-SD shift in the distribution of school random effects is associated with a 0.13-SD difference in working memory gains and a 0.19-SD difference in cognitive flexibility gains. Another key finding from this analysis is that school-associated changes in EF skills are loosely coupled with changes in academic achievement. I now turn to consider the results from this analysis in terms of the existing literature, discuss policy implications, highlight the limitations of the current study, and suggest directions for future research.
The finding that there is essentially no variation in EF gains among teachers within schools is surprising given the substantial teacher-level variation found in previous studies that focus on academic achievement outcomes (Croninger et al., 2007; Palardy & Rumberger, 2008), as well as the mathematics and reading teacher-level variance components reported in this analysis. Furthermore, Jennings and DiPrete (2010) and Ruzek et al. (2014) both measured teacher contributions to nonacademic outcomes and found variation among teachers within schools. One potential explanation for this is that interventions aimed at boosting EF skills are implemented at the school level and do not allow for much difference among classrooms. For example, common EF interventions include curricula (e.g., Tools of the Mind) and software training programs (Diamond & Lee, 2011). Additionally, evidence suggests that a link exists between childhood physical activity and EF, which is likely to be similar across classrooms within schools (Khan & Hillman, 2014). In other words, it could be the case that school-level variability in the “scaffolding” that promotes EF development may not vary within schools. Future research should investigate this finding to understand why differences in individual teacher approaches or classroom characteristics do not appear to produce variation in students’ EF gains.
Another possible explanation for these findings is related to measurement. As discussed in the review of the literature surrounding EF, there is a desire among researchers to better measure “EF in context” (Morrison, Ponitz, & McClelland, 2016, p. 210). Perhaps teachers vary significantly in their contributions to behavioral self-regulation, which represents the ways in which EF skills manifest in behavior within the classroom. Indeed, given that the correlation between direct individual assessment of EF and higher-order measures of behavioral regulation is modest (Blair, 2003), subsequent inquiry should include measures of both to disentangle the sensitivity of estimates of school and teacher effects to different measures of EF and self-regulation.
As a first step in examining the potential relationship between schools and teachers on EF gains, this study sought to understand the greatest amount of variability associated with schools and teachers, holding constant student demographic factors. That said, this study did examine the extent to which school-level socioeconomic status reduced school-level variation in EF gains. It is somewhat surprising that the inclusion of this measure in the third set of models did not reduce school-level variability in EF gains. There is evidence suggesting that the aggregate impact of peers on student-level outcomes can be sizable (Duncan & Magnuson, 2011; Gottfried, 2015). Future research should seek to further understand the ways in which school and classroom context may influence student EF skills, including measures of peer achievement levels, problem behaviors, EF skills, and family income, for example.
While outside the scope of the current study and in addition to understanding peer influences, future work should begin to understand what specific school- and teacher-level factors explain variability in EF gains. Research on teacher and school effectiveness suggests that easily identifiable characteristics, such as teacher degree or school size, are relatively poor predictors of school and teacher value added to student achievement gains (Clotfelter, Ladd, & Vigdor, 2007; Nye et al., 2004). However, it is critical to identify these factors so that changes in policy and practices can be made.
The relatively low correlation between the school-level random effects estimates for academic achievement and EF gains suggests that schools that are successful at producing gains in mathematics achievement, for example, are not necessarily effective at improving students’ working memory skills. However, as Jennings and DiPrete (2010) highlight in their analysis of ECLS-K data, the small number of cases within each cluster inhibits the precision of these estimates, and the reported correlations are likely underestimated. Nonetheless, this finding raises important questions about school accountability and teacher evaluation policies that place a great deal of weight on academic outcomes. These approaches may not capture other ways in which schools contribute to domains that are important for student success.
The finding that school random effects for EF are weakly correlated to those for academic achievement is also puzzling given the literature on the relationship between EF and academic achievement. Since there is strong evidence that gains in EF are associated with gains in academic achievement, we would expect school-associated variability in academic achievement and EF to be highly correlated. That said, research on specific domains of EF suggests that working memory is more strongly related to academic achievement outcomes than cognitive shifting (Best et al., 2011; Blair & Razza, 2007; Epsy et al., 2004). From this perspective, it makes sense that the correlation between school random effects for Numbers Reversed (working memory) and academic achievement is larger than that for DCCS (cognitive shifting) and academic achievement.
Relatedly, even among the two EF measures, the correlation of the school-level random effects is small (0.16). While related and both considered EF, working memory and cognitive shifting are two distinct domains. Prior research on EF shows that measures of cognitive flexibility and working memory are not highly correlated (St. Clair-Thompson & Gathercole, 2006; Willoughby et al., 2011; Willoughby & Little, 2015). In fact, based on the ECLS-K:2011 data, the bivariate correlation is 0.28 between Numbers Reversed and DCCS at the end of kindergarten. Other analyses of EF constructs have found correlations among working memory and shifting measures to be low (Friedman et al., 2006) and even negative (St. Clair-Thompson & Gathercole, 2006). Furthermore, evidence from the VAM literature indicates that estimates of teacher and school effectiveness are not perfectly correlated across different academic subjects (Goldhaber, Cowan, & Walch, 2013; Koedel & Betts, 2007). Future research should examine why school-related factors appear to be differentially associated with these two separate domains of EF. Is it that schools differ in their ability to promote specific domains of EF? If so, more granular analyses of school-based interventions are needed to specify their effectiveness, not just on EF as a general construct, but also on the specific domains of EF.
This study has a number of limitations that should be addressed in future research. First and most important, these estimates are correlational and should not be interpreted as causal. Additionally, due to the ECLS-K:2011 survey design, there are relatively small numbers of students per classroom and classrooms per school, which hinder the precision of estimates. Also, this analysis focuses on one cohort of kindergarteners, which may lead to upwardly biased estimates of variance components (Rockoff, 2004). To address this limitation, we need to have data on kindergarten students over a number of years for the same teacher. Additionally, I focus only on public school kindergarten students, which limits generalizability to other grades. However, based on research on the developmental trajectory of EF skills throughout childhood, we have reason to believe that school and teacher effects would decline in later grades (Best et al., 2011). Finally, the ECLS-K:2011 cognitive assessment did not include a direct measure of inhibitory control, which is often seen as a third component of EF, in addition to working memory and cognitive flexibility (Diamond & Lee, 2011). In future research, additional measures of EF should be included (both direct assessment and teacher ratings) to ensure the robustness of these findings to different EF domains and different instruments.
Conclusion
The emphasis on VAMs in education and their application within an accountability context incentivizes teachers and school leaders to focus on academic achievement. While it is certainly true that academic achievement is a central goal of education, it is but one of many goals. One of the common criticisms of VAMs is that they focus too narrowly on standardized tests as outcomes, which have been shown to cause teachers and schools to divert resources away from nontested areas (Harris, 2011). In recent years, the evidence base demonstrating the importance of nonacademic factors to student success, proximal and distal, has burgeoned (Durlak et al., 2011). Further research is needed to understand how much and in what ways schools and teachers may influence students’ development of nonacademic outcomes. This study has begun to answer the question of how much schools and teachers may matter for the development of EF skills in kindergarten. Subsequent research is needed to unpack the specific ways in which schools and teachers are contributing to these outcomes and to extend this work to other critical domains, such as resilience, critical thinking, and cooperation. By broadening our focus to outcomes beyond academic achievement, we provide an opportunity to further boost achievement, as well as ensure that students are healthy, happy, engaged, and supported.
Footnotes
Appendices
Notes
Author
MICHAEL H. LITTLE is a Royster Fellow and doctoral student at the University of North Carolina at Chapel Hill, Peabody Hall, Campus Box 3500, Chapel Hill, NC 27599-3500;