
Abstract
Teacher evaluation systems treat instructional quality as generic. Principals often observe elementary teachers in one subject and generalize assessments to all subjects. However, there is little empirical work to justify these decisions. This study provides needed evidence about whether elementary teachers engage in comparable instruction across the school day. We draw on data from the Measures of Effective Teaching (MET) project, including student survey and classroom observational data from more than 500 elementary teachers. Findings indicate that there is moderate within-teacher, cross-subject consistency on the Tripod and Classroom Observation Scoring System (CLASS). Cross-subject correlations are higher on the Tripod scales (r values from 0.55 to 0.73) than the CLASS dimensions and domains (r values from 0.25 to 0.55). These findings suggest that teaching quality is not a uniform construct across subjects, even though current teaching evaluation systems largely treat it as such. Implications for elementary teacher preparation, professional development, and evaluation are discussed.
Keywords
Introduction
A principal walks into a fourth-grade classroom and observes students engaged in rich, mathematically complex tasks. The teacher circulates around the room, providing detailed feedback to students. Management issues are seemingly invisible, and students are respectful and warm with each other and their teacher. The principal might assume this snapshot of instructional quality should be attributed to the teacher and hypothesize that a writing lesson in that same classroom run by the same teacher would feature similar characteristics. In fact, most current teacher evaluation systems rest on that assumption: that teaching quality is stable across content areas. Principals often observe elementary teachers in a single subject and generalize those assessments of instructional quality across subjects (J. Cohen & Goldhaber, 2016). In other words, evaluation systems treat measures of teaching as measures of teachers without recognizing the ways in which instructional quality may vary across subjects, even when the same teacher is working with the same students (Bell et al., 2012; Gitomer, 2009).
Decades of research on teaching suggests such assumptions might be misguided, that teaching activities and corresponding quality are situated in the particular content of instruction (D. K. Cohen, Raudenbush, & Ball, 2003; Stodolsky, 1988). Based on this, one would hypothesize that the teacher of the high-quality mathematics lesson described previously might not demonstrate the same teaching quality in a writing lesson because of various factors, from content knowledge in the two subjects, to the curricular materials made available in different subjects, to the students’ prior histories in mathematics and writing instruction (Graybeal & Stodolsky, 1986). Indeed, the cross-subject stability of measures of teaching quality has been a recent topic in the value-added literature. Asking whether “a good elementary teacher is always good” (Goldhaber, Cowan, & Walch, 2013), researchers have found moderate within-teacher, cross-subject correlations on value-added models (VAMs), ranging from 0.35 to 0.65 (Goldhaber et al., 2013; Loeb & Candelaria, 2012; Loeb, Kalgorides, & Béteille, 2012; Teh, Resch, Walsh, Isenberg, & Hock, 2013). These findings indicate that some, but not all, individuals are comparably effective at influencing student achievement on standardized tests in different subjects. However, given that less than 30% of teachers are assessed with VAMs (Watson, Kraemer, & Thorn, 2009), districts designing evaluation systems would benefit from comparable analyses of other measures of teaching quality, including classroom observations and student surveys.
Observational measures are used to assess nearly every teacher in America (Goldring et al., 2015), and student surveys have been administered to more than a million students over the past 15 years (Ferguson, 2012). Both types of measures are used in consequential evaluation systems and teacher professional development (Allen, Pianta, Gregory, Mikami, & Lun, 2011; Downer, Stuhlman, Schweig, Martinez, & Ruzek, 2014). Given that nearly 90% of all elementary teachers instruct in multiple content areas, it would be helpful for districts and school leaders to know more about the stability of these measures across subject areas. Information about within-teacher, cross-subject variability in instructional quality could inform decisions about teaching assignments (e.g., subject specialists vs. generalists) and allow for more targeted professional development (e.g., extra support in mathematics instruction). Allocating resources based on teachers’ relative strengths and weaknesses is predicated on evaluation systems that parse the measurement of instructional quality in different subjects. Current evaluation systems rarely provide this kind of subject-specific information about teaching (J. Cohen & Goldhaber, 2016).
This paper leverages data from the largest study of teaching ever conducted, the Gates Foundation’s Measures of Effective Teaching (MET) project (Kane & Staiger, 2012), to analyze the degree to which the same elementary teachers demonstrate the same levels of instructional quality in mathematics and English language arts (ELA) based on the ratings of outside observers and their own students. In doing so, we raise a number of hypotheses about the factors that may contribute to within-teacher, cross-subject variation in such measures. Some of these hypotheses we can test with the MET data, and many we cannot. In surfacing these issues, we make a broader case for more research analyzing cross-subject instructional quality for elementary school teaching and studying cross-subject variability in instructional quality in elementary teacher preparation and professional development.
Background Literature and Framework
D. K. Cohen et al. (2003) theorized that teaching was represented by “an instructional triangle” reflecting the interactions between the teacher, students, and content (see Figure 1). The theory suggests that shifting one corner of the triangle likely shifts the shape as a whole. A key contribution of the MET study was to randomly assign students to teachers to empirically test whether changing the “students” corner of the triangle changed teachers’ value-added estimates, which, on average, it did not (Kane, McCaffrey, Miller, & Staiger, 2013). However, in elementary classrooms, even when teacher and students are the same, the content varies across the school day. Thus, this paper explores whether shifting the “content” corner of the instructional triangle is associated with observable changes in teaching quality. Though our methods do not allow for the causal claims afforded by the student random assignment experiment, our study is the first to use the MET data to look at the question of within-teacher, cross-subject variation in instructional quality across a large and diverse population of elementary school teachers.

Instruction as interaction (from D. K. Cohen, Raudenbush, & Ball, 2003).
In doing so, we draw on Bell and colleagues’ (2012) notion that teaching quality, “the quality of interactions between students and teachers,” is a characteristic of classrooms rather than individual teachers (p. 64). Those interactions are contingent on teacher and student knowledge, practices, and beliefs, which would likely vary by the content of instruction. Curricular materials are largely content specific, and teacher guides for textbooks are differentially elaborated in different subjects (Remillard, 2005; Reutzel, Child, Jones, & Clark, 2014). Principals may be more skilled at providing support for teaching language arts than mathematics (Neumerski, 2013). Districts might have more robust professional development resources for particular subjects (Guskey & Yoon, 2009; Van Driel & Berry, 2012). Research suggests elementary teachers may have differential beliefs (Kagan, 1992; Mewborn, 2001) and knowledge (Ball, 1990; Hill et al., 2008; Leinhardt, Putnam, Stein, & Baxter, 1991) about teaching mathematics and ELA. These all represent content-specific resources for teaching that could shift classroom interactions and corresponding measures of teaching quality.
Given these differences, we would expect within-teacher measures of instructional quality to vary across subjects. There is indeed some empirical evidence that elementary school teachers do not employ the same instructional techniques and activity structures across subjects and that quality correspondingly varies. Stodolsky (1988) used structured, qualitative observations of 20 teachers and analyzed activity structure, pacing, cognitive level, and student involvement in elementary social studies and mathematics instruction. Detailed analysis of these teachers’ instruction led Stodolsky to conclude that the “subject matters” in instructional quality and that “what [teachers] are teaching shapes the way they teach” (p. 74). Wood, Cobb, and Yackel (1990) also focused on instructional activities with a detailed, qualitative case study of a single teacher who provided direct, teacher-led instruction in ELA but allowed students to grapple with open-ended tasks and construct meaning independently during mathematics lessons.
Knapp, Shields, and Turnbull (1995) analyzed the extent to which 140 elementary teachers “taught for meaning” in mathematics, reading, and writing instruction. Using qualitative classroom observations, teacher interviews, analysis of curricular materials, and teacher logs of instructional activities, they found that “what teachers in our sample did in one subject area reveals relatively little about what they did in another” (p. 9). Few teachers seemed to have the resources—knowledge, beliefs, curricular materials, instructional support—to teach for meaning across subjects. Graeber, Newton, and Chambliss (2012) also analyzed cognitive demand for 69 elementary teachers. Drawing on data from classroom observations, teacher logs, and interviews, they also find notable differences in instructional quality based on the content of instruction. Only a small percentage of teachers demonstrated demanding instruction across subjects. These studies do not suggest that instructional quality should vary when teachers teach different subjects, but they provide empirical support that some features of teaching do vary, based on the instructional content.
What is less clear from the extant literature is the degree to which other instructional practices would similarly vary across subjects, particularly those that, on the surface, focus less directly on the teaching of academic content. For example, studies suggest that classroom management is the most temporally stable instructional practice across a range of different classroom observation measures, though no one to our knowledge has analyzed whether such practices are similarly stable across subjects (Gitomer et al., 2014; Polikoff, 2014). However, if students and teacher have different resources, knowledge, and beliefs about different subjects, then following D. K. Cohen et al.’s (2003) theory, we might also expect that all teaching practices would be influenced by such differences. Lower levels of self-efficacy for teaching mathematics than ELA, for example, might contribute to weaker behavior management and a less positive climate in mathematics classrooms (Pajares, 1996).
A new generation of classroom observation instruments allows for these cross-subject comparisons with larger samples of teachers and more facets of instructional quality. The MET study affords the possibility of looking at the cross-subject consistency of instructional quality using multiple measures, including the Classroom Observation Scoring System (CLASS; Pianta, Hamre, & Mintz, 2012) and the Tripod student survey (Ferguson, 2012). Both tools are designed to assess instructional quality and student engagement using classrooms, rather than teachers, as the unit of analysis. CLASS and Tripod have been used reliably across thousands of classrooms in multiple subjects and grade levels (Ferguson, 2012; Pianta & Hamre, 2009).
All measures of instructional quality rest on a theory of teaching and learning. CLASS is based primarily on developmental theory, which suggests the interactions children have with adults and peers drive both learning and social development (Pianta et al., 2012). The tool’s developers suggest children are more likely to be engaged in learning when they have frequent, warm, and supportive exchanges with their classmates and teachers (Pianta & Hamre, 2009). Tripod also assesses classrooms as learning environments in which interactions and student-teacher relationships serve as a primary mechanism for students’ emotional and academic development (Ferguson, 2008; Ferguson & Danielson, 2014). The authors of both tools describe them as measures of the quality of classroom processes and student engagement and a proximal outcome of those processes 1 (Ferguson, 2010; Pianta & Hamre, 2009). Both measures are explicitly designed as content-neutral tools that assess aspects of classrooms that should exist regardless of the subject taught (Ferguson, 2012; Pianta & Hamre, 2009). That is, the instruments themselves are not designed to differentially privilege practices more common in a particular subject. Neither tool assesses features of classrooms that would or should occur more or less during the teaching of mathematics or language arts. Instead, they assess features of high-quality classroom spaces regardless of the content taught. Evidence suggests CLASS and Tripod scores are associated with student outcomes in both mathematics and language arts, indicating they are indeed valid measures of instructional quality across subjects (Allen et al., 2011; Bell et al., 2012; Ferguson, 2012; Ferguson & Danielson, 2014; Kane & Staiger, 2012).
There is also inevitable measurement error associated with any tool designed to assess teaching quality (Ho & Kane, 2013), and evidence suggests that raters are often the largest sources of error (Curby et al., 2011; Ho & Kane, 2013). Different instruments have developed different safeguards for mitigating rater error. CLASS relies on highly trained raters who undergo extensive certification and ongoing calibration exercises to promote consistent scoring, though most studies using CLASS still report moderate intraclass correlation coefficients (ICCs) among teams of scorers, ranging from .15 to .4 (Curby et al., 2011; Hamre et al., 2013; Mashburn, Downer, Rivers, Brackett, & Martinez, 2014). Tripod relies on the perspective of student raters, who are untrained in using the instrument in consistent ways. Unlike CLASS raters, who must demonstrate their skill at scoring according to established norms, Tripod assumes students are able to assess classroom quality as a function of their consistent and ongoing interactions with teachers (Wallace, Kelcey, & Ruzek, 2016). Perhaps because of a lack of training or because students have different classroom experiences, past studies have demonstrated substantial within-teacher variability in Tripod ratings (Raudenbush & Jean, 2013; Schweig, 2014). However, Tripod surveys do aggregate information from the varied perspectives of multiple students, increasing the overall reliability of the tool (Kane & Staiger, 2012).
Despite these newer tools that allow for cross-subject comparisons, there is little empirical evidence about the stability in an individual teacher’s practice across different subjects. Research has focused primarily on other sources of variability, especially temporal variations in instructional quality. Studies have demonstrated within-teacher variability in quality by time of year, occasion (lesson), and time within a lesson (Hill, Charalambous, & Kraft, 2012; Joe, McClellan, & Holtzman, 2014; Pianta & Hamre, 2009). Evidence using CLASS suggests moderate to strong within-year stability (Polikoff, 2014). To enhance the likelihood of comprehensive and stable estimates of practice, most observational measures require multiple observations, separated by several weeks or months (Hill et al., 2012; Ho & Kane, 2013; Pianta & Hamre, 2009). Cross-subject, within-teacher variability in scores is comparatively understudied. Given that so many elementary school teachers engage in both formative and summative assessment with such tools, we need more empirical evidence about the degree to which teaching quality is comparably stable across content areas. This is the need this study directly addresses.
Our purpose with this paper is not to make claims about whether “good instruction” is content-neutral or content-specific, nor is our goal to analyze the relative strengths of content-generic versus subject-specific measures of teaching. Others have written extensively on these topics (e.g., Hill & Grossman, 2013). Our aim is to provide empirical evidence about the degree to which elementary teachers demonstrate similar profiles of teaching quality depending on the content of instruction, using well-established measures that have been demonstrated to be valid and reliable across multiple subjects (Allen et al., 2011; Ferguson, 2012). The fact that we can reliably use these measures across subjects enables these cross-subject comparisons. We ask the following research questions:
Research Question 1: How much within-teacher variation is there on different measures of instructional quality?
Research Question 2: What is the relationship between teachers’ instructional quality in mathematics and ELA?
Method
Participants
Data were collected during the first year of a two-year observational study of teaching, the MET Project, whose primary aim was to examine existing measures of instructional quality and teacher effectiveness (Kane & Staiger, 2012). The current study includes Tripod survey data from 572 fourth- (n = 288) and fifth-grade (n = 284) classrooms as well as observational data from a smaller subsample of teachers (n = 338). 2 Classrooms were located in five large districts from Colorado, Florida, New York, North Carolina, and Tennessee. Elementary teachers included in the current study were regarded as generalists because they taught all major subjects to their students. The MET study also included 383 elementary specialist teachers, who only taught one subject area (ELA or mathematics) but were excluded from this study because of our interest in cross-subject consistency.
The following descriptive statistics are reported for the sample of 572 fourth- and fifth-grade generalist teachers. The majority of teachers were female (91%), and about half had a master’s degree or higher (55%). Teachers reported an average of 6 years teaching in their current district (SD = 5.65, range, <1–34). The ethnic composition of teachers was 55% White, 39% Black, 5% Hispanic, and <1% other race. Across classrooms, an average of 14% of students were classified English language learner (ELL), 9% were eligible for special education, and 7% identified as gifted. Average ethnic composition in classrooms was 18% White, 51.2% Black, 23%, Hispanic, and 8% other race.
A total of 11,674 students completed ratings of their teachers’ ELA or math instruction. On average, the sample of students was 49% male, 49% Black, 19% White, 24% Hispanic, 6% Asian, and 2% other race. An average of 8% of students qualified for special education, 7% of student qualified for gifted education, 14% were ELLs, and 44% received free or reduced price lunch (FRPL status was only provided for a subset of districts).
Measures
Classroom Assessment Scoring System, Upper Elementary
The CLASS Upper Elementary (Pianta et al., 2012) is designed to assess teacher-child interactions in fourth through sixth grades. It is a structured observation system in which trained observers rate lessons on the emotional tone and climate in a classroom, management of behavior, presence of negativity, amount of time devoted to learning, and facilitation of a deeper understanding of content and analytical thinking. The dimensions consist of positive climate, teacher sensitivity, regard for student perspectives, behavior management, productivity, negative climate, instructional learning formats, content understanding, analysis and problem solving, quality of feedback, instructional dialogue, and student engagement (see online Supplemental Table S2). All dimensions are scored in 15-minute observation cycles using a 7-point scale ranging from low (1–2), to middle (3–5), to high (6–7). In a given cycle, a teacher will receive one score on each dimension.
The CLASS dimensions are then aggregated to form three domains per observation cycle. The emotional support domain consists of the mean of positive climate, regard for student perspectives, and teacher sensitivity. The classroom management domain consists of the mean of negative climate, behavior management, and teacher sensitivity. The instructional support domain is an aggregate of the instructional learning formats, content understanding, analysis and problem solving, quality of feedback, and instructional dialogue dimensions.
Raters were randomly assigned to observation cycles across all participating teachers to mitigate potential effects of rater error. All raters also engaged in calibration activities designed to minimize rater drift each time they began scoring (Harik et al., 2009). Five percent of the videos in the sample were double-coded for interrater agreement (White & Rowan, 2013). The study’s lead researchers deemed the interrater agreement within 1 point (i.e., adjacent agreement ranging from 68%–86% for CLASS MET data) to be acceptable for all the dimensions (Pianta et al., 2012).
Tripod 7Cs Student Perceptions Survey
The Tripod 7C’s survey (Ferguson, 2008) examines students’ perspectives on instructional quality and classroom processes using seven scales: clarify, challenge, captivate, confer, consolidate, control, and care. All 36 items are scored from 1 (no, never) to 5 (yes, always), and each scale is calculated by aggregating the item-level scores. The Tripod total score represents the mean of the seven subscale scores on a given survey. The Tripod overall scored demonstrated high internal consistency across ELA and mathematics (36 items; αELA = .96, αmathematics = .95).
In the current sample, scale-level Cronbach’s alphas ranged from .61 to .91, also suggesting high internal consistency: Clarify (eight items; αELA = .88, αmathematics = .86) measures the teachers’ ability to help students gain a better understanding of the content being taught. Challenge (four items; αELA = .73, αmathematics = .72) measures the rigor of instruction and effort required of students. Captivate (four items; αELA = .81, αmathematics = .78) measures the teachers’ skill at cultivating students’ interest in academic content. Confer (seven items; αELA = .85, αmathematics = .83) assesses teachers’ skill at taking students’ perspectives into account. Consolidate (two items; αELA = .64, αmathematics = .61) measures teachers’ skill at connecting different curriculum topics. Control (four items; αELA = .76, αmathematics = .78) measures a teacher’s ability to manage behavior in a classroom. Care (seven items; αELA = .91, αmathematics = .91) inquires about a teacher’s emotional supportiveness in the classroom (White & Rowan, 2013; see online Supplemental Table S3).
Recruitment and Sampling
Recruitment was conducted through an opportunity sampling procedure; MET researchers targeted large urban districts that had previously worked with the Gates Foundation. The sampling procedure resulted in participation from six large districts. The present study does not include one district, which did not have participating fourth- and fifth-grade classrooms. Within each participating district, school principals identified eligible teachers but did not require teachers to participate. To incentivize participation, each participating teacher received $1,500. Participating schools also received a total of $1,500 as well as $500 per year to pay for a project coordinator. Unique educational settings, such as alternative schools and team-teaching situations in which it would be difficult to link students to one teacher, were excluded.
The present study analyzed data collected during the first year of the MET study (spring 2010). Students were administered the Tripod 7Cs survey between February and June 2010, depending on the schools’ scheduling needs. It is worth noting that students rated their teacher’s instruction in either mathematics or ELA at a single time point in the academic year. The scales measured students’ perceptions of instruction during either ELA or mathematics instruction. Students were randomly assigned to recollect and rate instructional quality in one of the two subjects. The randomization of students to subject ratings was designed to reduce potential bias associated with students’ preferences toward a specific content area and yield an independent set of ratings for each teacher in each subject. One group of students within each teacher’s classroom rated ELA instruction, and a different group of students within the same classroom rated math instruction. On average, 20 students per classroom consented to participate in the study, which resulted in an average of 10 students per classroom completing ELA ratings and 10 students per classroom completing math ratings. An examination of demographic differences in the samples of student raters in mathematics and ELA indicated a slightly higher percentage of students who received special education in the mathematics sample compared to the ELA sample (χ2 = 6.18, p < .05). No other demographic differences were identified between student rater groups (see online Supplemental Table S1 for full demographics).
Classroom video recordings occurred over several months, between February and June 2010. Unlike the Tripod scores, which represent point-in-time perceptions of instructional quality, CLASS scores come from multiple lessons collected over a substantial portion of the school year. During the data collection window, generalist teachers recorded themselves teaching four ELA lessons and four mathematics lessons. For each lesson, only the first 30 minutes of the video were scored (15 minutes per cycle), totaling eight scored CLASS cycles for one subject. Thus, for the 11 dimensions on CLASS, teachers had approximately eight scores on each dimension in ELA and eight scores on each dimension in mathematics, which were analyzed in the current study to determine consistency in quality within and across subjects.
The MET data set is restricted because it contains sensitive and potentially identifying information about school districts. The findings reported in this paper follow the MET secure data reporting policies (Kane & Staiger, 2012).
Data Analysis
The larger sample of participating generalists with Tripod data in the Year 1 elementary sample consisted of 593 teachers. However, 21 of those teachers had incomplete data (i.e., missing mathematics or ELA ratings). Logistic regression analyses were used to determine if classroom and teacher demographics predicted missingness (1 = complete data, 0 = incomplete data). Findings indicated that teachers with incomplete data were more likely to have higher numbers of English language learners in their classrooms (B = −4.70, p < .03) and teachers with complete data were more likely to have students with higher state test scores in mathematics the year prior (B = 5.40, p < .01). No other classroom or teacher demographic variables were predictive of missing Tripod data. Given that the focus of analysis was cross-subject comparison and teachers with incomplete data made up less than 5% of the sample, these teachers were removed from all analyses, bringing the final sample to 572.
To assess within-teacher variability on the Tripod scales and CLASS dimensions in our sample, we first examine ICCs using unconditional models within and across subject areas. Next, given that each teacher received multiple ratings by both students (Tripod) and expert raters (CLASS) in each subject, we estimated a series of multilevel models to predict a teacher’s mathematics and ELA ratings in each CLASS dimension and domain separately for math and ELA and similarly for each of the 7Cs and overall Tripod score separately for math and ELA. The model analyzed is shown in the following:
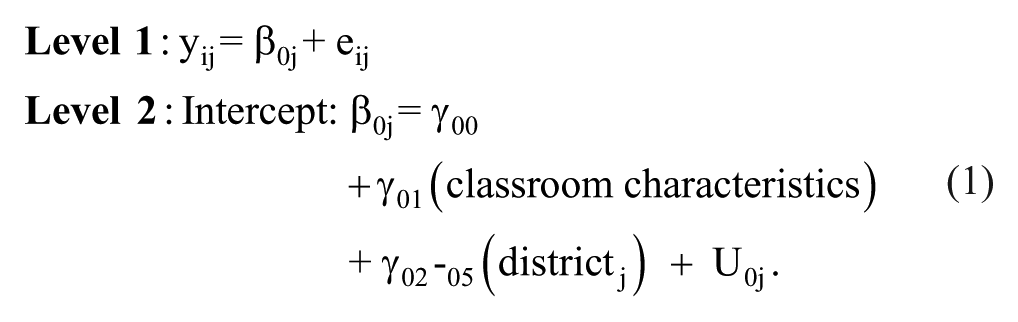
In this model, a single Tripod 7C or CLASS dimension score at Level 1 from student or observer i in the classroom of teacher j (yij) was a function of a residual term. The Level 2 random intercept (β0j) for a teacher’s mean level of the 7C or CLASS dimensions in mathematics or ELA was predicted by a set of teacher-level controls, including aggregate characteristics of students in the classroom—prior achievement levels in mathematics and ELA, racial composition, and gender composition—(γ01), a set of four indicators for the district the teacher was in (γ02–05), and an error term (U0j) assumed to be normally distributed with a mean of 0 and an estimated variance. Separate models were run for each of the CLASS and Tripod dimensions/subscales in each subject area.
To address Research Question 1, we ran unconditional models without predictors from which we estimated the ICC for each CLASS/Tripod dimension. Next, we added the Level 2 predictors indicated in Equation 1 and predicted values of the Level 2 random intercept for each teacher using empirical Bayes prediction. This employs information about the Level 1 and Level 2 error variances and the number of observations within a cluster to predict a teacher’s Level 2 intercept value. In so doing, it corrects for unreliability in the prediction by shrinking predictions toward 0 when the Level 1 residual variance is large, the Level 2 random intercept variance is small, and/or a teacher has a small number of Level 1 observations (CLASS) or student ratings (Tripod).
To address Research Question 2, we correlated the empirical Bayes prediction for math and ELA for a given instrument and dimension (e.g., CLASS Productivity mathematics prediction with the ELA Productivity prediction, Tripod Control mathematics prediction with ELA Control prediction, etc.).
Results
The findings are organized by research question, looking first at the results for the Tripod and then CLASS.
Variation on Measures of Teaching Quality
Tripod scales
Means, ranges, and standard deviations for teachers’ average scores on the Tripod scales are reported by subject area in Table 1. There were comparable distributions of scores in the two subjects on all seven scales. This suggests that across the MET sample of fourth- and fifth-grade generalist teachers, there was similar instructional quality in mathematics and ELA as measured by the Tripod.
Descriptive Statistics for Each Tripod Scale by Subject

Note. N = 572.
Table 1 also shows the ICCs for each of the Tripod subscales in each subject. The ICCs indicate the average amount of variance between teachers in student ratings of a given Tripod subscale. In other words, these metrics demonstrate whether the teachers’ students rate instructional quality consistently in either mathematics or ELA. 3 The ICCs suggest that in mathematics lessons, between 11% and 27% of variation in Tripod subscale scores exists between teachers being rated by students. In ELA observations, between 12% and 26% of subscale score variation exists between teachers being rated by students. Students are most consistent in their ratings of control, which describes how a teacher manages his or her classroom and maintains students’ focus on the topic of instruction (Ferguson, 2012). The comparably high ICC of the Control scale is consistent with prior research using the Tripod; students seem to have more convergent perceptions of the level of control in their classrooms (Ferguson, 2012; Wallace et al., 2016). The care dimension had the next highest ICC, followed by clarify. The other Tripod scales all had ICCs between .11 and .15, which suggest a moderate degree of congruence among the student Tripod subscale ratings and align with other research using the tool.
Table 2 reports within-subject, across-teacher bivariate correlations among Tripod scales, again using teachers’ average scores on each of the seven scales. Across the sample, average within-subject correlations fell within the moderate to high range (rmath = .36–.76; rELA = .38–.81). These scales are correlated with each other, suggesting the distinct Tripod scales capture related constructs within a particular subject. This is also consistent with prior research on the Tripod (Kuhfeld, 2017; Schweig, 2014; Wallace et al., 2016). As such, we also explore the within-teacher cross subject relationship at the overall Tripod score level in the following (see Table 5).
Bivariate Correlations Among Tripod Scales in Mathematics (Above the Diagonal) and English Language Arts (Below the Diagonal)
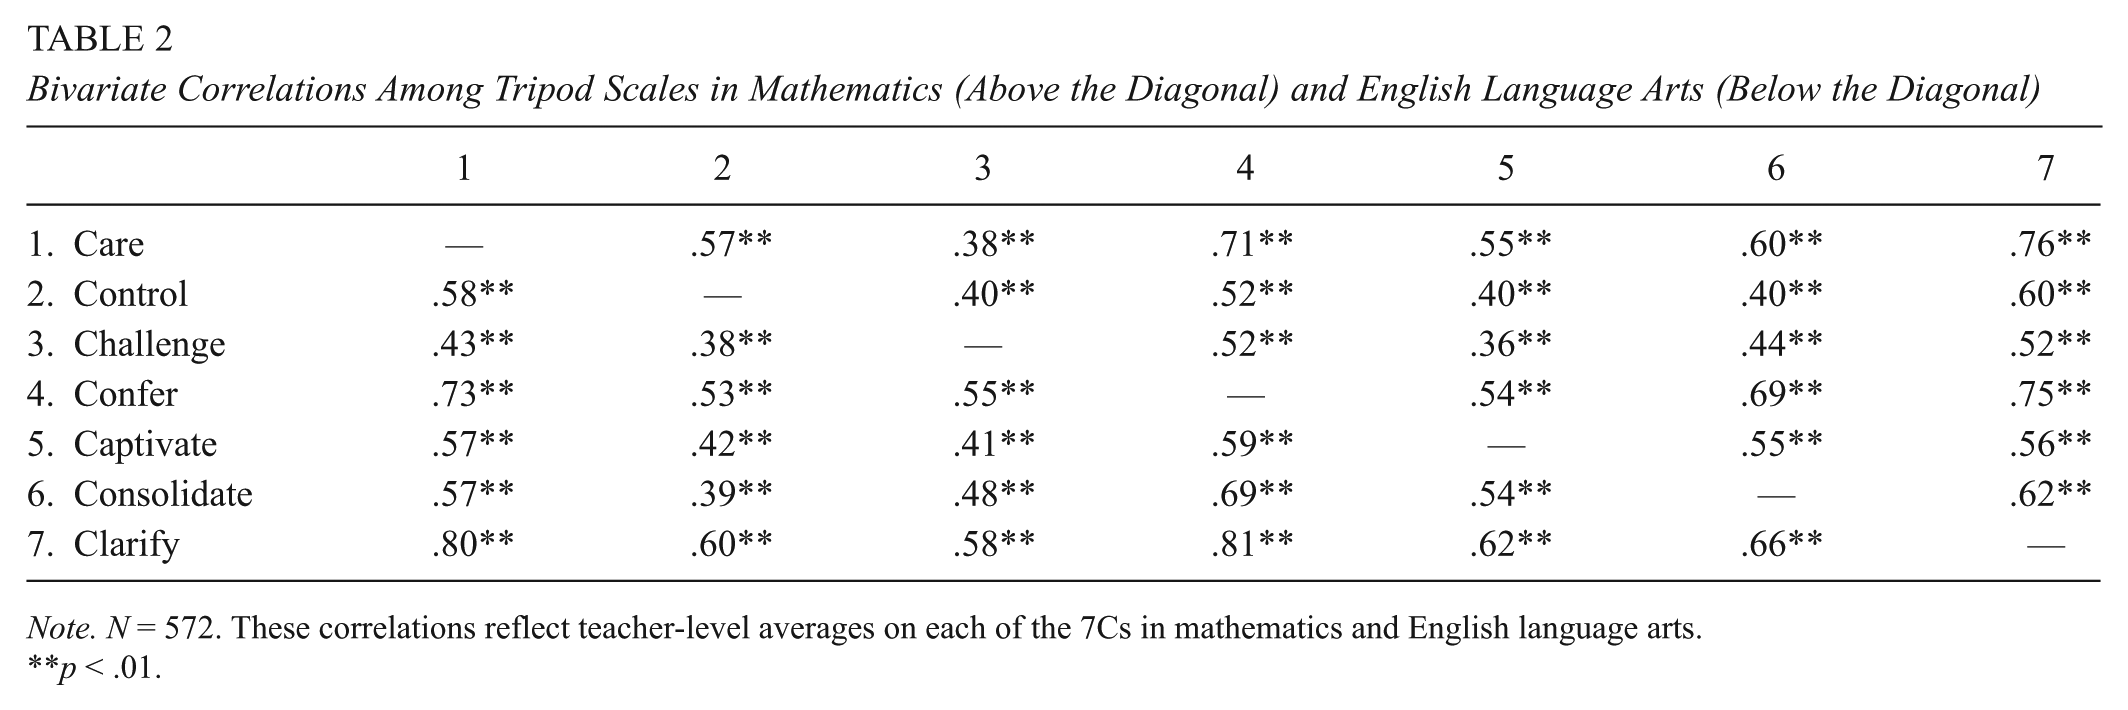
Note. N = 572. These correlations reflect teacher-level averages on each of the 7Cs in mathematics and English language arts.
p < .01.
CLASS dimensions
Means, ranges, and standard deviations for the CLASS dimensions are reported in Table 3. Here too, there are comparable distributions of scores in the two subjects across the MET sample of fourth- and fifth-grade generalist teachers. The descriptive statistics are also comparable to other studies using CLASS (e.g., Allen et al., 2013; Goble & Pianta, 2017).
Descriptive Statistics for Each CLASS Dimension by Subject

Note. N = 338 teachers who had math and English language arts ratings. These correlations reflect teacher-level averages on each of the CLASS dimensions in mathematics and English language arts.
The ICCs for the CLASS dimensions suggest that in mathematics observations, between 9% and 23% of the variation in dimension scores exists between teachers. In ELA observations, between 5% and 22% of the variation in dimension scores exists between teachers. 4 In both subjects, the highest ICC was for behavior management, which is the closest CLASS analog to the Control subscale of the Tripod. Across the two instruments, the largest amount of teacher-level variation is found in those measures that assess a teacher’s efforts to keep student behavior appropriately focused on learning objectives. Positive and negative climate dimensions had the next largest ICCs, suggesting that a reasonable amount of variation in classroom emotional climate is attributable to a particular teacher in a given subject. These ICCs are comparable to other studies using CLASS, albeit on the lower end of the typical range (e.g., Mashburn et al., 2014)
Table 4 reports on the between-teacher bivariate correlations among average CLASS dimensions, which varied widely within subject area (rmathematics = –.61 to .78; rELA = –.65 to .84), with correlations largely falling within the moderate to high ranges. This suggests that some of the CLASS dimensions assess related aspects of the broader construct of instructional quality, which is consistent with a large body of literature using CLASS across thousands of classrooms (Hamre et al., 2013). Given these relatively high correlations, research studies using CLASS often report at the domain level, which aggregates scores across conceptually and empirically related dimensions: emotional support, instructional support, and classroom management (Pianta & Hamre, 2009). As such, we also include domain-level scores in our findings that follow (see Table 6).
Bivariate Correlations Among CLASS Dimensions in Mathematics (Above the Diagonal) and English Language Arts (Below the Diagonal)

Note. N = 338.
p < .01.
Correlations Between Mathematics and ELA Instructional Quality by Instrument
Tripod scales
Table 5 displays the correlations between teachers’ empirical Bayes predictions of their mathematics and ELA student ratings for each of the seven Tripod subscales and the overall Tripod score. These predictions are based on the multilevel models in Equation 1 with a full set of Level 2 control variables for various classroom demographic and achievement characteristics. The correlations are all 0.55 or higher, suggesting that student ratings in mathematics and ELA tend to be moderately consistent across the two subjects a teacher teaches. The largest correlations between mathematics and ELA ratings were found for the Control subscale (r = 0.73) and the Tripod total score (r = 0.67), both of which have emerged as among the most salient aspects of the instrument in measurement research (Kuhfeld, 2017; Wallace et al., 2016).
Empirical Bayes Estimates of Mathematics–English Language Arts Correlation for Tripod
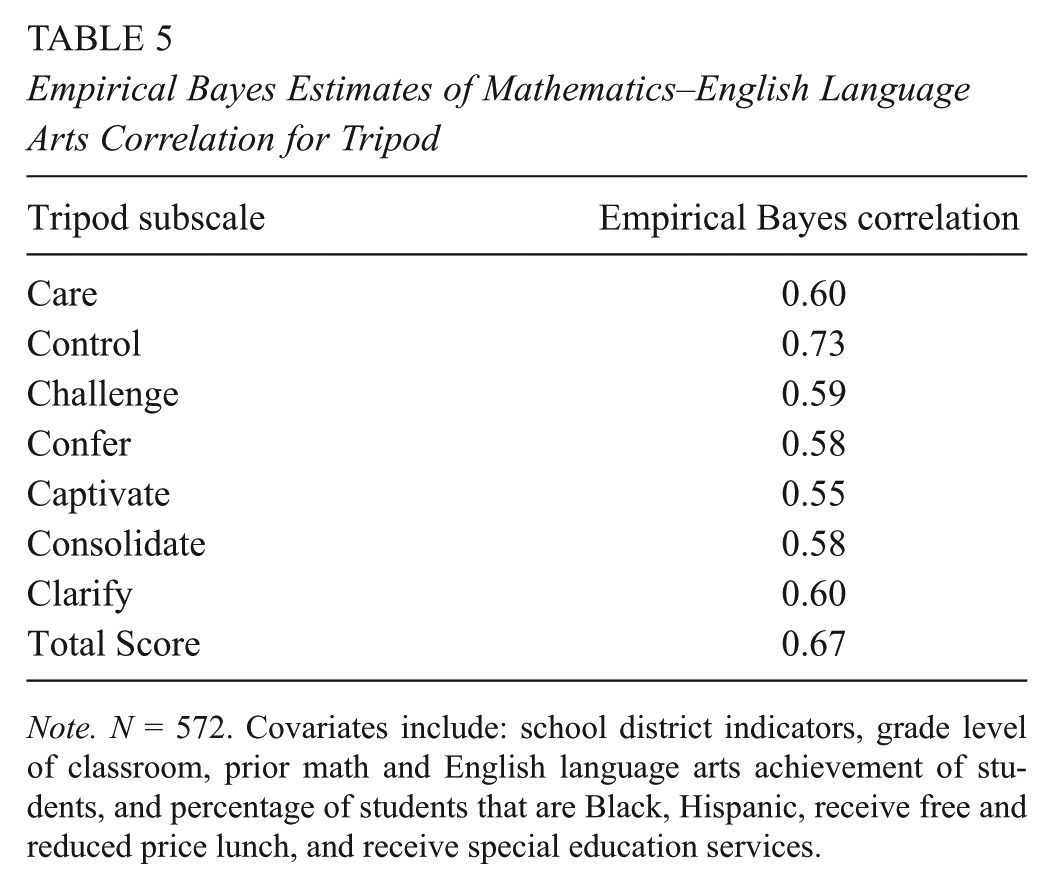
Note. N = 572. Covariates include: school district indicators, grade level of classroom, prior math and English language arts achievement of students, and percentage of students that are Black, Hispanic, receive free and reduced price lunch, and receive special education services.
CLASS dimensions
Table 6 displays the correlations between teachers’ empirical Bayes predictions of their mathematics and ELA ratings for each of the CLASS dimensions and domains. The empirical Bayes predictions are based on multilevel models with the full set of classroom controls. Mathematics and ELA correlations tended to be lowest in the instructional support dimensions (r values between 0.25 for analysis and problem solving and 0.39 for instructional learning formats), next lowest in the emotional support dimensions, and highest in the classroom organization dimensions. That said, there were dimensions in the emotional support and classroom organization domains with lower cross-subject correlations, including regard for student perspectives, which assesses the degree to which a teacher provides opportunities for autonomy and student leadership (r = 0.31), and productivity, which assesses the degree to which instructional time is maximized (r = 0.36). Along the same lines, at the domain level, mathematics and ELA correlations were lower in magnitude for instructional support (r = 0.42) than for emotional support (r = 0.52) and classroom organization (r = 0.55).
Empirical Bayes Estimates of Mathematics–English Language Arts Correlation for CLASS
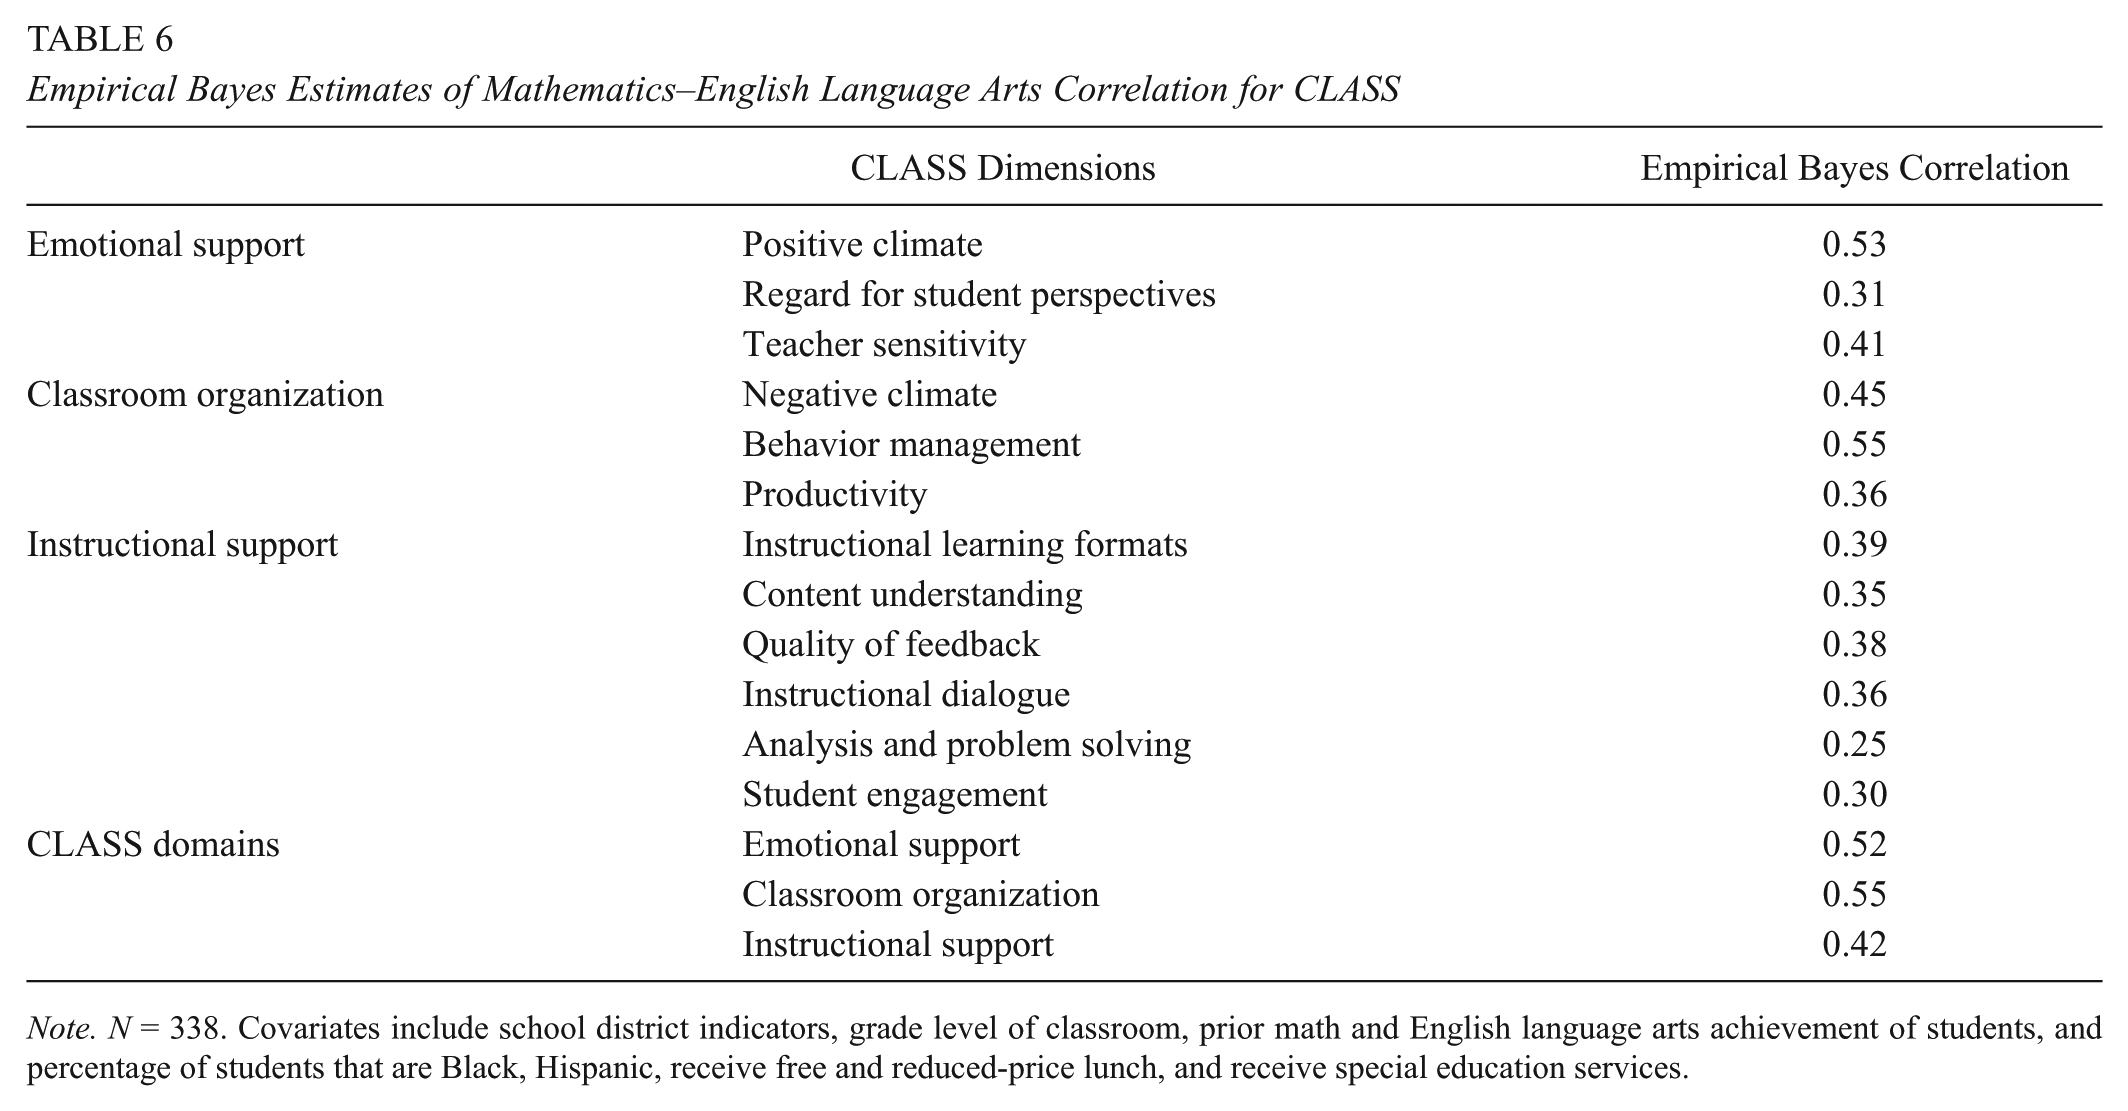
Note. N = 338. Covariates include school district indicators, grade level of classroom, prior math and English language arts achievement of students, and percentage of students that are Black, Hispanic, receive free and reduced-price lunch, and receive special education services.
Discussion
Overall, the findings indicate that there is moderate within-teacher, cross-subject consistency on the Tripod and CLASS. Cross-subject correlations are higher on the Tripod scales (r values from 0.55 to 0.73) than the CLASS dimensions and domains (r values from 0.25 to 0.55). The range of cross-subject correlations on student surveys and observational measures are comparable to those highlighted in the teacher value-added literature (Goldhaber et al., 2013; Loeb & Candelaria, 2012; Loeb et al., 2012; Teh et al., 2013). These findings indicate that some teachers provide comparable instructional quality across subjects, but many do not.
These data also suggest that correlations between teachers’ mathematics and ELA ratings depended in part on the aspect of teaching assessed, the rater scoring instructional quality, and scoring procedures used. Cross-subject correlations were, in general, lower when the raters were trained experts using the CLASS to score multiple lessons over a period of several months than when the raters were students who were asked to make point-in-time evaluations of instructional quality (Tripod). Only 2 of the 12 CLASS dimensions showed correlations between mathematics and ELA greater than 0.5, whereas all correlations between mathematics and ELA Tripod scores were greater than 0.5.
In particular, there were lower cross-subject correlations on the CLASS dimensions measuring features of instructional support, including analysis and problem solving, quality of feedback, content understanding, and instructional dialogue. Student engagement was also less consistent across the two subjects (r = 0.30). Dimensions assessing the affective and organizational tenor of the classroom were more consistent across subjects, including measures of climate (both positive and negative) and behavior management. Little empirical research to date has examined whether these features of elementary classrooms look consistent across subjects, and our findings suggest more work in this area may be merited.
There were stronger cross-subject associations in Tripod ratings of the same teacher, though these too were in the moderate range. The higher correlations make conceptual sense given that in the data collection, students had the difficult task of rating teachers’ practice entirely from recall and mentally separating mathematics instruction from ELA instruction during this recall. The difficulty in making this separation, given students’ exposure to instruction in both subjects, likely contributes to attenuation bias with respect to cross-subject differences in instructional quality. In contrast, CLASS raters had the benefit of rating instruction in real time and in only one subject while being effectively blinded to instructional practice in the other subject, which all but eliminates the potential for the raters’ exposure to a teacher’s mathematics instruction biasing their rating of ELA instruction or vice versa.
These data, particularly the CLASS data, raise questions about the common assumption that teachers who are skilled when teaching one subject are similarly skilled in other subjects. These findings also lend some empirical support to the theoretical ideas proposed by D. K. Cohen et al. (2003). Indeed, given these consistently moderate correlations, classrooms may be different places with distinct features depending on the content of the instruction. Content can indeed serve as context, even when actors are the same (Grossman & Stodolsky, 1994).
Why might we see moderate correlations between empirical Bayes predictions of instructional quality in mathematics and ELA? One hypothesis is that there is a stronger association between “true” instructional quality across subjects but we are not measuring quality well in either subject. All measures are imperfect and prone to measurement error, and observational measures are particularly susceptible to rater error (Park, Chen, & Holtzman, 2014). Indeed, there is considerable evidence in these data (see Tables 1 and 3) that there is substantial within-teacher, within-subject variation across the CLASS dimensions and Tripod scales. The variability both within and across subjects lends support for a major conclusion drawn by the larger MET study: Instructional quality is best understood across multiple measures of instruction (e.g., observations, student ratings, VAMs) to mitigate the impact of measurement error (Kane & Staiger, 2012).
The MET study did attempt to address rater error for observational measures like CLASS in several ways: requiring all raters go through extensive training and certification procedures prior to scoring, mandating raters calibrate with “expert raters” before every scoring session, randomly assigning raters to lessons across teachers and subjects, and requiring a substantial percentage of lessons be double scored to ensure high levels of reliability (Kane & Staiger, 2012). In a practical context, observational measures may be used for consequential decision-making purposes with far fewer precautions in place to reduce systematic rater error (Whitehurst, Chingos, & Lindquist, 2015).
Tripod scores were collected from student raters who might be differentially biased toward the construct of interest, teaching quality, in mathematics or language arts. Students who dislike mathematics might be predisposed to rating instruction lower when recollecting a recent mathematics lesson, which would not reflect the actual quality of the instruction. That said, by randomly assigning a teacher’s students to rate either mathematics or ELA and collecting student surveys from a large number of raters/students, the MET study attempted to minimize the likelihood of subject preferences biasing students’ responses. For subject preferences to bias the results, students who prefer a given subject would have had to be differentially assigned to one subject over the other across all teachers. However, the MET study does not include measures of students’ attitudes or beliefs about particular subjects, making it impossible to test whether or not randomization worked as intended and the group of students rating mathematics instruction were in fact comparable to those rating ELA instruction. Across the two measures, the MET designers’ efforts minimized but did not eliminate the influence of rater error on these findings.
Stable estimates of teaching quality are also predicated on appropriate sampling procedures. We need an adequate amount of information about instruction captured over sufficient time to make broader inferences about quality in a particular subject. In the MET study, only eight lessons were scored (four mathematics, four ELA), and all were captured during a four-month window, often during a timeframe that coincided with high-stakes testing. It is unclear if the instruction observed during this window would generalize across the school year. In addition, if an insufficient number of mathematics lessons or language arts lessons were captured or if different subject lessons were captured at systematically different times during that window, this could bias scores and misrepresent the actual relationship between instructional quality in the two subjects.
In addition, within the lessons captured, only the first 30 minutes of instruction were scored on CLASS. If, for example, mathematics and ELA lessons tend to develop differently, with more opportunities for “analysis and problem solving” or “instructional dialogue” in the beginning of ELA lessons but at the end of hour-long mathematics lessons, then a 30-minute sample would misrepresent the instructional quality in each subject as well as the relationship between the two subjects. Similarly, students rated instructional quality with Tripod surveys at a single timepoint in the year. Given that temporal variation in instructional quality is well documented in prior studies of teaching quality, including those using CLASS (Pianta, Belsky, Vandergrift, Houts, & Morrison, 2008), these are real concerns. As a result, the MET study was designed based on a rigorous time sampling study, which indicated that the sampling parameters used for CLASS scoring would generate reasonably stable estimates of instructional quality (Kane & Staiger, 2012; McClellan, Donoghue, & Park, 2013), and the sampling is consistent with prior research using CLASS (Bell et al., 2012; Curby, Rimm-Kaufman, & Abry, 2013). Similarly, prior research examining student perception ratings have demonstrated high within-year stability (Ferguson, 2010). That said, the substantial within-teacher variability we observe in CLASS scores (see Table 3) suggests temporal issues likely played a role in score variability, along with differences in the subjective perspective of raters.
We know remarkably little about factors that might contribute to consistent practice for elementary school teachers, and these data do not allow us to understand why these elementary teachers demonstrate within- and across-subject differences on some CLASS dimensions and domains and Tripod scales. Individual characteristics such as years of experience (Kane, Rockoff, & Staiger, 2008; Papay & Kraft, 2015) or prior academic achievement (Wayne & Youngs, 2003) might be associated with higher quality in teaching in general. However, there is no evidence or theory to suggest that these returns to experience, for example, would cut across subjects. Elementary teachers may develop at different rates along different trajectories in different subjects contingent on the resources available to them.
Organizational theory and empirical studies suggest school-level factors from leadership to professional development opportunities can also promote or impede teaching quality in particular subjects (Bryk & Schneider, 2002; Ferguson & Hirsch, 2014; Johnson, Kraft, & Papay, 2012; Kanter, 2003; Kraft & Papay, 2014). However, here too, we lack evidence about how particular features of these resources foster development in certain subjects and/or promote consistent practice across subjects. “Resources for teaching” are often for teaching a particular subject (D. K. Cohen et al., 2003). Teacher and student knowledge and beliefs about instruction in a particular subject likely interact with contextual features of the school, shaping the development of instruction in a particular subject. It is important to understand if there are individual or institutional factors that contribute to consistency in teaching, because our goal is uniformly high-quality instruction across a school day. Therefore, continued research examining the relationship between school-level variables and consistency in high-quality practice is warranted.
Study Limitations
In addition to the limitations of the measures themselves, the MET data do not allow for analyses of elementary instruction in subjects other than ELA and mathematics. It is not clear the degree to which these patterns would hold up in these teachers’ science and/or history/social studies lessons. Second, this sample also only includes fourth- and fifth-grade teachers. It is also unclear whether upper-elementary teachers’ practices represent patterns in cross-subject instruction across the elementary grades. Perhaps primary grade teachers, whose students take fewer standardized tests or are subject to fewer accountability pressures, are more likely to integrate curricula into cross-subject units and exhibit more consistent instructional profiles. Third, the districts, schools, and teachers in the MET study are a volunteer sample that may differ from teachers and students in districts nationwide in important ways. Understanding the full range of elementary teachers’ practice in different grade levels, subject areas, and school and district contexts will necessitate additional study.
All Tripod ratings and CLASS-scored videos were collected during a time in the school year that often coincided with the administration of the high-stakes student achievement tests. This may have shaped both the instructional practices used in CLASS-scored observations and student ratings of instructional quality. Teaching quality during this window, measured by students and outside raters alike, may not generalize across the school year. This is an important limitation of the MET database (J. Cohen, 2015; Grossman, Cohen, Ronfeldt, & Brown, 2014).
It is also worth noting that external raters, who do not know these teachers or their school contexts, scored the teachers on the observational measures used in these analyses. There is a growing body of research that suggests that in-school observers such as principals or coaches rate teaching practice differently than outside raters (Bell et al., 2016). Principals tend to rate teaching with more uniformly high scores and rely on organizational demands in scoring (Bell et al., 2016; Kraft & Gilmour, 2016). As a result, they may be less likely to rate teaching practices differently across subjects. Understanding more about the within-teacher, cross-subject consistency of measures of teaching quality in real school contexts is an important direction for future research on elementary teachers (J. Cohen, 2018).
Finally, these analyses do not allow for causal claims about the effects of content on teacher practice. Instead, this is a needed descriptive first step to better understand the degree to which a relatively large and diverse sample of elementary teachers exhibit consistent instructional quality across mathematics and ELA lessons, using well-established valid and reliable measures of teaching quality.
Implications and Directions for Future Research
Policymakers have tended toward teacher evaluation policies that do not often rely on sampling across subjects for elementary teachers. These data suggest that might be misguided given cross-subject correlations on dimensions of CLASS ranging from 0.25 to 0.55. Domain-level CLASS scores are somewhat higher, but still below 0.55. While domain-level scores are more stable and less prone to measurement error, the cross-subject correlations at the dimension level may be more policy relevant because this is most often the level at which schools and districts collect information about practicing teachers. Given that our primary goal with these analyses is to explore whether schools, districts, and teachers would get comparable information about “teacher quality” across subjects using different kinds of measures of instructional quality, it was sensible to align our analytical approach to the ways in which these measures are typically used in formative and summative observation-based evaluation systems around the country (J. Cohen & Goldhaber, 2016; Goldring et al., 2015).
Policymakers and districts alike need to ask whether assessments of teaching in one subject allow for inferences about the quality of teaching in others. If, for example, a teacher is observed and evaluated only or even primarily when teaching language arts, schools and districts may lose crucially important and distinct information about the instructional quality that teacher provides when teaching mathematics. Teachers may be rewarded or sanctioned for instructional quality that is specific to a particular subject rather than more generalizable to their teaching as a whole.
Purposive sampling of instruction in every subject may provide more accurate information about that teacher’s practice. That said, if districts simply average scores on observations conducted across subjects, they may still end up with a distorted portrait of teaching quality. For example, a teacher may score a low-level 2 on the CLASS dimension of instructional dialogue in mathematics lessons while scoring a 7 (the highest CLASS score) in ELA lessons. This teacher’s average would fall in the middle range of the CLASS rubric, a 4.5, which would not reflect the quality of his or her instructional dialogue in either subject. Elementary teachers would also lose important content-specific feedback on their instruction when observations are used in formative ways. Rather than treat elementary school teaching quality as a monolithic construct attributable to individual teachers, districts and schools might be well served to acknowledge and incorporate potential subject specificity and variability of teaching quality into both formative and summative evaluation systems as well as professional development efforts (Hiebert & Stigler, 2017).
Along the same lines, the moderate within-teacher, cross-subject correlations also have implications for research that utilizes student ratings and/or observational measures as outcomes of classroom-based interventions. These findings suggest that subject matter may need to be considered as a key variable in determining equivalence between treatment and control conditions in various randomized control trial studies. These data suggest we may come to different conclusions about the effects of particular interventions on instructional quality if we collect observational or student survey data in mathematics versus ELA.
This within-teacher, cross-subject variability in instructional quality, particularly when assessed over multiple lessons by trained outside raters, lends some empirical support for the current move toward departmentalized elementary classrooms, the structure traditionally used in middle and high schools (Goldhaber et al., 2013; Hess, 2009). If teaching quality is notably different by subject across a range of dimensions, it might be sensible to direct elementary teachers to focus on teaching the subject in which they demonstrate the highest quality instruction. For example, Baroody (2017) examined MET data and found that being an elementary subject-specialist, a teacher who taught only one subject, had a small positive association with higher teaching effectiveness ratings in ELA classes but not mathematics. 5 That said, many elementary educators prefer a self-contained classroom where they work with the same students for the whole school day and have a richer sense of children’s individual needs. There are good developmental reasons for teachers, parents, and students to prefer the self-contained model for young children. More research is needed to better understand the affordances and constraints of moving to a departmentalized model in elementary school.
We also need to understand more about how elementary teachers learn to engage in consistently high-quality teaching across the school day and how and why instructional quality may vary by subject. Theory suggests that less readily quantifiable features of schools, curricula, or teacher preparation might support high-quality instruction across the school day (D. K. Cohen et al., 2003). These are important directions for future research.
Elementary teachers are key resources for understanding the role of content in teaching. They teach multiple subjects but often have differential resources for teaching those subjects. It is not clear what extent divergent experiences with learning to teach different subjects contribute to some of the cross-subject variability in instructional quality we see in these data. Thus, by studying how those experiences and outcomes vary across the same teachers, we will better understand the role of content in the preparation and professional development of elementary school teachers. If some features of teacher education or in-service support are associated with consistently high-quality instruction across content areas, we will be better able to design pre- and in-service programs to capitalize on those commonalities. It could also be especially helpful for elementary teachers to analyze differences in how outside raters score their instructional quality in different subjects and in some cases, how students perceive them across subjects. These kinds of data could spur valuable reflection. Capitalizing on strengths in one subject could serve as motivation to improve on facets of instructional quality in another subject.
If we think it is sensible to emphasize cross-subject pedagogical linkages in elementary teacher preparation and professional development, then those who conduct research on teaching need to support those efforts by engaging in more comparative research analyzing elementary teaching across subjects. It is imperative to build a more robust research base about the factors that contribute to consistent high-quality practice. The subject-specific nature of extant research on teaching has limited opportunities for cross-subject comparisons like these, which are invaluable for understanding the variability of elementary teaching quality. We need to know more about what contributes to within-teacher, cross-subject variability in teaching so that we can improve the consistency of instruction in elementary classrooms.
Supplemental Material
ERO794492_Supplemental_Table__CLN – Supplemental material for Does Teaching Quality Cross Subjects? Exploring Consistency in Elementary Teacher Practice Across Subjects
Supplemental material, ERO794492_Supplemental_Table__CLN for Does Teaching Quality Cross Subjects? Exploring Consistency in Elementary Teacher Practice Across Subjects by Julie Cohen, Erik Ruzek and Lia Sandilos in AERA Open
Footnotes
Notes
Authors
References
Supplementary Material
Please find the following supplemental material available below.
For Open Access articles published under a Creative Commons License, all supplemental material carries the same license as the article it is associated with.
For non-Open Access articles published, all supplemental material carries a non-exclusive license, and permission requests for re-use of supplemental material or any part of supplemental material shall be sent directly to the copyright owner as specified in the copyright notice associated with the article.