
Abstract
This paper uses a validity argument approach to examine the validity evidence for measures of instructional alignment based on an instrument adapted from the Surveys of Enacted Curriculum (SEC). Using the instrument, Grade 4 math and Grade 5 English language arts teachers reported the level of emphasis they gave to subject-specific topics and cognitive demands in their instruction, which provided the data for measuring instructional alignment—both overall and by topic and by cognitive demand—with state standards. We found that (a) teachers differentiated topics but not cognitive demands when reporting on the content of their instruction, (b) teachers likely overreported levels of emphasis on topics and cognitive demands, and (c) overall alignment and alignment by cognitive demand were not significantly associated with teachers’ value-added scores. Although this study examined a specific version of the SEC, we believe the findings apply more broadly to SEC-based measures of instructional alignment.
Keywords
Standards-based reforms have been a core element of state and federal efforts to improve education for the past three decades and continue to occupy the center stage in state and federal education policy arenas. Standards spell out what students should know and be able to do at the end of each grade or course. The specification of challenging student learning standards is intended to drive the content of instruction and student assessment and, ultimately, lead to improved student outcomes (Hannaway, 2003; Porter, 2000). This past decade marked the latest wave of standards-based reforms as states adopted more rigorous standards—so-called college- and career-ready standards—intended to better prepare students for the demands of college and career after high school. A recent study conducted by Song and colleagues (Song et al., 2021), however, found that the adoption of more rigorous standards that has been the foundation of the latest standards-based reform had not yet moved the needle on student achievement based on analyses of National Assessment of Educational Progress (NAEP) data from 1990 to 2017—a conclusion consistent with the conclusion from earlier analyses conducted by Loveless (2014, 2015, 2016) about the impact of the Common Core State Standards, the dominant form of college- and career-ready standards.
One possible explanation for the disappointing results about the impact of standards-based reforms on student achievement is that teachers’ instruction is generally not well aligned to state standards (Polikoff, 2012a, 2012b) and often does not reflect the instructional shifts needed to support students in meeting the demands of new standards (Coburn et al., 2016; Hamilton et al., 2012). Research also suggests that teachers need high-quality standards-aligned curricular materials and professional development (PD) to support them in aligning their instruction to new state standards (Polikoff, 2021). As part of a larger research program on the implementation and impact of college- and career-ready standards, our study team developed the Feedback on Alignment and Support for Teachers (FAST) instructional coaching program to support teachers in better understanding and aligning their instruction to their state’s standards, which is expected to lead to improved student achievement. The 2-year program, which focused on Grade 4 math and Grade 5 English language arts (ELA), used individual coaching sessions and collaborative, grade-level team meetings to discuss the content of the new standards, reflect on ways to improve instructional alignment with standards, and examine resources that could be used to align the content of instruction to state standards.
We used a two-dimensional framework—the Surveys of Enacted Curriculum (SEC) developed by Porter and Smithson (2001)—to examine the content of teachers’ instruction and its alignment with state standards in the FAST program and to assess its impact on instruction. As one of the most widely used instruments for conducting content analysis and assessing alignment, the SEC is designed to describe the content of instruction/standards/assessments at the intersection between specific topics covered and levels of cognitive demand (i.e., expectations for student performance) (Polikoff et al., 2020). Alignment is then measured as the degree of agreement—agreement between instruction and state standards for the FAST program—along both dimensions.
We assessed the impact of the FAST program on teachers’ instructional alignment and student achievement through a school-level randomized controlled trial conducted in 56 elementary schools (29 treatment and 27 control) in five districts in three states. Two of the states had adopted the Common Core State Standards, and one had adopted its own version of college- and career-ready standards. The results about the impact of the program at the end of the 2-year implementation (spring 2019) were perplexing. We found that the FAST program had positive effects on teachers’ instructional alignment in both math and ELA (effect sizes = 0. 70 and 0.40, respectively) and that the effect was statistically significant in math. The program, however, had negative effects on student achievement in both subjects (effect sizes = −0.07 and −0.10, respectively), although only the effect for ELA was statistically significant (Smith et al., 2021, 2022).
This paper presents findings from a validation study prompted by the perplexing findings on the impact of the FAST program, focusing on the validity evidence for SEC-based measures of instructional alignment on which both the FAST program and the FAST impact study heavily relied and that have been commonly used in prior research examining the variation in teachers’ alignment (e.g., Polikoff, 2012a, 2012b; Polikoff & Porter; 2014). The overarching research question for this paper is as follows: To what extent does the alignment index based on the SEC provide a valid measure of teachers’ instructional alignment for use as a teacher outcome in evaluating teacher PD programs?
To address this research question, we use a validity argument approach, first described by Kane (1992, 2006, 2013) and subsequently used in other studies that examine validity evidence for tests or other rating instruments (e.g., Bell et al., 2012; Schilling & Hill, 2007). Following this approach, we first specify an interpretive argument, laying out five assumptions that should be met if the alignment index provides a valid measure of teachers’ instructional alignment to state standards, for use as a teacher outcome in evaluating teacher PD programs. We then empirically examine the evidence supporting three of these assumptions by assessing whether teachers can accurately report their instructional emphasis by topic and cognitive demand, whether it is appropriate to measure alignment based on proportional emphasis given the observed distribution of emphasis across topic-and-cognitive-demand pairs reported by teachers and that reflected in state standards, and whether teachers’ alignment scores are positively associated with student learning. We did not examine the evidence for the other two assumptions: (a) that the topics and cognitive demands in the SEC cover both the content included in state standards and the content that teachers could plausibly cover in their instruction and (b) that expert raters can accurately characterize the content of state standards according to the topic and cognitive demands included in the SEC. The first of these assumptions is clearly met given the procedures used to construct the version of the SEC used in the study, and we lack empirical data to investigate the second assumption. Before introducing the interpretive argument and validity evidence, we review prior research on instructional alignment and describe the calculation of the SEC-based alignment measure used in this study.
Prior Research on Instructional Alignment
The success of standards-based reforms hinges on the alignment between the intended curriculum (state standards), the enacted curriculum (what is taught), and the assessed curriculum as measured by state tests (Porter & Smithson, 2001). Much of the early research on alignment focused on the alignment between content standards and state assessments (Case et al., 2004; Martone & Sireci, 2009). As noted by Porter (2002) and Polikoff (2021), however, teachers ultimately are the decision makers regarding what is taught to students. Therefore, to understand the impact of standards-based reforms on student learning, one also needs to understand what is taught to students and how the content of instruction aligns with standards.
Porter and Smithson (2001) argue that instructional coverage depends on both the topics covered and the level of cognitive demand at which the content is taught. The SEC is designed to describe instructional content at the intersection of these two dimensions. To complete the SEC, teachers report on the focus of their instruction in terms of topics addressed and cognitive demands emphasized. The topics and cognitive demands in the SEC typically cover those found in K–12 state standards. The features of the SEC response scales have changed somewhat over time, but generally teachers report on the time spent on each topic and then indicate the level of emphasis given to each cognitive demand for that topic. Relative emphasis can then be computed as the proportion of the total content for a given topic-and-cognitive-demand pair over a semester or school year (Polikoff et al., 2020).
In addition to analyzing the content of instruction, the SEC framework can also be used to code the content of standards and assessments, focusing on describing the relative emphasis on different topic-and-cognitive-demand pairs in a set of standards or assessments. A measure of the extent of alignment between instruction and standards or assessments (i.e., “an alignment index”) can then be calculated by comparing the SEC codings of the content of instruction and the content of standards or assessments (Polikoff et al., 2020; Porter, 2002). 1
Although the SEC was created two decades ago, there is limited research on the validity of alignment measures based on the SEC when used to evaluate teacher PD programs or for other purposes or on the psychometric properties of the measures. One body of research focuses on the ability of raters to appropriately and reliably categorize the content of standards and assessments using the SEC. Porter et al. (2008) found that with at least four raters, the reliability coefficients for coding both standards and assessments with the SEC was between 0.8 and 0.9, suggesting strong reliability with the caveat that the study included data for only two states. Studies have also examined the reliability of ratings of test items using other related frameworks (e.g., D’Agostino et al., 2008; Webb et al., 2007). In a review of studies examining rater reliability, Traynor (2014) indicates that a number of studies have noted the difficulty of classifying content and tasks by cognitive demand. For example, in Sireci et al.’s (2000) study of the NAEP science assessment, 85% of the items examined were correctly classified by field of science, compared with 60% for cognitive area.
Few studies have examined the ability of teachers to accurately describe the content of their instruction based on both topics and cognitive demands using a survey. Porter et al. (1993) administered a questionnaire designed to assess high school math and science teachers’ emphasis on instructional content by both topic and cognitive demand. They also had teachers fill out weekly instructional logs over the course of a school year to obtain “true” measures of emphasis on instructional content by topic and cognitive demand. They then calculated the correlations of instructional emphasis between measures based on the logs and the questionnaire. They found that correlations by topic were quite strong for broad topic categories in both math and science, but correlations for cognitive demand were weaker. Additionally, Polikoff et al. (2020) calculated alignment values comparing SEC-based end-of-semester surveys with aggregated teacher logs and found that teachers’ alignment between surveys and logs was 0.44 in math and 0.57 in ELA. The same study showed that teachers reported a nonzero level of emphasis across fewer topic-and-cognitive-demand pairs in the survey compared with the logs, suggesting that teachers underreported cognitive-demand coverage on the survey compared with logs. Both studies assume that logs provide more accurate measures of instructional content than surveys because they cover smaller and more proximal time periods, even though the accuracy of log data also relies on teachers’ ability to accurately record the content of their instruction by both topic and cognitive demand.
Research on the relationship between instructional alignment as measured by the SEC and student achievement has been limited, with inconsistent results. An early study using a SEC-based measure of alignment found marginally significant (p < .10) positive effects of aligning instruction to the test content on test performance in 48 high school math classes (Gamoran et al., 1997). Specifically, it found that without controlling for content coverage (alignment), students in higher-level math courses performed statistically significantly better than those in lower-level courses. After accounting for content coverage, differences in performance across different levels of math courses were diminished. Citing the results from this study, Porter (2002) argues that measures of instructional alignment using the SEC are valid to the extent that they predict achievement and advocate for expanded use of such measures in future research. Porter (2002) also reports that analyses of the data from the Gamoran et al. (1997) study indicate that one-dimensional measures of alignment by either topic or cognitive demand were not as predictive of achievement as alignment measured at the intersection of topics and cognitive demands. A more recent survey with a larger number of teachers, however, did not find statistically significant associations between instructional alignment to standards and teacher value-added scores in elementary and middle school math and ELA (Polikoff & Porter, 2014).
Given the wide use of the SEC in research on alignment and given the limited and inconsistent research evidence on its validity, there is clearly a need for further research examining the validity evidence for alignment measures based on the SEC and on potential ways to refine the measures. Building on prior work, the study presented here assessed the validity evidence for SEC-based alignment measures, as described next, with analyses of relevant data from the FAST impact study.
The Measurement of Instructional Alignment
Teacher instructional alignment in the FAST study was assessed using data from the online Instructional Survey developed by the study team based on the SEC and administered to all study teachers in spring 2018 and 2019. At each administration, teachers reported on their instruction for the current school year. As part of the FAST program development process, we learned that versions of the SEC used in prior studies would not provide sufficiently detailed information to use in the FAST program. As a result, we revised the SEC topics to focus on the topics within the grade bands surrounding the target grades of the FAST program (i.e., Grades 3 to 5 for math and Grades 4 to 6 for ELA). We also reduced the grain size of the remaining topics as appropriate for the FAST study. The resulting surveys contained 126 topics and four cognitive demands for math and 95 topics and three cognitive demands for ELA, creating 504 and 285 topic-and-cognitive-demand pairs in total for math and ELA, respectively.
In addition, instead of asking teachers to first report on the time spent on a given topic and then report the level of emphasis given to each cognitive demand for that topic as in the original SEC, we asked teachers to report the level of emphasis given to each topic-and-cognitive-demand pair, using a scale from 0 (no emphasis) to 6 (major emphasis). (See Figure 1 for a sample page from the FAST Instructional Survey.) We then converted the reported emphasis for each topic-and-cognitive-demand pair to a “proportion of emphasis” by dividing the reported emphasis for the pair (on the 0-to-6 scale) by the sum of the reported emphasis (points) across all pairs in the survey (Smith et al., 2022).

A sample page from the Instructional Survey used in the Feedback on Alignment and Support for Teachers impact study.
To determine the emphasis given to each topic-and-cognitive-demand pair found in the state standards, three experts in math or ELA content and teaching and learning independently identified the topic-and-cognitive-demand pairs reflected in each Grade 4 math or Grade 5 ELA standard in the three study states. They then met to resolve discrepancies in their coding, creating the final counts of standards covering each topic-and-cognitive-demand pair in each study states. This method of coding standards differed from the typical way of coding standards for the SEC, which usually involves assigning equal weight to each standard and using the average of the raters’ codes to determine the level of emphasis given to each topic-and-cognitive-demand pair reflected in the standards. These procedures were modified for the FAST study to be consistent with the ways in which teachers thought of the standards and coaches were expected to coach on instructional alignment. First, teachers tended to spend more time on standards that included more content. Therefore, we gave equal weight to each topic-and-cognitive-demand pair rather than each standard. Second, to support teachers in aligning their instruction to state standards, coaches needed a definitive set of “master codes” for each standard, not several sets of codes generated by multiple raters that may not agree (Polikoff et al., 2020; Smith et al., 2022). Although the method of coding state standards in this study differed from that typically used in prior studies, the way we calculated emphasis in the standards based on the coding is consistent with what has been typically done. In particular, we converted the emphasis given to a specific topic-and-cognitive-demand pair within a set of standards to a proportion by dividing the number of standards reflecting the specific topic-and-cognitive-demand pair by the total number of standards reflecting any of the topic-and-cognitive-demand pairs specified in the FAST Instructional Survey.
An overall alignment index with a value between 0 and 1 was calculated by comparing the emphasis on a given topic-and-cognitive-demand pair as reported by a teacher and the emphasis on the same pair in the state standards across all topic-and-cognitive-demand pairs included in the FAST Instructional Survey. The index is defined as follows (Porter, 2002):

where yj is the proportion of emphasis that a teacher reported spending on topic-and-cognitive-demand pair j and xj is the proportion of emphasis given to the corresponding pair in the state standards. The overall alignment index was calculated based on the values of yj and xj across the n topic-and-cognitive-demand pairs included in the Instructional Survey. An alignment index of 1 indicates perfect alignment between teacher-reported instruction and the state standards, and an alignment index of 0 indicates a complete lack of alignment, which occurs when none of the topic-and-cognitive-demand pairs emphasized by the teacher are covered by the state standards. This method for calculating alignment based on the SEC is common and has been used in many studies of both instructional alignment and alignment of assessments or instructional materials over the past decades (see, e.g., Fulmer, 2011; Gamoran et al., 1997; Liu & Fulmer, 2008; Ma et al., 2013; Polikoff, 2012a, 2012b; Polikoff et al., 2020; Polikoff & Fulmer, 2013; Traynor, 2014). We recognize, however, alignment index values other than 0 and 1 do not have a straightforward interpretation. A value between 0 and 1 can be interpreted as the degree of overlap in the proportion of emphasis teachers and state standards give to the same topic-and-cognitive-demand pairs. However, we lack a conventional definition of high or low alignment as measured by the alignment index, and alignment values are sensitive to the number of topic-and-cognitive-demand pairs included in the SEC (Fulmer, 2011; Polikoff & Fulmer, 2013). Therefore, we also created a standardized version of the alignment index based on the mean and standard deviation of teachers’ alignment index values to facilitate the interpretation of the results from some of the analyses examining the validity evidence for the alignment index.
In addition to the overall alignment index, we also created separate measures of instructional alignment to calculate alignment according to topics and to cognitive demands (rather than the intersection of topic and cognitive demand). The topic alignment index captures the extent to which a teacher’s instruction was aligned with state standards in terms of emphasis allocated to different topics, regardless of the cognitive demands emphasized within the topics. Specifically, to calculate the topic alignment index, we simply summed the reported proportions of emphasis across all topic-and-cognitive-demand pairs for each topic to calculate the total emphasis for both teachers and state standards by topic. We then calculated the topic alignment index in the same way as we calculated the overall alignment index using Equation 1. Similarly, the cognitive demand alignment index captures the extent to which a teacher’s instruction was aligned with state standards in terms of emphasis on different cognitive demands, regardless of the topics emphasized within the cognitive demands. We calculated the cognitive demand alignment index by summing proportions of emphasis across all topic-and-cognitive-demand pairs within each cognitive demand and then applying Equation 1 to the summed proportions by cognitive demand. (See Appendix A in the supplemental material for descriptive statistics and reliability information for the alignment measures.)
The Interpretive Argument for the Validity of SEC-Based Alignment Measures
The validity of SEC-based measures of instructional alignment for use as a teacher outcome measure in evaluating teacher PD programs rests on five assumptions, which are shown in Figure 2 and discussed next.

Assumptions of the interpretive argument.
The first assumption is that the topics and cognitive demands in the SEC cover the content included in the state standards as well as the content that teachers could plausibly cover in their instruction. Prior to the FAST study, a team of content experts was assembled to review the expectations for student learning outlined in new college- and career-ready standards and revise the SEC to include the topics and cognitive demands emphasized in those standards (see Smith et al., 2022, for a discussion). Therefore, for the purpose of this paper we presume this assumption was met and did not investigate it further.
The second assumption is that expert raters can accurately characterize the content of the state standards according to the topics and cognitive demands included in the SEC. As discussed previously, findings related to this issue from prior research have been mixed. Therefore, this could be a reasonable threat to validity. However, we have no basis to investigate this assumption empirically using our data. Therefore, we do not investigate this assumption in this paper.
We did investigate the remaining three assumptions, which could be examined with the data from the FAST impact study. The third assumption is that teachers can accurately describe the content emphasized in their instruction by topic and cognitive demand. A few studies have examined this issue by comparing survey responses describing content of instruction to log responses (e.g., Polikoff et al., 2020; Porter et al., 1993). These studies pointed to possible challenges in teachers’ reporting of cognitive demand.
The fourth assumption is that the agreement of teachers’ instruction with standards can be defined as the extent to which teachers and the standards agree in the proportional emphasis they give to topics and cognitive demands. There is currently little evidence from prior research regarding this assumption.
The final assumption concerns the relationship between alignment and student learning. The fundamental premise of standards-based reform posits that if teachers align their instruction to the standards, then student assessment scores should improve (where assessments are also aligned to standards). Therefore, a positive relationship between the SEC-based measure of instructional alignment and student assessment scores would provide validity evidence for the alignment measure. As discussed earlier, there is mixed evidence regarding this assumption in prior research (Gamoran et al., 1997; Polikoff & Porter, 2014).
Validity Evidence
In this section, we lay out the validity evidence related to the final three assumptions specified in our interpretive argument for the validity of SEC-based alignment measures for use as teacher outcomes in evaluations of teacher PD programs, drawing on data collected from 135 Grade 4 math teachers and 93 Grade 5 ELA teachers in the FAST impact study sample who were present in FAST study schools in the spring of either of the two intervention years and for whom we were able to measure alignment and had student outcome data. For each assumption, we briefly describe the analytic approach taken and then present the findings. Appendix B in the supplemental material contains information on the characteristics of the teachers and their students in the study sample.
Assumption 3: The Accuracy of Teachers’ Reported Instructional Content
The accuracy of reporting of instructional content by both topic and cognitive demand through a survey is at the heart of whether SEC-based measures of alignment provide a valid description of teachers’ instructional alignment. Assessing the accuracy of teachers’ reports is challenging, because we lack an objective “gold standard” measure of the content of instruction over a full year with which to compare teachers’ self-report. Therefore, we examined the patterns of teachers’ responses on the SEC for evidence that might support or call into question the accuracy of teachers’ reported instructional content with three types of analyses as described next.
Analysis 3.1: Descriptive Analysis of Emphasis by Topic and Cognitive Demand
Our first analysis examining Assumption 3 is a descriptive analysis motivated by our expectation that the pattern of instructional emphasis by topic or cognitive demand as reported by teachers in the FAST study should generally mirror the pattern in state standards and that those teachers would differentiate different topics and cognitive demands in their reporting. For this analysis, we calculated the average reported emphases of teacher instruction by topic and cognitive demand. The results show that there was variation in teachers’ average instructional emphasis across topic categories (aggregations of fine-grained topics), and this variation generally mirrors the differences in emphasis in the state standards. Cognitive demands, in contrast, were emphasized roughly equally, on average, by teachers, and this was not the case with state standards. These results support the notion that teachers may have accurately reported instructional emphasis by topics but not by cognitive demand. (See Appendix C in the supplemental material for further details about this analysis and results.)
Analysis 3
2: Differentiation of Instructional Emphasis Within Topics or Cognitive Demands.
The second analysis examining Assumption 3 was motivated by our expectation that teachers’ instructional emphasis would vary across topics and cognitive demands. In this analysis, we examined the extent to which teachers (a) differentiated different topics for a given cognitive demand and (b) differentiated different cognitive demands for a given topic. We reasoned that lack of differentiation of cognitive demands within topics may offer evidence that teachers did not understand the cognitive demands or did not carefully recall and accurately report the extent to which they emphasized different cognitive demands for each topic.
To assess the extent to which teachers differentiated cognitive demands for a given topic, we assessed the variation in instructional emphasis across cognitive demands within topics for each teacher using the following formula:

where ytc is the proportion of emphasis for topic t and cognitive demand c,
To provide a point of reference, we conducted parallel calculations using the emphases contained in the state standards. We then divided the value of V for each teacher by the corresponding value for the standards applicable to the teacher. The resulting ratio describes the extent to which a teacher’s differentiation across cognitive demands within topics or across topics within cognitive demands agreed with the amount of differentiation found in the state standards. A value of 1 indicates that the differentiation in teachers’ responses across cognitive demands within topics or across topics within cognitive demands was equivalent to the differentiation found in the state standards. Values less than 1 indicate less differentiation in teachers’ responses compared with state standards. For example, a value of 0.1 indicates that the differentiation in teachers’ responses was 10% of the differentiation found in state standards.
Figure 3 shows the distributions of teachers’ differentiation of instructional emphasis within topics and within cognitive demands relative to the differentiation in state standards. In the figure, the dashed vertical line at 1 signifies the expected amount of differentiation according to state standards. The figure shows that almost all teachers differentiated their reported instructional emphasis less than the state standards. Specifically, the differentiation across cognitive demands within topics was at or near 0 for many teachers, meaning that these teachers distributed their reported emphasis evenly across the set of cognitive demands within a given topic.

Distribution of teachers’ differentiation across cognitive demands within topics and across topics within cognitive demands, relative to state standards.
Teachers’ reported differentiation across topics within cognitive demands was also well below what is dictated by the state standards but generally higher than their differentiation across cognitive demands within topics. Thus, in addition to spreading their emphasis evenly across cognitive demands overall (averaged across all topics), teachers generally emphasized cognitive demands evenly within individual topics. Although we do not know teachers’ “true” instructional emphasis across cognitive demands, this finding suggests that teachers may not have carefully considered and accurately reported the extent to which they differentiated among cognitive demands in their instruction (similar to a student who answers “C” on every item on a multiple choice test).
Analysis 3
3: Comparison of Teachers’ Survey Responses With Simulated Random Responses About Instructional Content Coverage.
Our third analysis addressing Assumption 3 was motivated by the reasoning that if teachers were able to accurately describe the content of their instruction (under the expectation that most teachers’ instruction is at least somewhat aligned to state standards), then we would expect our measures of teachers’ instructional alignment to have higher values than measures calculated based on randomly reported levels of emphasis on the SEC (i.e., measures entirely consisting of noise). To test this hypothesis, we compared the alignment measures obtained from the FAST study with randomly generated alignment measures that assume teachers select each 0-to-6 response with a uniform (1/7) probability. In this investigation, we considered the alignment measures based on randomly simulated data as providing reasonable lower-bound estimates of teachers’ true alignment scores, as the theoretical minimum value of the alignment index (0) is highly unlikely to occur in reality. By chance, teachers are likely to report emphasizing some of the topic-and-cognitive-demand pairs that are covered by the state standards, leading to a nonzero estimate of the alignment index.
Specifically, we created 1,000 simulated teachers and assigned them to the five study districts proportional to the number of study teachers from each district. Assigning teachers to districts was necessary because the calculation of alignment relies on comparing the proportion of emphasis given to each topic-and-cognitive-demand pair by each simulated teacher with the proportions of emphasis found in the actual standards for the simulated teacher’s state. For each simulated teacher, we filled out the FAST Instructional Survey by selecting a random response for each topic-and-cognitive-demand pair, assuming the level of emphasis was uniformly distributed over the seven potential values (0–6), as was generally the case with teachers’ responses to the FAST survey (shown in the following subsection). We used kernel density plots to visually examine the distribution of teachers’ actual alignment scores and the distribution of alignment scores based on simulated data. We then conducted Kolmogorov-Smirnov tests to determine whether the distribution of teachers’ actual alignment scores differed statistically significantly from that based on simulated data. In addition, we used t tests to examine whether the average of teachers’ actual alignment scores differed from the averages based on simulated data.
Figure 4 displays the distribution of teachers’ actual alignment index values and the alignment index values based on randomly simulated data, where all alignment index values are in the standardized metric with a mean of 0 and standard deviation of 1. As shown in Figure 4, for a large portion of teachers in both math and ELA, their actual cognitive demand alignment indices fell within the range of where they would be expected to score had they selected their emphasis levels at random when responding to the instructional survey. For ELA, in particular, the average cognitive demand alignment index based on the actual teacher survey data was not statistically significantly different from the average based on simulated data, and the Kolmogorov-Smirnov test was not statistically significant at the 5% level, indicating that the alignment by cognitive demand based on ELA teachers’ report was no different, on average, than the alignment we would have observed had the teachers randomly filled out the instructional survey.

Distributions of alignment indices as reported by teachers versus distributions based on randomly simulated data.
In contrast to the distributions of cognitive demand alignment, the distributions of teachers’ topic alignment for both math and ELA are clearly shifted to the right of the topic alignment distributions based on randomly simulated data, indicating that most teachers’ topic alignment was higher than what it would have been had they randomly selected their responses to the FAST survey. The distributions of teachers’ actual overall alignment were also clearly to the right of the distribution based on randomly simulated data for both subjects. However, the difference between overall alignment distributions based on actual data and simulated data appears greater in math than in ELA. For ELA, there was a sizable overlap between the distribution of teachers’ actual overall alignment indices and the distribution based on simulated data. This final analysis contributes additional evidence that teachers may not have accurately reported their instructional emphasis by cognitive demand, which raises questions about the validity of the overall alignment index based on teachers’ self-report.
Assumption 4: Defining Alignment as Agreement in Proportion of Emphasis
The fourth assumption concerns the appropriateness of defining alignment as agreement in proportional emphasis by topic-and-cognitive-demand pair between the state standards and teachers’ reported instructional content. To investigate this assumption, we conducted two analyses comparing the distributions of levels of emphasis based on teachers’ report and those based on expert coding of state standards.
Analysis 4.1: Distribution of Levels of Emphasis
First, we compared the distribution of topic-and-cognitive-demand pairs for the state standards and for teachers’ reports of instruction on the SEC. For state standards, each standard was coded as reflecting one or more topic-and-cognitive-demand pairs, and a count of the number of related standards was generated for each pair. For both math and ELA, a maximum of 11 standards were coded as reflecting a single topic-and-cognitive-demand pair. Therefore, for standards, the level of emphasis on a specific topic-and-cognitive-demand pair ranged from 0 to 11. In contrast, for teacher instruction, the level of emphasis on a specific pair was measured with the 0-to-6 survey response options.
Perhaps as a result of the differences in scales, the distribution of level of emphasis across topic-and-cognitive-demand pairs is quite different for teachers and the standards. Table 1 displays the percentage of topic-and-cognitive-demand pairs receiving a given level of emphasis (0–6) based on teachers’ report and the percentage of topic-and-cognitive-demand pairs receiving a given level of emphasis (0–11) in state standards based on expert coding of the standards. For math, 82.0% of topic-and-cognitive-demand pairs included in the FAST Instructional Survey received no emphasis at all in the state standards across the five study districts. That is, these pairs were not coded as reflecting any of the state standards. Grade 4 math teachers, however, indicated that only 26.8% of topic-and-cognitive-demand pairs received zero emphasis in their teaching. The distributions also differed with respect to the upper end of the scale. In math, only 1.2% of the topic-and-cognitive-demand pairs were each coded as reflecting three or more standards, whereas teachers used response options 3 to 6 for more than 60% of the pairs examined, with response option 6 selected for 21.5% of the pairs.
Percentage of Topic-and-Cognitive-Demand Pairs Receiving Different Levels of Emphasis Based on Expert Coding of State Standards and Teacher Report

Note. The percentage of topic-and-cognitive-demand pairs associated with a given number of standards across all districts was weighted by the number of teachers in the sample from each district. The FAST Instructional Survey included 504 topic-and-cognitive-demand pairs for Grade 4 math and 285 pairs for Grade 5 ELA. ELA = English language arts.
Table 1 shows a similar pattern for ELA. Almost 70% of topic-and-cognitive-demand pairs received zero emphasis in the state ELA standards across the study districts. ELA teachers, however, reported that only 17.7% of topic-and-cognitive-demand pairs received zero emphasis in their instruction. On the upper end of the emphasis scale, for the state standards, only 5.9% of topic-and-cognitive-demand pairs were coded as being covered by at least three standards, whereas ELA teachers collectively used survey response options 3 to 6 for almost 70% of the topic-and-cognitive-demand pairs.
Analysis 4.2: The Conversion of Levels of Emphasis to Proportions
The differences in distributions revealed in Analysis 4.1 led to substantial differences when the levels of emphasis for topic-and-cognitive-demand pairs were converted to proportions. The proportional emphasis on each pair is a function not only of the emphasis for the pair but also of the sum of the emphases across all pairs, which depends heavily on the number of pairs given more than zero emphasis. For the standards, relatively few pairs received any emphasis, and as a consequence, the proportional emphasis for these pairs was high. For the teachers, however, because most pairs received at least some emphasis, the proportional emphasis was relatively low, even for pairs that received emphasis at the upper end of the scale. For example, as Table 2 illustrates, for an average math teacher in this study, even for a topic-and-cognitive-demand pair receiving the highest level of emphasis (6) in their instruction, the proportion of emphasis on that pair based on the teacher’s report is only 0.38%, indicating that a pair receiving an emphasis of 6, the maximum possible, received less than 1% of the total instructional emphasis. On the other hand, for the math standards, a pair receiving the maximum emphasis of 11 received 8.1% of the total emphasis.
Relative/Percentage Emphasis on a Topic-and-Cognitive-Demand Pair in State Standards and Based on the Report of an Average Math Teacher, by Level of Emphasis
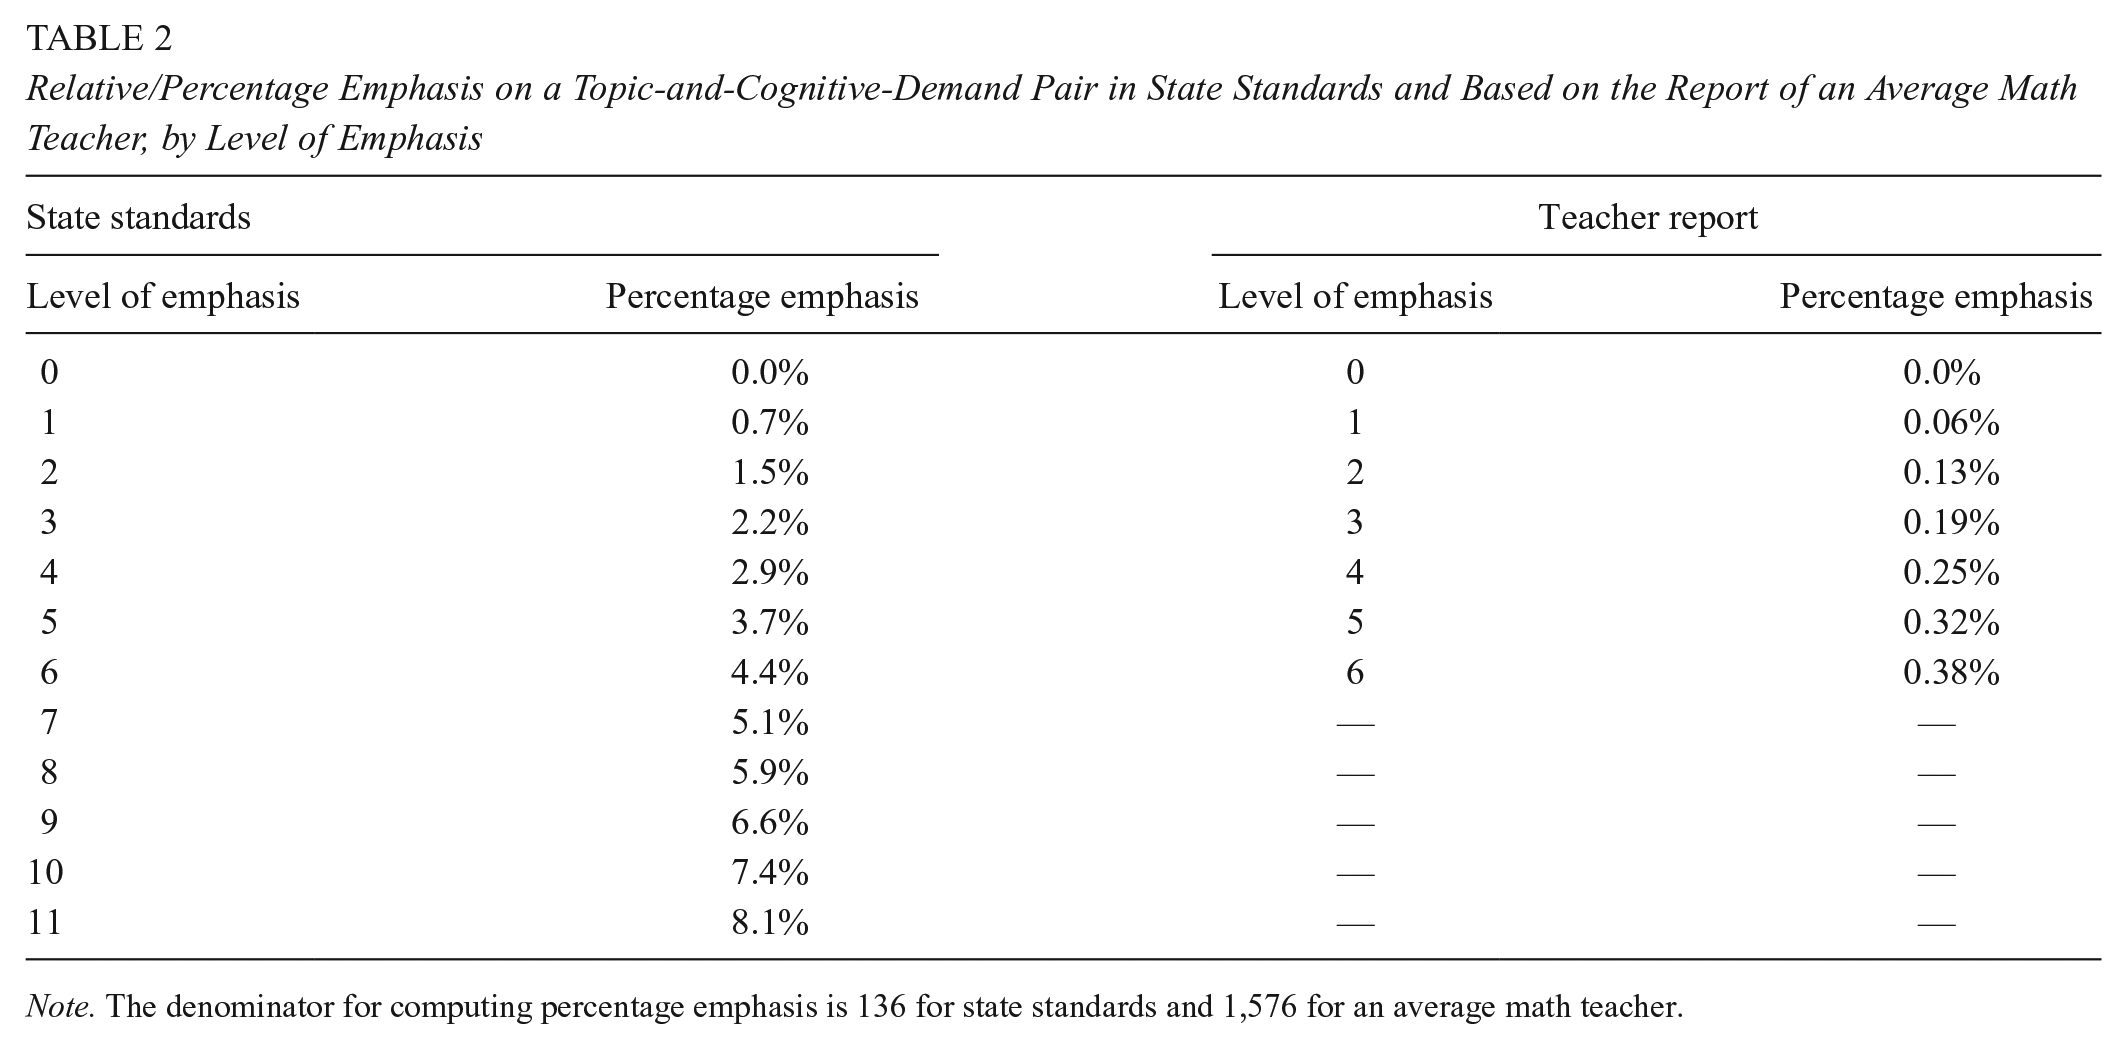
Note. The denominator for computing percentage emphasis is 136 for state standards and 1,576 for an average math teacher.
If we think of proportional emphasis in units of time and assume that students receive 180 hr of math instruction during a year (1 hr per day over 180 school days), the topic-and-cognitive-demand pairs most emphasized by the standards would receive approximately 14.6 hr of instruction, which seems reasonable. In contrast, the topic-and-cognitive-demand pair most emphasized by math teachers would receive only about 40 min of instruction, on average, over a whole school year, which does not seem plausible even if teacher instruction was only weakly aligned with state standards. Taken together, results from Analyses 4.1 and 4.2 cast doubt on the accuracy of teachers’ reporting of their instructional emphasis across topic-and-cognitive-demand pairs and raise questions about the validity of the SEC-based alignment measures for use as teacher outcomes in evaluations of teacher PD programs.
Assumption 5: The Relationship Between Alignment and Student Learning
Our final assumption in the interpretive argument concerns the associations between alignment measures and student learning. We conducted a single analysis to examine this assumption.
Analysis 5.1: The Relationship Between Alignment and Student Learning
For this analysis, we operationalized student learning as teachers’ value-added scores. Given the theory of standards-based reform, we expected that teachers whose instruction is better aligned to state standards would have higher value-added scores. This hypothesis assumes state tests are aligned to the standards and that students’ test scores reflect mastery of the knowledge and skills measured. Operationalizing improvement in student learning as value-added converts student-level testing outcomes to a teacher-level measure of student learning. Because alignment is a teacher-level characteristic, it makes conceptual sense to think of student outcomes in terms of teachers’ value-added scores when examining the relationship between teachers’ instructional alignment and student learning. We provide details of the calculation of value-added scores in Appendix D in the supplemental material, where we also provide information about the reliability of the calculated value-added scores.
We estimated associations between alignment and value-added scores using a three-level model to align with the nested nature of the data, where teacher-year-specific observations are nested within teachers and teachers nested within schools, with data pooled across both study years. The reduced-form specification of the model is as follows:

where Ytjk is the value-added score measured in student-level standard deviation units in year t for teacher j in school k; Ddk is a set of dummy indicators for the five study districts; Y2
tjk
is a dummy indicator coded 1 if the observation is from Year 2 and 0 if from Year 1; Atjk is the alignment index value in year t for teacher j in school k, standardized to have a mean of 0 and a standard deviation of 1;
Figure 5 presents findings from this set of analyses. For both math and ELA, the associations between overall alignment and value-added scores were not statistically significant (for math, the coefficient was 0.019, and for ELA, the coefficient was −0.008). In contrast to the associations between overall alignment and value-added scores, the associations between alignment by topic and value-added scores were positive and statistically significant for both subjects. For math, the association had a coefficient of 0.034 (p < .05), indicating that an increase of one standard deviation in the math topic alignment index was associated with a 0.034 student-level standard deviation increase in value-added scores. For ELA, the coefficient was slightly smaller (0.029) but still statistically significant (p < .05). The associations between cognitive demand alignment and value-added scores were small in magnitude for both subjects, with the relationship being very close to zero for math and weak for ELA. Neither was statistically significant. Tables in Appendix C in the supplemental material show additional model specifications where we exclude teacher and school covariates and models where we estimate the association between alignment and student test scores directly (rather than first estimating value-added scores). The results from these additional model specifications are consistent in level of significance and magnitude with those presented in Figure 5.

Associations between instructional alignment (measured in three ways) and value-added scores.
In interpreting the correlational findings reported, it should be noted that the estimated associations are attenuated by the less-than-perfect reliabilities of the alignment measures and teacher value-added scores. Thus, those associations represent conservative estimates of the true associations between instructional alignment and value-added scores.
Summary and Discussion
In this final section of the paper, we summarize the results of the validity evidence and discuss their implications with respect to the measurement of instructional alignment and the use of such measures to describe teachers’ instructional alignment to standards in future research.
Summary of Findings
In order to assess the validity evidence for SEC-based alignment indices, we conducted analyses to better understand (a) whether teachers can accurately describe the content of their instruction by topic and cognitive demand, (b) whether it is appropriate to compare proportions of emphasis from the teacher survey with proportions based on categorization of standards by experts, and (c) whether SEC-based alignment measures are positively related to student learning.
To make inferences about the accuracy of teachers’ reporting of instructional content, we examined the patterns of teachers’ responses on the FAST Instructional Survey. These analyses indicate that teachers were better able to differentiate their instructional emphasis by topic than by cognitive demand. In fact, a large share of teachers in our sample hardly reported any differentiation by cognitive demand. Within a given topic, teachers generally said they gave equal emphasis to each cognitive demand. Furthermore, most teachers’ cognitive demand alignment indices were no different than what they would have been had they picked the survey response options at random. Within a given cognitive demand, however, teachers were much better able to differentiate their level of emphasis across different topics, although the amount of differentiation was still well short of what was expected by the state standards. Teachers’ actual alignment indices by topic were also typically higher than what they would have been had the teachers filled out the FAST survey at random.
To assess the appropriateness of comparing proportions of emphasis from teachers’ survey responses with those coded by experts for the standards, we examined the prevalence of different responses for the teachers compared with the standards. Teachers were much more likely to assign nonzero levels—particularly, high levels—of emphasis to a given topic-and-cognitive-demand pair. Teachers assigned an emphasis of 3 or higher (on a 0-to-6 scale) for more than 60% of all topic-and-cognitive-demand pairs. In contrast, only 1.2% of topic-and-cognitive-demand pairs in Grade 4 math and 6% in Grade 5 ELA were coded as applying to three or more standards. These patterns show a clear inconsistency in how emphasis was reported by teachers compared with how it was coded based on the standards, which casts doubt on the accuracy of teachers’ reporting of their instructional emphasis and raises questions about the validity of the SEC-based alignment measures that reflect the degree of agreement between teacher-reported emphasis and emphasis in state standards.
With respect to the relationship between alignment and teachers’ value-added scores, we found that teachers’ overall instructional alignment, based on the intersection of topics and cognitive demands, was not statistically significantly related to teachers’ value-added scores in either math or ELA. This finding is similar to the results from the Polikoff and Porter (2014) study, which also found no systematic relationship between instructional alignment and value-added scores. To extend the analysis based on the overall alignment index, we also calculated alignment by topic and by cognitive demand and examined the relationships between these alignment indices and value-added scores. We found that in both math and ELA, teachers with higher alignment indices by topic tended to have higher value-added scores, and this relationship was statistically significant in both subjects. In contrast, alignment by cognitive demand was not a statistically significant predictor of value-added scores, and coefficients describing the relationship were close to zero in magnitude for math and small for ELA.
Possible Explanations
This study highlights some of the challenges associated with assessing the extent to which teachers align their instruction to state standards. In particular, teachers may have difficulty reporting instructional content by cognitive demand, as evidenced by the lack of differentiation of survey responses across cognitive demands, cognitive demand alignment scores that were not very different from scores that were randomly generated, and the lack of association between cognitive demand alignment and student learning.
One piece of evidence supporting the conclusion that teachers may not have accurately described the content of their instruction by cognitive demand is the equally reported emphasis across all cognitive demands by many teachers. There are four possible explanations for the lack of differentiation by cognitive demand based on the teacher survey data collected in this study. One explanation may be that teachers in this study indeed emphasized each cognitive demand more or less equally in their instruction. This may be, in part, due to the fact that some of the cognitive demands, particularly those in math, are associated with broader processes or practice standards that are intended to be emphasized on a regular basis. The Common Core State Standards in Math, for example, which were initially adopted by 46 states and the District of Columbia, outline eight practice standards (e.g., make sense of problems and persevere in solving them) that are not content specific and apply to students at all levels (National Governors Association Center for Best Practices & Council of Chief State School Officers, 2010). Because these standards apply to all topics across the year, they were not coded and included in the alignment analyses. Still teachers may have emphasized these cognitive demands in their instruction.
A second explanation for the lack of differentiation by cognitive demand may be that teachers in our study did not sufficiently understand the differences between different levels of cognitive demand or did not typically think about their instruction in terms of cognitive demand. Education curricula are generally organized as a progression through topics, so it seems reasonable that teachers would better understand and be able to report on their emphasis of instruction by topic rather than by cognitive demand. A lack of understanding or inability to clearly distinguish instruction by cognitive demand may have led teachers to report emphasis by cognitive demand equally even though that may not be indicative of the actual levels of emphasis on different cognitive demands in their instruction.
As a third explanation, the lack of differentiation by cognitive demand may at least partly reflect recall challenges for an end-of-year survey. It is possible that teachers might find it difficult to accurately recall the levels of emphasis they gave to different cognitive demands associated with each of the topics covered over the entire school year when responding to the FAST survey at the end of the school year. Teachers might have been better able to differentiate cognitive demands had they been asked to recall their instructional emphasis over a shorter time period (e.g., over a semester or a month rather than a school year).
A fourth explanation for both lack of differentiation and the overreporting of high emphasis levels could be that teachers responded in ways they thought they should respond, rather than reflecting their actual teaching. Teachers may have wanted to deemphasize “less rigorous” cognitive demands and more prevalently emphasize cognitive demands perceived to be more rigorous due to social desirability bias. Teachers also may perceive that covering a lot of content is a good thing and therefore may have overreported the extent to which they emphasized many of the topic-and-cognitive-demand pairs.
The possibility that instructional emphasis by cognitive demand reported through the FAST survey largely reflects noise that could be replicated through a random process—for ELA teachers in particular—calls into question the validity of the overall alignment index based on an end-of-year survey for use as a teacher outcome in evaluations of teacher PD programs and for other possible uses of the alignment index (e.g., for providing feedback on teachers’ instructional practice). To obtain a high level of overall alignment, teachers’ instruction must be aligned to state standards by both topic and cognitive demand simultaneously. There is no partial credit, so to speak, for being aligned by topic but misaligned by cognitive demand.
Implications
Although this study examined a specific version of the SEC involving a particular set of topics and cognitive demands and used a specific approach to expert coding of state standards that differed somewhat from the approaches used in earlier studies, our general method for measuring alignment based on the intersection of topic and cognitive demand is consistent with that used in prior studies of the SEC. Therefore, we believe the validity concerns raised by findings from this study apply more broadly to SEC-based measures of instructional alignment. Further, the relatively low alignment scores obtained in this study are consistent with the alignment scores reported in other studies (e.g., Polikoff, 2012a, 2012b; Polikoff & Porter, 2014), which also suggests that some of the validity issues highlighted in this study may apply more generally to SEC-based alignment measures. This could be checked by applying similar investigations of validity to those other SEC-based alignment measures as well.
Despite the issues we identified, our study should not be taken as a wholesale dismissal of all SEC-based alignment measures. Although our findings with respect to alignment by cognitive demand raise some concerns, our findings with respect to alignment by topic are promising. Teachers generally reported more differentiation of instructional emphasis by topic than by cognitive demand, their topic alignment scores were systematically higher than scores generated randomly, and topic alignment was a statistically significant predictor of student learning.
What do the mixed findings from this study mean for future research on SEC-based measures of instructional alignment? Our results suggest several potential directions for future work. First, it may be worth conducting more systematic analysis of the limitations and affordances of different ways of asking about cognitive demands using SEC-based instruments. Different versions of the SEC have used different language, different numbers of cognitive demands, and different rating scales. However, we would also point out that the average values of alignment indices based on the SEC used in prior studies were as low as or even lower than those reported in this study, suggesting that many of the issues we have found in this study related to the reporting of instructional content may have been present in the measurement of alignment using different iterations of the SEC (Polikoff, 2012a, 2012b; Porter, 2002). This may suggest the need for coming up with a new approach to asking about cognitive demands through a survey, such as providing more detailed, and perhaps topic-specific, explanations and examples of what instruction at different cognitive demands consists of. For future SEC-based research, it may also be helpful to conduct cognitive interviews that ask teachers to “think aloud” as they are reporting their instructional emphasis using the SEC. Such cognitive interviews would shed light on the extent to which teachers have an accurate understanding of different cognitive demands and on how they apportion instructional emphasis across cognitive demands within a topic (Desimone & Le Floch, 2004).
Second, it may be worth exploring combining the use of a survey to measure topic coverage and classroom observations (either in person or video recorded) to measure emphasis by cognitive demand. Although this would not permit an analysis of the intersection of topic and cognitive demand, it would provide data on both dimensions, which could potentially be combined to create an overall measure of alignment taking into account both dimensions. Our analyses indicate that the topic-based measure of alignment is predictive of value-added scores and that teachers were able to thoughtfully differentiate their instruction by topic. So, it may be best to retain a topic-only version of the SEC and try to get at cognitive demand through some other method.
Third, we should also consider the possibility that efforts to improve the measurement properties of the SEC when it is used to calculate alignment might weaken its use as a tool for PD. For the purpose of measuring alignment, future researchers may decide to omit cognitive demand given the reporting challenges or consider collecting the data more frequently over shorter time periods if feasible. However, for the purpose of supporting teachers’ PD, it may still be helpful for teachers to think about their instruction in terms of both topics and cognitive demand. To support teachers in improving the alignment of their instruction to state standards, coaches needed to know the relative emphasis given to topic-and-cognitive-demand pairs.
Fourth, if measures of alignment—and the standards—are to require teachers to consider different levels of emphasis for cognitive demands, it may be necessary to offer teachers more support to understand the differences among the cognitive demands and develop skill in analyzing and reporting on the level of emphasis given to cognitive demands in their instruction.
Finally, the incomparability of proportions of emphasis calculated based on teachers’ responses on the SEC compared with the coding of standards suggests that it may be necessary to rethink the emphasis scale used on the SEC and more clearly communicate what different values of emphasis mean. One possibility could be to apportion a fixed number of points that teachers would have to distribute across topic-and-cognitive-demand pairs. For example, a typical school year consists of 180 school days. Teachers could have 360 points to distribute across cells, and each point could be described as counting as a half day (or hour if there is 1 hr of math or ELA instruction per day) of instruction. This would prevent teachers from assigning high values of emphasis to large numbers of topic-and-cognitive-demand pairs and force teachers to better distinguish higher- and lower-emphasis pairs. However, this may also increase the cognitive difficulty of the exercise.
In conclusion, our analyses raise questions regarding approaches to measuring the alignment of teachers’ instruction to state standards. We have suggested a few potential strategies to address the challenges that surfaced through this work, including offering more support to teachers to understand the cognitive demands. However, more research is needed to better understand the extent to which these or other strategies would help improve the validity of measures of instructional alignment with regard to the specific purposes that those measures are intended to serve.
Supplemental Material
sj-docx-1-ero-10.1177_23328584221098761 – Supplemental material for The Validity of Measures of Instructional Alignment With State Standards Based on Surveys of Enacted Curriculum
Supplemental material, sj-docx-1-ero-10.1177_23328584221098761 for The Validity of Measures of Instructional Alignment With State Standards Based on Surveys of Enacted Curriculum by Drew Atchison, Michael S. Garet, Toni M. Smith and Mengli Song in AERA Open
Footnotes
Acknowledgements
We would like to thank Andrew Porter, University of Pennsylvania, and Morgan Polikoff, University of Southern California, for their constructive feedback on earlier drafts of this paper. The research reported here was supported by the Institute of Education Sciences, U.S. Department of Education, through Grant R305C150007 to University of Pennsylvania Graduate School of Education. The opinions expressed are those of the authors and do not represent views of the institute or the U.S. Department of Education.
1.
For reviews of other alignment methodologies, see Cizek et al. (2018), Martone and Sireci (2009), and ![]() .
.
Authors
DREW ATCHISON is a senior researcher at the American Institutes for Research (AIR). In that role, he conducts quantitative analysis on a wide range of topics, including school and district improvement, accountability, education finance, and educational equity.
MICHAEL S. GARET is a vice president and Institute Fellow at AIR. He has designed and led rigorous studies of teacher professional development and teacher and leader evaluation systems as well as continuous improvement in schools.
TONI M. SMITH is a principal researcher at AIR, where she directs research and development projects focused on mathematics instruction and teacher professional learning.
MENGLI SONG is a principal researcher at AIR. Her work focuses on research design, quantitative methods, and evaluations of educational programs and policy.
References
Supplementary Material
Please find the following supplemental material available below.
For Open Access articles published under a Creative Commons License, all supplemental material carries the same license as the article it is associated with.
For non-Open Access articles published, all supplemental material carries a non-exclusive license, and permission requests for re-use of supplemental material or any part of supplemental material shall be sent directly to the copyright owner as specified in the copyright notice associated with the article.