
Abstract
Developing instructional capacity in schools is a central challenge of the Common Core movement. Most conceptualizations of capacity building focus on infusing externally generated professional development into schools. In this article, we explore the professional resources that reside inside schools that might be utilized to develop instructional capacity from within. Overall, we found that an abundance of these resources existed in schools, but they were unevenly distributed across and within schools. We also found that coaches and administrators were more likely to be recipients for requests for assistance and that they tended to have more Common Core subject matter knowledge, on average, than teachers did. We also found that external resource seeking was correlated with Common Core knowledge and with those who were recipients of requests for advice from colleagues. The article concludes with a discussion of the implications of these findings for research and practice.
Keywords
T
The goal of this investigation was to understand how knowledge and assistance about the CCSS are arrayed inside a diverse sample of New York City schools and how these configurations may help school and district leaders identify and position expertise to deepen implementation. The research team conducted a mixed-method research study of a sample of eight New York City schools (five elementary and three middle schools) during the 2012–2013 school year. After this introduction, we provide an overview of the context of Common Core implementation in New York City during the time of the study. Then, we present a brief overview of our research design, including a description of the sample, survey, and analytic methods. Next, we describe the results of the survey, with an emphasis on the knowledge and communication of individuals within and across teams. We also identified a small group of individuals in the sample who were particularly influential, and examine differences in their knowledge, experience, and access to external Common Core resources. The final analyses report on the individual- and team-level predictors of knowledge and communication. We conclude with a discussion of the implications of the results for research and practice.
Rationale for Well-Positioned Expertise
Theory and empirical research on the benefits of organization-wide knowledge and well-positioned expertise provide a rationale for identifying, developing, and positioning knowledgeable individuals within schools. Theorists have made several distinctions among the different types of knowledge, including individual and organizational knowledge (Tsoukas & Vladimirou, 2001) and tacit and explicit knowledge (Nonaka, 1994). Organizational knowledge is that shared across a social system (March, 1991), which may be encoded into the routines that make up regular organizational practices (March & Olsen, 1976). Benefits of organizational knowledge include more effective management of intellectual capital (Stewart, 1997) and the spread of innovation (Hamel & Prahalad, 1994). Tacit knowledge, what Nonaka (1994) calls “know how,” is thought to be shared through regular and collegial interactions focused on the work practices of organizational members (Lave & Wenger, 1998).
Social capital is one conception of how knowledge is embodied and shared among individuals within an organization (Coleman, 1990). Sociologists define organizational social capital as the cumulative knowledge and resources residing within a cultural unit that individuals can access through interactions with others (Coleman, 1990; Lin, Cook, & Burt, 2001; Portes, 2000). Abundant social capital provides access to an array of physical, intellectual, and social resources that benefit individuals and their communities (Putnam, 1993). Schools, as microsocieties, provide a classic arena for the distribution and positioning of social capital.
The predominant way in social science research of studying social capital is through the analysis of social networks. Social networks represent the way that individuals interact and transfer resources (Lin, 2002). Social network analysis can be used to examine the ways that structural positions in a network facilitate access to information and, therefore, to social capital (Burt, 2001; Lin et al., 2001). Theorists suggest that the underlying social structure determines the type, access, and flow of resources among actors in a network (Daly, 2010; Cross & Parker, 2004). When individuals communicate with one another, information and resources can travel among them. In this way, certain individuals have access to better information because of their positions within the network, and social structure provides both opportunities and constraints for learning and facilitating change (Wasserman & Faust, 1994).
High social capital is linked to many desirable outcomes in education. Social network studies have examined the relationships among actors that facilitate or constrain the flow of a range of physical and intellectual resources, including knowledge, materials, ideas, and practices (e.g., Coburn & Russell, 2008; Cole & Weinbaum, 2010; Daly, 2010; Frank, 2009; Levine & Marcus, 2010; Spillane, Hunt, & Healey, 2009). Other studies in education have found that schools organized as communities promote greater teacher commitment and more student engagement in school work (Bryk & Driscoll, 1988; Rowan, 1990). Lee, Dedrick, and Smith (1991) examined the effect of the social organization of schools on teachers’ efficacy and satisfaction and found that principal leadership, communal school organization, and teacher environmental control were associated with efficacy. Lee and Smith (1996), using nationally representative high school data, found that the achievement gains in reading, mathematics, science, and history were significantly higher in schools where teachers reported that they took collective responsibility for learning. McLaughlin and Talbert (2001) found that professional communities in high schools influenced professional satisfaction and instructional practice.
Social network theorists consider the positions of individuals within a network to be an essential aspect of their influence. When describing influence, theorists focus more on the position of individuals relative to other actors as opposed to their formal titles or positions (Scott, 2000). An individual’s influence in a social network is affected by the range and quality of connections, or ties, that she or he has or is surrounded by. Influence can be explained by a range of factors, including expertise, formal authority, experience, access to resources, physical proximity, and social connections (Supovitz, 2008).
In schools, teacher leaders, coaches, and administrators can play particularly useful roles in social networks because they naturally connect within and across grade-level groupings and may have more professional interactions outside their schools (Young, 2006). These “boundary spanners” can broker resources in a way that individuals embedded in a constrained network cannot. However, these leaders’ ability to move information and strategies may be dependent on whether they have adequate social ties to diffuse resources throughout a system; absent those relationships, the expertise and knowledge of these individuals may remain personal assets (Atteberry & Bryk, 2011).
Another key dimension of social network theory is the importance of social interactions within and among subgroups within a larger system. In schools, these may be grade-level teams in elementary schools, subject matter teams in middle schools, or other subteam structures. Collaborating with colleagues is a form of knowledge generation that can produce new understandings and help make tacit information and ideas explicit (Nonaka, 1994). Dense subgroup interactions help to disperse resources, support the transfer of information, facilitate collaborative problem solving, and produce innovative solutions (Krackhardt, 1992; Reagans & McEvily, 2003; Uzzi, 1997). Developing a collaborative environment that provides for the sharing of ideas and strategies with colleagues (Forman, 2007; Young, 2006) is an important aspect of building capacity from within. Creating and supporting opportunities for subgroups to exchange resources has the potential to develop novel information that benefits not only the subgroup but also the larger system in which the cluster resides (Frank & Zhao, 2005).
Finally, access to resources outside one’s social network is another important attribute of social capital described in the literature (Lee, Lee, & Pennings, 2001). Connections and absorptions of external resources can bring new materials, ideas, and strategies into an organization (Lin, 2002; Zaheer, Gulati, & Nohria, 2000). The use of intermediary organizations to develop capacity and infuse skills is another way of building social capital. In addition, technology creates further opportunities to access external knowledge and ideas.
The Context of Common Core Implementation in New York City
New York City is far and away the largest school district in the United States, with >1 million students and 1,700 schools, almost twice as large as the next-largest district, Los Angeles. New York City is diverse ethnically, socially, economically, and culturally. New York also has a history of decentralization. School principals hire and evaluate their teachers. Schools choose from among a wide-ranging list of district-approved curricula across the content areas. Additionally, school leaders confer with faculty to develop individual- and school-level professional development opportunities.
Implementation of the CCSS has been a central part of reform in New York City since 2010, when district leaders decided to focus their instructional improvement efforts around the CCSS. The CCSS are an ambitious set of learning expectations in literacy and mathematics that describe what students should know and be able to do as they progress throughout the grade levels (Grossman, Reyna, & Shipton, 2011). While the CCSS do not specify a particular curriculum or pedagogical strategies, they challenge teachers to rethink the ways in which they provide students with educational opportunities and foster their intellectual engagement.
Each year since 2010, the New York City Department of Education (NYCDOE) has created a set of Citywide Instructional Expectations to guide schools in their engagement with the standards. In 2012–2013, the year of the study, the NYCDOE asked schools to identify and implement four performance-based assessments (PBAs), or performance tasks, within a CCSS-aligned curricular unit and indicated that all students should experience at least one task in literacy and one in mathematics. The NYCDOE designed this policy as a set of carefully chosen opportunities for schools to engage with the more rigorous expectations for teaching and learning embodied in the standards (Supovitz, 2011). The hope was that by engaging with these learning opportunities, school staff would develop a deeper, shared understanding of the standards and could begin to address the scope of change necessary to meet the higher expectations.
Each school in the city also belongs to a support network called a Children First Network (CFN). CFNs grew out of the NYCDOE Empowerment Schools Initiative, designed to synthesize operational and instructional support for schools. The goal is to devolve as much decision-making power as possible to the people who know schools best: principals, teachers, and school staff. Principals get to pick one of the 55 CFNs that best meet the needs of their schools; if they are not satisfied with their network support, they can move to a different network. Each CFN employs a cross-functional team directly accountable to principals and delivers professional development and other support services to an average of about 25 to 30 schools.
Study Design and Research Questions
This study emerged as a follow-up to an examination of CCSS implementation in a sample of 16 New York City elementary and middle schools by members of the research team (Goldsworthy, Supovitz, & Riggan, 2013). In that study, we saw that schools could be placed on a rough continuum of perspectives from which they engaged with standards implementation, ranging from “conservation oriented” to “transformation oriented.” Conservation-oriented schools were primarily focused on preserving existing structures and practices and, relatedly, minimizing disruption of the status quo—perhaps because the schools’ practices were already aligned with the rigor reflected in the CCSS. However, all but one of the schools in our sample that typified this perspective had a large gap between their current practices and the expectations of the CCSS and interpreted the challenge of implementation as finding ways to reduce teacher anxiety and conserve energy. Consequently, they tended to modify the curricular and instructional expectations of the standards to fit their current practices, rather than the reverse. In minimizing the scope of change, these schools limited their engagement with the CCSS, and their level of understanding of the expectations inherent in the standards appeared to be less developed. Such a conservationist approach may be a rational response to the turbulent environment of school reform, where changes are continuously and rapidly introduced. Transformation-oriented schools, by contrast, interpreted the scope of change differently; they tended to believe that the best way to meet future expectations was to make more significant changes sooner rather than later, even if this involved more immediate disruption. Consequently, transformation-oriented schools tended to engage more deeply with the Citywide Instructional Expectations, which led them toward a more robust understanding of the CCSS and their implications for teaching and learning. We therefore decided to sample a subset of schools across this continuum.
Furthermore, both the funder and the NYCDOE leaders were interested in the capacity that resided within schools to implement the CCSS. Because of its size and culture, New York City has approached the challenge of implementing the Common Core more inside out than most districts. While professional development remains an important part of the district’s strategy, the district is particularly interested in identifying and positioning capacity from within schools to facilitate teachers’ engagement with the Common Core. In this exploratory study, we investigated how Common Core knowledge and instructional advice seeking are arrayed in schools and how this might help deepen Common Core implementation. To this end, the study was guided by three central research questions:
Question 1: How was CCSS knowledge and assistance distributed across the faculty members in the sample of schools?
Question 2: Who were the knowledgeable and influential individuals about the CCSS in the schools and what positions did they hold?
Question 3: What was the relationship between CCSS knowledge and assistance, and what individual- and team-level characteristics were associated with providing assistance?
Sample Selection
Building on the findings of the 2011–2012 study of 16 schools (Goldsworthy et al., 2013), we sampled eight schools: two high-conservation schools, two low-conservation schools, two low-transformation schools, and two high-transformation schools.
Demographic information for the eight participating schools is shown in Table 1. Five schools were elementary schools, while three were middle schools. The schools had a broad range in size, from a 160-student K–5 school to a 1,500-student middle school. Schools in the sample averaged about 40% proficiency in English language arts (ELA) and mathematics. Free/reduced-price lunch, a measure of school poverty, ranged from a high of almost 90% to a low of 27%, averaging 70%. Schools in the sample had, on average, 11% English language learners, and just under 20% of the students were classified as special education. The schools also had a range of ethnic mix of their student population, and all five boroughs of New York were represented in the sample.
Demographics of Final School Sample

Note. Values presented as percentages unless noted otherwise. ELL = English language learner; FRL = free and reduced-price lunch; K = kindergarten; PK = prekindergarten; SPED = special education.
Approximate.
Research Method
The research design for this analysis was based on a school faculty survey that was connected to a companion investigation of Common Core implementation in New York City. The companion investigation included a series of interviews with school faculty members, but these data were not used in this investigation. As part of the larger study, we visited each school in the late winter of 2013 and administered a short faculty survey focused on Common Core knowledge and how the faculty interacted around understanding and implementing the CCSS. To facilitate response, the survey was administered during a prescheduled faculty meeting so that we could describe the purpose of the survey, ensure confidentiality, answer questions, and collect the completed surveys.
CCSS Knowledge and Communication Survey
The two-page survey comprised four parts:
Job demographics: This section of the survey asked respondents four questions about their current role in the school, what subjects and grades they taught (if applicable), and their years of experience.
Professional communications: This section included two social network questions that asked respondents who they turned to in their school when they had questions about the CCSS and implementing PBAs. The question about PBAs was asked because these were a central component of the New York City instructional expectations for teachers. Respondents were first asked to identify up to five staff members to whom they turned for advice on each topic. To facilitate this process, we provided each faculty member with a faculty list from the school.
Knowledge of the CCSS in ELA and mathematics: This section of the survey asked respondents six Common Core knowledge questions: three about ELA and three about mathematics. These items were revised from previous Consortium for Policy Research in Education (CPRE) evaluation work on CCSS implementation, vetted with content experts in each subject, and piloted with teachers familiar with the standards. One of the three questions in each content area was designed to allow for partial credit. These questions are shown in Appendix A.
Access to external resources: The fourth part of the survey listed 10 external sources of Common Core information that were available to New York City schools. This list—which included both electronic resources (commoncore.org, the Teaching Channel, the NYCDOE Common Core library, achievethecore.org) and in-person resources (network support, Teachers College, other teachers in the district, United Federation of Teachers, Common Core fellows, Australian United States Services in Education)—was constructed from resources mentioned by school faculty members in prior interviews with school staff. Participants were asked which of these sources, if any, they accessed for Common Core planning and implementation.
Analytic Method
We focused our analysis primarily on individuals and grade level (elementary school) and subject matter (middle school) teams and not the whole school. Our rationales for this were both substantive and methodological. Substantively, the focus of CCSS implementation in New York was to engage with the standards as teams, and all of the teachers in our sample met as either grade-level teams (elementary schools) or subject matter teams (middle schools). Methodologically, our sample of eight schools was too small to conduct statistical analyses at the school level.
We used the survey data to construct a series of variables. First, the job demographics provided us with each faculty member’s years of experience, grade taught, and position (i.e., teacher, special education, coach, administrator). Second, we used the social network questions to produce two variables, which we called CCSS influence and PBA influence. For this study, we define an individual’s influence as the number of requests for assistance, or in-ties, that he or she receives. One important consequence to note about social network surveys of this type is that a person could be identified as a source for assistance and not have completed the survey. These survey nonrespondents are included in some of our analyses because they are important sources of influence in a school regardless of whether they happened to have been present at the time of the survey administration.
Next, we created CCSS ELA and mathematics knowledge scores for each individual by assigning him or her a score of 1 to 3 in each subject. Two of the three questions in each subject had a single correct answer, which was worth 1 point. One of the three questions in each subject had five options and three correct answers, and subjects were given 0.2 points for each answer they marked (or did not mark) correctly. Thus, scores ranged from 0 to 3, with portions of points possible.
To identify the extent of communication within teams in the elementary and middle schools, we produced measures of density and frequency of within-team ties for each grade-level team and subject matter teacher team. The density score is the within-team number of actualized advice-seeking ties (i.e., in-ties) as a proportion of the number of potential ties among the team members. Thus, a three-person team would have six potential ties (each member has two potential ties: one in-tie and one out-tie), which would serve as the denominator in a ratio of the actual ties as a proportion of the possible ties. The higher a team’s density score, the greater proportion that a team’s members reported going to one another for information or advice about the particular topic of the network (either CCSS or PBAs).
Next, we created a scale of external resources by adding each of the 10 external resources into a continuous scale of 1 to 10 for each survey respondent. This represented each individual’s degree of access to external resources. Finally, we created a variable called “transformation orientation,” which placed teams on a scale of 1 (high conservation) to 4 (high transformation) based on the school within which they resided (see Table 1).
To analyze the data visually, we entered the social network data into matrices and produced sociograms of CCSS communication for each school, using UCINET 6. In each sociogram, we identified those individuals who had “high knowledge” about the mathematics CCSS and/or the ELA CCSS. For this article, we liberally defined high CCSS knowledge as those individuals who scored >1 standard deviation above the mean for their school level (i.e., we produced separate means and standard deviations for the elementary and middle schools in the sample). These descriptive sociograms allowed us to gain a sense of how subject matter CCSS knowledge and communication were arrayed in each school.
Next we produced descriptive statistics separately for individuals and teams at the elementary and middle school levels. We conducted paired t tests and analyses of variance with post hoc tests to examine differences within and between groups of individuals in different positions, as well as differences across-teams.
Finally, to address the last research question, we developed two mixed models that nested school faculty members within teams. The first model predicted individuals’ receipt of requests for assistance, or in-ties, for performance assessments, which were a specific implementation task at the time of the study. The second mixed model predicted individuals’ receipt of requests for assistance, or in-ties, about the Common Core more generally. All models included individual faculty characteristics at Level 1: Common Core knowledge, experience, position (administrator, teacher, coach), and access to external resources. At Level 2, the models contained within-team communication density. We also included at Level 2 an indicator of the degree of transformation orientation of the school in which the team resided. Finally, we added school size as a Level 2 covariate because we did not want to unduly privilege faculty members in large schools for having greater communication opportunities. We left all variables in their original metrics and uncentered. Because of the small sample of elementary school teams, we noted significance at the .10 level. All statistical analyses were conducted with SPSS 22.
Results
In the spring of 2013, the staff at the eight schools in our sample completed the survey about CCSS knowledge and communication. The survey was administered during a faculty meeting attended by a research team member, who explained the purpose and confidentiality of the survey. Across the eight schools surveyed, 456 of 524 faculty members completed the survey, for an 89% response rate. School response rates ranged from 74% to 100% (see Appendix B). The Results section is organized to address the three central research questions of this investigation.
Visual Depiction of CCSS Knowledge and Assistance
Social network analysis is a useful technique to help us picture how knowledge and assistance are distributed in schools. The sociogram shown in Figure 1 depicts the Common Core network in one of the elementary schools in our sample. The picture is intended to give a visual representation of the Common Core network within this particular school. In the picture, each individual within the school is represented by a shape, or node. The position of each individual is captured by the form of the node such that general elementary teachers are circles. The grade of the teacher is next to each circle to distinguish which teachers are at the same grade level. The lines that connect each node show the requester and recipient for information about the Common Core. These lines are called ties because they connect people to others. Each tie has an arrow on one or both ends, showing which individual was the requestor and which was the recipient for information about the Common Core.

Common Core knowledge and communication patterns in one elementary school. CCSS = Common Core State Standards; ELA = English language arts.
The color/shading of the nodes represents which individuals within the school were determined to have high knowledge regarding the Common Core in ELA (blue/light shade), high knowledge regarding the Common Core in mathematics (red/moderate shade), or high knowledge in both these content areas (purple/dark shade). Individuals were considered to have high knowledge if they scored >1 standard deviation above the mean of all survey respondents at their level (i.e., we produced separate CCSS knowledge means for elementary and middle schools). Individuals who did not have high knowledge in either mathematics or ELA show up as white in the figure. A few individuals have asterisks in the middle of their nodes. These people did not complete the survey; therefore, we were not able to determine their Common Core knowledge scores. They were, however, mentioned as recipients for assistance and accordingly have a place in the network.
Sociograms like this provide a visual representation of the data and show a kind of x-ray of the array of knowledge and advice seeking in schools. From this picture, for example, we can see that two members of the third-grade team had high knowledge in both ELA and math but were not recipients for many requests for CCSS information. The three members of the fourth-grade team demonstrated high mathematics knowledge but were also not sought for advice on CCSS implementation. From the sociogram, we can also see that the coach was a central source of CCSS advice in the school, as shown by the number of in-ties, and had high knowledge of the CCSS in both mathematics and ELA. While staff in the building did seek out the principal for advice regarding Common Core, the principal received fewer in-ties than the coach. The principal, unlike the coach, did not have high knowledge about Common Core in either mathematics or ELA according to our measure.
Sociograms for all eight schools in the sample are included in Appendix C for visual examination of the dispersion of CCSS subject knowledge and assistance patterns within and across schools. While these pictures are useful depictions of how knowledge and assistance patterns are arrayed in schools, their downside is that they are fairly inefficient ways of representing the data about CCSS knowledge and communication within and across schools. Therefore, in the rest of this article, we numerically represent the characteristics in Figure 1 and Appendix C.
Table 2 summarizes CCSS expertise by subject within and across schools. Several things are notable in the table. First, every school has individuals with high CCSS knowledge in ELA and mathematics. However, there is considerable variation across schools in ELA CCSS knowledge (from 6% to 38%) and mathematics CCSS knowledge (from 15% to 33%). Third, while some schools have knowledge in both subject areas, other schools (e.g., Schools 2 and 4) have an imbalance in knowledge between the two subject areas.
Individuals Within Each School With High Knowledge
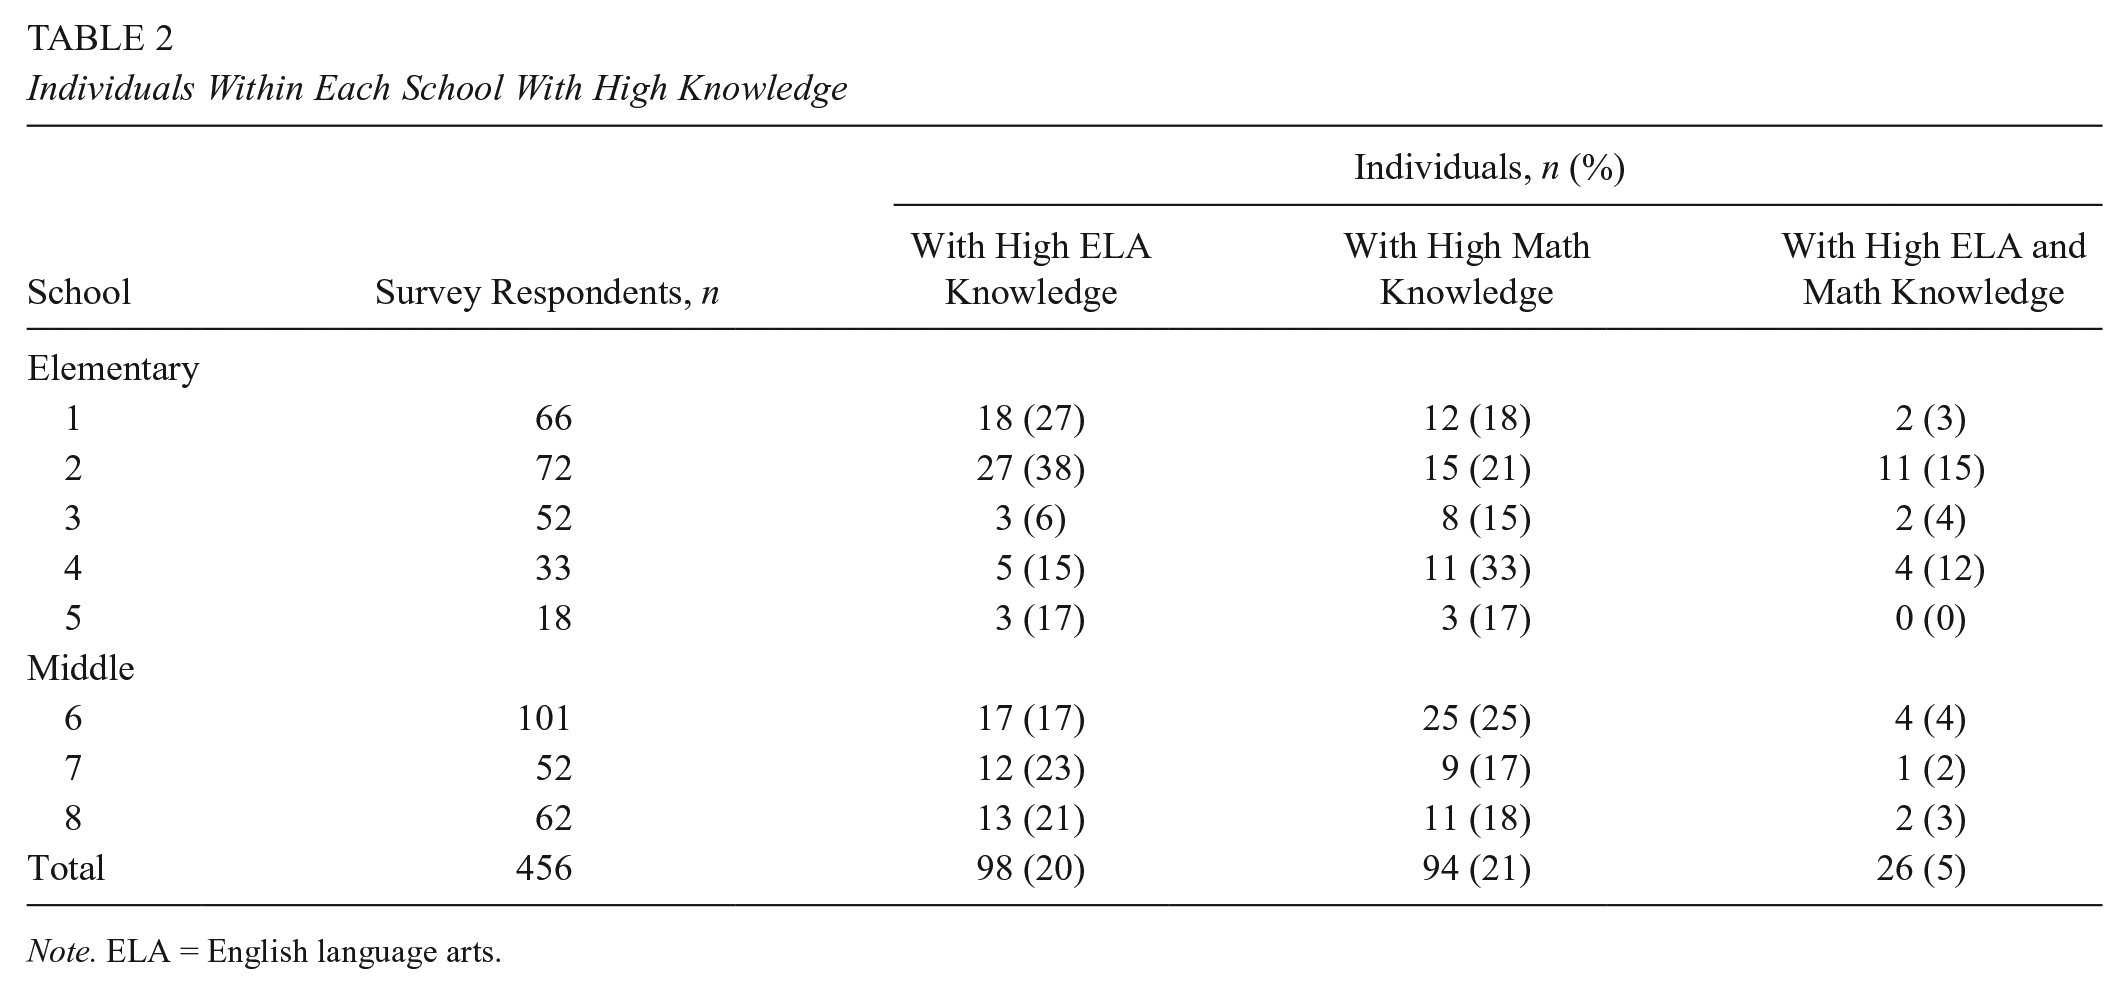
Note. ELA = English language arts.
Distribution of CCSS Knowledge and Assistance Among School Faculty Members
Our next analyses focused on the knowledge, assistance, and external resource access of the school faculty members in the elementary (Table 3) and middle (Table 4) schools. Focusing first on the elementary school faculty members in Table 3, we can see that overall administrators (a combination of principals and assistant principals) were the most knowledgeable about the CCSS in both ELA and mathematics. Post hoc tests indicated that administrators were significantly more knowledgeable in ELA than teachers (mean difference = 0.58, SE = 0.23, p = .012) but not significantly different than coaches (mean difference = 0.36, SE = 0.35, p = .300). There were no significant differences in CCSS mathematics knowledge among teachers, coaches, and administrators. The “other” category—which consisted of a hodgepodge of other positions, including counselors, librarians, speech teachers, and so on—were significantly less knowledgeable than the three other groups in both subjects. Finally, paired t tests showed that teachers, t(176) = 2.28 (p = .027); administrators, t(14) = 2.11 (p = .053); and others, t(38) = 2.03 (p = .050), had significantly higher ELA CCSS knowledge than they did mathematics CCSS knowledge.
Descriptive Statistics for Common Core Knowledge and Assistance in Elementary Schools
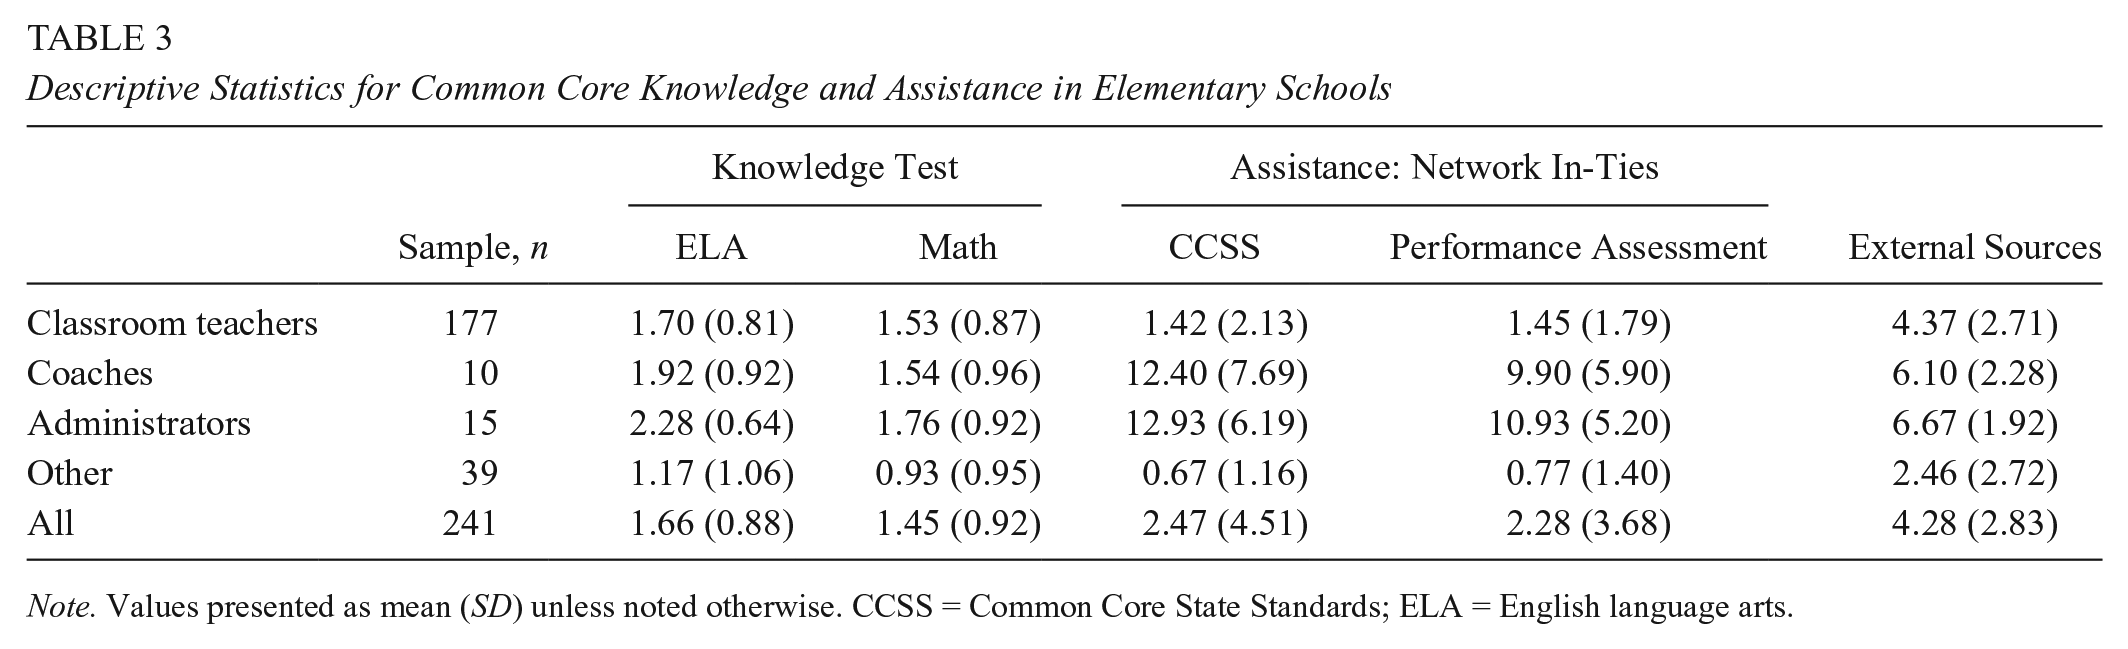
Note. Values presented as mean (SD) unless noted otherwise. CCSS = Common Core State Standards; ELA = English language arts.
Descriptive Statistics for Common Core Knowledge and Assistance in Middle Schools
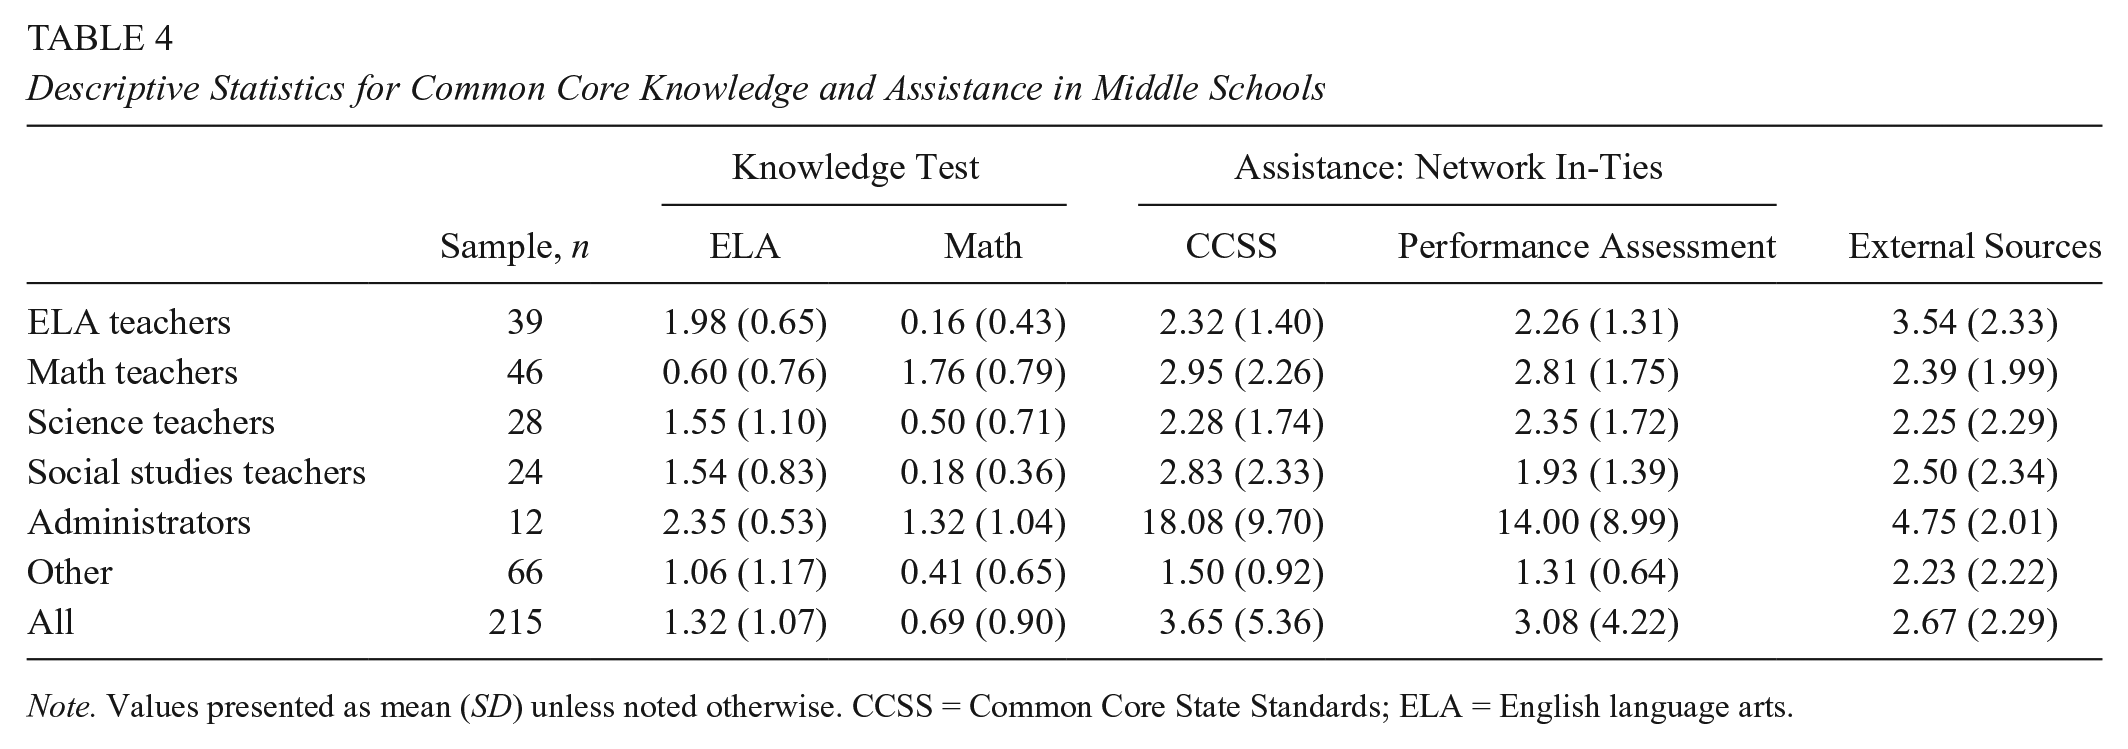
Note. Values presented as mean (SD) unless noted otherwise. CCSS = Common Core State Standards; ELA = English language arts.
The next two columns in Table 3 show the average and standard deviation of the in-ties in the two networks—assistance giving about the CCSS and PBAs. These numbers represent the average number of requests for assistance for each elementary school group. These two networks were chosen to represent advice networks on the two major topics related to Common Core implementation in New York City during the year of study. The elementary school administrators and coaches were the major recipients of requests for information about the Common Core and performance assessments. There was no significant difference between the average requests of coaches and administrators in either the CCSS or PBA networks. Teachers received far fewer requests for assistance on both topics than did either coaches or administrators. The dramatic difference between coach/administrators and teachers can be attributed to a number of factors, including sample sizes, the fact that about 40% of teachers received no requests for information about either topic, and the lesser availability of teachers during the school day.
The last column of Table 3 shows elementary school faculty access to external resources about CCSS implementation. Teachers, who reported accessing just over four of the 10 external resources, on average, accessed significantly fewer resources than did coaches (mean difference = 1.72, SE = 0.86, p = .046) or administrators (mean difference = 2.29, SE = 0.71, p = .001). There were no significant differences between coaches and administrators (mean difference = 0.56, SE = 1.08, p = .601). All three groups reported accessing more external resources than the catch-all group of “other.”
The middle school data, shown in Table 4, are organized slightly differently. First, teachers are broken into their subject matter specialties (ELA, mathematics, science, and social studies). Second, nobody reported being a middle school coach, so there is no coach designation in the middle school table.
The patterns in middle schools are fairly representative of subject matter. The ELA teachers had significantly higher ELA CCSS knowledge (an average of 1.98 on the 3-point scale) than did the other subject matter teachers, but their ELA CCSS knowledge was not statistically different from that of the administrators’ average score of 2.35 (mean difference = 0.37, SE = 0.31, p = .238). The mathematics teachers, with an average of 1.76 on the 3-point scale, had significantly higher mathematics CCSS knowledge than all other groups, including administrators (mean difference = 0.44, SE = 0.21, p = .042).
In terms of seeking assistance for both implementing the Common Core and administering performance assessments, administrators were far greater recipients of requests for assistance, garnering an average of 18 requests for CCSS assistance and an average of 14 requests for assistance about performance assessments. By contrast, teachers received an average of about two to three requests for assistance on these topics.
The final column in Table 4 shows an aggregate of 10 types of external resources that faculty members were asked about accessing. The extent of outreach to external resources was less in the middle schools (mean = 2.67) than in the elementary schools (mean = 4.28). The patterns within middle schools, however, were similar, with administrators having significantly higher outreach than that of all groups except ELA teachers (mean difference = 0.44, SE = 0.21, p = .042). ELA teachers also had significantly more outreach than did mathematics teachers (mean difference = 1.15, SE = 0.48, p = .018).
Common Core Knowledge and Assistance Between Teams
Our next analyses focused on the teacher teams across the eight schools in the sample. While a variety of group configurations are used within schools (grade-level teams, subject matter teams, inquiry teams, special project teams, etc.), we focused on the team structures used most frequently by teachers. In the elementary schools, we targeted our analyses on grade-level teams, and in the middle schools, we focused on content area teams. In all, across the eight schools, there were 26 elementary grade-level teams and 12 middle school content area teams. One small elementary school had only two teams: a team of Grade K–2 teachers and a team of Grade 3–5 teachers. The other four elementary schools had six teams each (one per grade in Grades K–5). The number of team members for the elementary school grade-level teams ranged from two to 11 (including special education teachers attached to the team). In the middle schools, four content area teams for each of the three schools were analyzed: mathematics, ELA, social studies, and science. The number of team members across these 12 teams ranged from five to 14 (in the largest middle school in our sample).
Elementary school team-level Common Core knowledge and assistance
The overall team averages for ELA and mathematics knowledge among the elementary school grade-level teams are shown in Table 5. The average ELA score was 1.69 (SD = 0.26). In mathematics, the average score was 1.64 (SD = 0.26). Of the 26 elementary school grade-level teams, 11 (42%) had average ELA knowledge scores more than a half a standard deviation above average. Additionally, the six most knowledgeable teams were upper elementary teams (i.e., Grades 3–5). However, 8 of the 26 teams had average ELA knowledge scores (31%) more than a half a standard deviation below the average, and all but one were lower elementary teams (i.e., Grades K–2). The average scores in mathematics reflected a similar pattern, with higher team scores in Grades 3–5 than in Grades 1–2. This may suggest more engagement in the Common Core in the upper elementary teams relative to the lower elementary school teams.
Elementary School Grade-Level Teams’ Common Core Knowledge and Assistance

Note. Values presented as mean (SD) unless noted otherwise. One small elementary school, which had a Grade K–2 team and a Grade 3–5 team, is not included in this table. CCSS = Common Core State Standards; ELA = English language arts; K = kindergarten; PBA = performance-based assessment.
Number of in-ties.
Table 5 also shows the number of in-ties and the density of assistance requests for both the CCSS and PBAs within elementary school grade-level teams. These are based solely on in-ties within teams. The density score is the within-team number of actualized advice-seeking ties (i.e., in-ties) as a proportion of the number of potential ties among the team members. There were no statistically significant differences in the density of conversations among the elementary school grade-level teams in advice seeking about the CCSS or PBAs.
Middle school team-level Common Core knowledge and assistance
Unsurprisingly, there were starker differences among the middle school content area teams in their average CCSS ELA and mathematics knowledge scores. The middle school CCSS knowledge scores, organized by subject matter teams, are shown in Table 6. In ELA, the average CCSS knowledge score on our 3-point scale was 1.51. Of the 12 middle school subject matter teams, 6 had ELA scores higher than a half a standard deviation above the average. These included the three ELA teams, as well as two science teams and one social studies team. By contrast, four of the 12 teams (33%) had scores below more than a half a standard deviation below average. The three mathematics teams had the lowest average ELA knowledge scores.
Middle School Subject Matter Teams’ Common Core Knowledge and Assistance

Note. Values presented as mean (SD). CCSS = Common Core State Standards; ELA = English language arts; PBA = performance-based assessment.
Number of in-ties.
Average CCSS knowledge in middle schools was significantly lower in mathematics than it was in ELA, t(11) = 2.58 (p = .026). The lower average score in mathematics can be attributed to the low performance of three quarters of the teams—basically, all the nonmathematics teams. In terms of order of performance, the pattern in mathematics CCSS knowledge was almost symmetrically reversed from ELA CCSS knowledge. The three mathematics teams had the highest mathematics CCSS knowledge among the 12 teams, while those with the lowest mathematics scores were the ELA, science, and social studies teams that performed well on the ELA Common Core knowledge test. An analysis of variance that compared performance across subject matter teams indicated that the ELA teams were significantly more knowledgeable in ELA than the mathematics teams (mean difference = 1.30, SE = 0.25, p = .001), but there were no significant differences in ELA knowledge between the ELA teams and social studies or science teams. In terms of mathematics knowledge, the mathematics teams were significantly more knowledgeable than any of the other three subject matter teams. Finally, despite the differences in mathematics and ELA knowledge across the subject matter teams, there were no differences in the density of advice seeking about either the CCSS or PBAs in between the middle school teams.
Predictors of CCSS Assistance
In the final section, we examine the predictors of advice seeking, or assistance. We focused on this because it is important to know if there was a relationship between knowledge about subjects of key organizational interest and advice seeking about the same topics. The culminating analysis focused on the third research question: What is the relationship between CCSS knowledge and assistance, and what individual- and grade-level characteristics are associated with them?
For these analyses, we used only the data from the five elementary schools, structuring the data as faculty members nested within grade-level teams. We created two additional teams in each school: one for the school’s administrators and one for the coaches. While we considered including the middle school data in these analyses, we decided that the context of the team configurations across the elementary and middle schools was too different to merit their inclusion, and there were too few teams in the middle schools (only 12) to do a separate middle school analysis.
The full data set from the survey of the five elementary schools consisted of 265 faculty members. From these, we removed 74 individuals who were either not attached to a grade level or not an administrator or coach (staff members such as librarians, guidance counselors, therapists, physical education teachers, K–5 special education teachers, etc.). The remaining 191 faculty members were administrators, coaches, or teachers primarily assigned to a grade level.
Table 7 shows two sets of models. The first set uses requests for assistance about the PBAs as the dependent variable, while the second set of models predicts requests for assistance about the Common Core. One way to think of these two sets of models is that PBAs are a concrete implementation activity, while the Common Core is a more overarching and distal implementation activity.
Models Predicting Performance-Based Assessment and Common Core State Standards Assistance

Note. Values presented in their original unit metric, unless otherwise noted. CCSS = Common Core State Standards; ICC = intraclass correlation coefficient; PBA = performance-based assessment.
Model 1 = null model. Model 2 = individual-level predictors. Model 3 = team-level predictors. Model 4 = full model.
p<.10 *p < .05. **p < .01. ***p < .001.
Each set first contains a null model that has no predictors and is a way of parsing variation among levels. The second model contains only individual-level predictors; the third model contains only team-level predictors; and the full model contains both individual- and team-level predictors.
Both sets of models contain the same set of independent variables, which, at Level 1, are individuals’ experience, mathematics and ELA CCSS knowledge, external resource access, and a set of dummy variables for position (administrator or coach, with teacher as the omitted reference group). At the team level (Level 2), each model contains team influence density (i.e., within-team requests for assistance), school transformation orientation (the 1–4 scale of degree of school transformation), and school size.
Looking first at the residual intraclass correlation of the null model for performance assessments, we can see that the proportion of variance in performance assessment influence that lay between teams was 77%, with 23% within teams. Both these estimates were significant, which shows that there was significant variation at each level to warrant a multilevel analysis. The addition of the individual (Level 1) predictors explained only an additional 6% of 23% of explainable variation at Level 1. The addition of the team-level predictors explained 61% of the 77% of explainable variation at Level 2. In the full model, the Level 1 variables explained 6% of the explainable Level 1 variation, and the team-level variables collectively explained 94% of the explainable Level 2 variation. The distribution of variation was fairly similar in the set of models predicting CCSS influence.
Turning to the full model predicting requests for assistance about PBA, we can see that experience and CCSS ELA knowledge were not associated with PBA requests for assistance. However, CCSS mathematics knowledge was associated with PBA assistance requests, with each 1-point increase on the mathematics knowledge test associated with almost a half (0.47) an additional request for PBA assistance. Accessing external resources about the CCSS was also associated (at the .10 level) with more requests for PBA assistance. Additionally, coaches and administrators both had significantly more requests (eight to nine) for assistance than did teachers, the reference group.
At Level 2, the density of team-level requests for PBA assistance was significantly associated with assistance requests about PBAs. In other words, individuals on teams who had relatively more conversations about PBAs were more likely to be sought after for information about performance assessments from those outside of their particular team. Additionally, there was a positive and statistically significant relationship between teams from schools that were more transformation oriented and PBA requests for assistance. That is, after controlling for all other predictors in the model, teams in transformation-oriented schools were associated with higher levels of advice seeking about PBAs. Finally, school size was also positively associated with PBA requests for assistance, which validates the decision to control for school size.
Turning to the full model (Model 4) that explained requests for assistance about the Common Core, we see a fairly similar pattern. At the individual level, we can see that mathematics knowledge was significantly associated (at the .10 level) with requests for CCSS assistance and that accessing external Common Core resources was also positively associated with being a recipient of requests for assistance about the CCSS. Similar to the PBA model, coaches and administrators received many more (eight and 11, respectively) requests for assistance about the Common Core than did teachers. At Level 2, only school size was associated with requests for CCSS assistance.
Study Limitations
This study contains several limitations in design, instrumentation, and analysis. In terms of design, the small sample of schools constrained our ability to generalize the results in a meaningful way. In addition, New York City is a unique context that has historically been highly decentralized and was in the midst of an ambitious multiyear reform effort to support CCSS implementation, which might further limit the generalizability of the findings to other district contexts. Additionally, our survey contained two limitations. First, the brevity of the three-item measure of Common Core knowledge restricts its utility as a measure to capture deeper levels of Common Core expertise. Second, we asked about requests for assistance only according to topics (CCSS and PBA), not by subject matter. This eliminated our ability to make potentially important connections between subject-specific knowledge and requests for assistance. Finally, our analysis contained too few schools to appropriately model school-level characteristics, which we therefore incorporated as Level 2 (team level) variables.
Discussion and Implications for Research and Practice
Developing instructional capacity is a central challenge of any reform effort that seeks to improve the core educational functions of teaching and learning in schools. While most conceptualizations of building teacher capacity focus on infusing expertise through externally introduced professional development experiences, they generally underestimate or ignore the expertise that already exists within schools. In this article, we explore the professional resources that reside inside schools that might be utilized to build instructional capacity from within.
This study focused on two particular internal resources for instructional improvement in this era of press to implement the Common Core: subject matter knowledge about the Common Core and communication patterns focused on implementing the standards. We found that relevant CCSS subject matter knowledge resided within schools and that this knowledge was generally shared by those who held it. However, we also found that CCSS mathematics and ELA knowledge was unequally distributed across schools and within teams inside schools. We also found multiple instances where CCSS knowledge was held by individuals who were not a CCSS resource for their peers, as well as cases in which those who were central hubs for CCSS implementation assistance did not hold particularly high CCSS knowledge, at least as indicated by our measures.
Furthermore, we found that coaches and administrators were more likely to be recipients for requests for assistance. These individuals also tended to have more CCSS subject matter knowledge than teachers, on average, and were more accessible than classroom teachers. While these influential individuals had significantly more knowledge about the Common Core in ELA and mathematics than the typical faculty member did, they were no more experienced. This suggests that their relative job flexibility provided them with greater access to knowledge about the CCSS.
We also found that CCSS mathematics subject matter knowledge was statistically related to one’s being a recipient for Common Core advice, but this relationship did not hold true for ELA. This subject distinction could have to do with faculty members’ lower comfort with mathematics or the larger perceived shift in expectations of the CCSS in mathematics. Understanding this subject matter difference is an important topic for subsequent research.
A final central finding from this study was the patterns of external resource seeking among study participants. External resource seeking was correlated with CCSS knowledge and those who were recipients of requests for advice from colleagues. That is, those with a thirst for professional knowledge about the Common Core who took the time to access external resources on the topic were more knowledgeable about the Common Core and more sought-after knowledge providers in their schools. In this correlational analysis, we cannot tell whether they were sought after because they had collected more knowledge about the CCSS from external resources or whether they collected more information to respond to questions posed to them by peers. These relationships are also subjects for deeper investigation.
These findings provide empirical substantiation for many of the suppositions introduced in the literature about the importance of spreading of knowledge through social networks within organizations (Cross & Parker, 2004; Daly, 2010; Lin, 2002). The study also raises important questions for subsequent research. Specifically, it raises questions about the presence and distribution of different kinds of important instructional knowledge that reside within schools and the ways that valued knowledge disperses among faculty. Our instrumentation to measure these important concepts was cursory, and subsequent research should attend more carefully to measurement and include larger samples in more diverse settings. Additionally, we are entering a new era when web-based external resources are increasingly assessable to school faculty to support professional improvement. Additional research is needed to understand how educators are making sense of this trove of resources and the way that school faculty members interpret and make use of them.
Finally, it was provocative that we found a positive association between transformation-oriented schools and requests for assistance about PBAs but not about the CCSS more generally. It would be important to investigate more carefully the relationship between schools’ orientation toward reform and patterns of the extent and diffusion of knowledge within them.
There are also important implications of these findings for school and district leaders. First, the findings provide evidence that there is underacknowledged and/or underutilized capacity that resides within schools and that this expertise can be better utilized to support instructional engagement. Leaders who seek to build on the instructional capacity within their schools and districts might explore mechanisms to identify this existing capacity and seek ways to share it among the staff. This might mean creating opportunities within schools for teachers to engage together around implementation challenges, structuring tasks that require teachers to question and learn from one another, or simply creating opportunities to exchange strategies or ideas. Additionally, the findings suggest that leaders should seek to identify those who hold the existing capacity within the organization and strategically make those individuals more accessible to those in need of support. These individuals should also be positioned to connect subgroups that are otherwise unconnected.
A second important takeaway for practice is that awareness and access to external resources is an important attribute for developing knowledge within schools. This is different from typical professional development that focuses on building and directing a particular capacity. Rather, access to resources means making sure that people (a) know what external resources are available to them, (b) provide school faculty members with the means to access external resources, and (c) even centrally create some of the resources that school faculty can access.
The choice of leading with rigorous standards as a lever for catalyzing dramatic changes in teaching to substantially improve student learning assumes that state and local educators will develop mechanisms to help teachers build the capacity to teach to these more challenging standards. This raises the essential question of where the capacity to teach differently will come from and how educational leaders will build the capacity of teachers to teach to new standards. In response, many districts have revved up their professional development systems and/or sought outside providers who claim to have special Common Core expertise. These are undoubtedly important aspects of a teacher capacity-building strategy. This article also provides supporting evidence that human and social resources exist within every school. Consequently, a dual strategy to build teacher capacity would build from the outside in as well as from the inside in. A synchronized internal and external capacity-building strategy can maximize the development and sharing of resources to meet the challenges posed by higher standards for student performance.
Footnotes
Appendices
Funding
This research was funded by the General Electric Foundation under Grant 4764727 to the Consortium for Policy Research in Education from December 2010 to November 2013. The views expressed in this paper are of the authors only.
Authors
JONATHAN SUPOVITZ is a professor of education policy and leadership at the University of Pennsylvania’s Graduate School of Education and co-director of the Consortium for Policy Research in Education (CPRE). 3440 Market Street, Suite 560, Philadelphia, PA 19104;
RYAN FINK is a research specialist at the Consortium for Policy Research in Education (CPRE), University of Pennsylvania, 3440 Market Street, Philadelphia, PA, 19104;
BOBBI NEWMAN is the director of Strategic Partnerships and Knowledge Hub, and research specialist, at the Consortium for Policy Research in Education at the University of Pennsylvania, 3440 Market Street, Philadelphia, PA 19104;