
Abstract
In recent years, states have significantly expanded access to prekindergarten (pre-K), and federal policy makers have proposed funding near-universal access across the country. However, researchers know relatively little about the role of subsequent experiences in prolonging or truncating the persistence of benefits for participants. This study examines the interaction between pre-K participation and one of our most important educational interventions—teaching quality. We pair student-level data from a statewide pre-K experiment with records of teacher observation scores from Tennessee’s new formal evaluation program to assess whether a student’s access to high-quality early grade teachers moderates the persistence of pre-K effects. Our analyses indicate a small positive interaction between teaching quality and state pre-K exposure on some but not all early elementary cognitive measures, such that better teaching quality in years subsequent to pre-K is associated with more persistent positive pre-K effects.
Advocates of early childhood education generally view preschooling intervention as a vital and underutilized tool to narrow racial and socioeconomic outcome gaps in school and beyond (e.g., Doggett & Wat, 2010). Opponents tend to argue that the benefits of the programs are too short-lived to justify the costs (e.g., Dalmia & Snell, 2008). One important way research can inform this debate is by developing a stronger understanding of the factors that contribute to or inhibit the persistence of preschool benefits. In this article we utilize data from a public pre-K evaluation in Tennessee, matched with school administrative records and data from a new teacher evaluation program, to examine the interaction between pre-K participation and a factor that is as elusive to measure as it is universally accepted as vital to student outcomes—teaching quality.
Pre-K Expansion and Effects
In recent years, state-financed preschool programs have expanded dramatically. Enrollment in the past decade in state programs has more than doubled, with several states going as far as offering universal programs (Hustedt & Barnett, 2011). President Obama has made a concerted effort to push legislation that would make universal pre-K access federal law. However much of the research cited by politicians supporting these types of broad expansions comes from a few resource-intensive targeted experimental programs that have demonstrated remarkable benefits (Campbell et al., 2008; Campbell et al., 2012; Heckman, Moon, Pinto, Savelyev, & Yavitz, 2010; Nores, Belfield, Barnett, & Schweinhart, 2005). Unfortunately, these model programs may have little in common with the type of programs states have implemented at scale and propose to grow in the future.
To answer the question of whether children who participate in a statewide public pre-K program make greater academic and behavioral gains than similar children who do not participate in the program, Vanderbilt University’s Peabody Research Institute (PRI) initiated a rigorous evaluation of Tennessee’s Voluntary Pre-Kindergarten Program (TN-VPK) in 2009. Funded by the Institute of Education Sciences and with the assistance of the Tennessee Department of Education’s Division of Curriculum and Instruction, this project utilized two primary designs, the first of which was a randomized controlled trial (RCT)—to evaluate TN-VPK. The other piece of the project utilizes an age-cutoff regression discontinuity design that exploits a sharp age cutoff requirement to compare 1-year gains for students who just meet the age requirement to those whose birthdays require them to wait a year before enrolling. In this study, we use data from the RCT as it permits evaluation of longitudinal program effects.
It is well documented that while pre-K programs drive early measurable cognitive gains (e.g., Bassok, 2010; Duncan, Bailey, & Yu, 2015; Gormley, 2008; Gormley, Gayer, Phillips, & Dawson, 2005; Lipsey, Hofer, Dong, Farran, & Bilbrey, 2013; Magnuson, Ruhm, & Waldfogel, 2007a; Weiland & Yoshikawa, 2013), the achievement effects tend to fade by third grade or sooner (e.g., Currie & Thomas, 2000; Deming, 2009; Magnuson, Ruhm, & Waldfogel, 2007b). Seemingly contradicting “fade-out” concerns, some report that benefits resurface in the form of improved outcomes like high school graduation, college going, and lower rates of incarceration later in life (Barnett, 1995; Currie & Thomas, 2000; Deming, 2009; Garces, Currie, & Thomas, 2002; Hustedt & Barnett, 2005; Ludwig & Miller, 2007). Sophisticated long-run evaluations of Perry Preschool (Heckman et al., 2010) and TN STAR (Chetty et al., 2011) have suggested that preschool and early elementary school quality (teacher experience, peer test scores, class size) interventions can benefit students’ long-run earnings dramatically even where early cognitive measure indicate fade-out, potentially through elevated “noncognitive” skills. However, while nonacademic skill acquisition may be the primary pathway by which early childhood interventions have improved students’ life outcomes, in the current education policy context of test score accountability, and a labor market that potentially places increasing weight on educational attainment, there are still reasons to explore levers to facilitate persistence of the apparent early cognitive benefits preschool interventions.
Most analyses of differences in persistence rates have focused on student characteristics, such as race, ethnicity, or some measure of socioeconomic status (Currie & Thomas, 2000; Gormley, 2008; Magnuson et al., 2007a), and have sometimes hypothesized that differential persistence rates, for example between Black and White Head Start participants, could be attributable to subsequent access to higher-quality schooling (Currie & Thomas, 2000; Lee & Loeb, 1995). This study seeks to better examine nonascriptive characteristics that lengthen or cut short the persistence of cognitive gains resulting from students attending a school-based voluntary pre-K program.
The Potential Moderating Role of Instructional Quality
There are several ways one might hypothesize that teaching quality in grades following pre-K could alter the persistence of pre-K effects. If higher quality teachers are better equipped to differentiate instruction and adjust to the higher levels of preparation of pre-K participants, one could expect the benefits of pre-K to persist longer or even grow. Students’ who attended pre-K might also be better equipped to benefit from strong teachers who emphasize more academically rigorous content. Alternatively, if better teachers emphasize catching up the least prepared students, the gap between the pre-K participants and control students could close more rapidly as targeting the least prepared student shifts attention away from the more prepared student. Students who had gotten the early preparation of pre-K could essentially flatline in terms of gain, or even have decreasing gains as progress is not maintained. Teachers whose instruction is of lower quality might slow the academic progress of either or both groups.
To our knowledge this is the first study to specifically examine the relationship between the formal evaluation rating of teachers to whom students are assigned after pre-K and the persistence of benefits students may have received from attending pre-K. Prior research has reported on the interaction of early childhood education and other more general school-level indicators of quality, including school test scores (Currie & Thomas, 2000) and measures of safety and academic environment (Lee & Loeb, 1995). Magnuson and colleagues (2007b) used two classroom quality measures—a teacher survey response to questions about the amount of time spent on instruction relative to other activities and data collected on the size of each classroom—to study the relationship between classroom experience and the persistence of preschool effects. They found that better scores on both classroom quality measures (i.e., small class size and high instructional time) were associated with a diminished preschool-related gap in student academic performance, while initial gaps in student performance persisted when children were enrolled in large classes or experienced smaller quantities of reading instruction. However, Bassok, Gibbs, and Latham’s (2015) recent working paper, which utilizes the same 1998 ECLS-K sample, as well as the 2010 sample to explore changes in persistence patterns, finds no consistent interaction between preschool experiences and kindergarten year quality measures, including class size, peer preschool experience, full-day kindergarten, and an index for quality.
Contributions of the Current Study
This study contributes to the existing literature on factors that moderate pre-K effect persistence in two of important ways. First, the preschool treatment in our study is relatively clearly defined. In contrast to studies that rely on responses to questions on nationally representative surveys to determine whether a student participated in center or school-based preschool (e.g., Claessens, Engel, & Curran et al., 2014; Deming, 2009; Magnuson et al., 2007b), which can mean very different things depending on where the respondent lives, our study examines a well-defined statewide program with relatively strictly enforced standards set by the Tennessee Board of Education. 1
Second, while prior studies have often relied on teacher self-reports of classroom conditions, our access to administrative data from Tennessee’s newly implemented teacher evaluation programs allows us to incorporate rare substantive information on the perceived quality of early grade teachers, whose students are generally untested and thus lack value-added measures of effectiveness. The primary component of the evaluation for teachers in nontested grades (including kindergarten and first grade) is a series of annual classroom observations conducted by a trained observer and spread across the year (four visits for fully licensed teachers and six visits for those operating on an apprentice license). Observation scores are based on a detailed statewide rubric where teachers are rated on a range of categories, within the domains of instruction, planning, environment, and professionalism (see Online Appendix A for a sample evaluation rubric). 2 Teachers of untested subject areas also have a component of their score determined by a state board–approved achievement test chosen in agreement between the teacher and the evaluator (e.g., SAT 10 or DIBELS), and a school level growth score. Ultimately, the composite of these measures is reduced to a 5-point rating scale, by which teachers are categorized as follows: 1 = significantly below expectations, 2 = below expectations, 3 = meets expectations, 4 = above expectations, 5 = significantly above expectations. 3 While observations and scoring are of course subjective, the consequences associated with different scores are relatively consistent across teachers. Scores above a Level 3 help teacher’s secure teacher tenure, and Level 5 ratings have been tied to salary bonuses and decreased oversight. These admittedly flawed though consequential categories are used as the primary measure for the construct of individual teaching quality in this study.
The main results from the TN-VPK evaluation found evidence of strong program effects on test scores at the end of the pre-K year (effect size of .33 on composite cognitive assessment). However, the cognitive gains experienced by program participants faded rapidly, with treatment and control groups being statistically equivalent on tested measures by the end of first grade (Lipsey et al., 2013). Access to longitudinal outcome measures and extensive administrative records on participants in this RCT presents ideal circumstances to explore the role of school-based factors in determining the persistence of pre-K effects. 4 In this article, we focus specifically on the interaction of TN-VPK exposure and the quality of a student’s kindergarten and first grade teacher, as measured by teacher evaluation ratings. Our analyses seek to answer two closely related primary research questions: To what extent does early grade teaching quality moderate the effects of attending TN-VPK? And does the magnitude of that moderated effect vary based on a student’s academic preparedness, specifically for students with low baseline cognitive scores and nonnative English speakers?
These questions are relevant to researchers and policy makers alike. For researchers, they offer some insight into the lingering questions about the drivers of fade-out, catch up, or persistence of early interventions. For policy makers, a positive interaction between pre-K participation and teaching quality would indicate that policies promoting the placement and retention of high-quality teachers in early, generally low-accountability grade levels could help prolong the cognitive gains made by students who participate in pre-elementary programs. Furthermore, if we hypothesize that higher rated teachers emphasize higher order skills, consistent with or building on those taught in pre-K, a positive interaction between pre-K participation and our measure of teaching quality should be most pronounced for students with the largest baseline deficits, who would otherwise lack the skills to benefit from instruction focused on more advance material. Evidence of pre-K providing this type of cognitive scaffolding has important implications for efforts to close stubborn academic achievement gaps.
Data and Sample
The data in this study come from two primary sources. First, student information and data were collected by researchers at PRI as part of a large-scale experimental evaluation of the TN-VPK program. Second, teacher evaluation records and supplemental student, teacher, and school information were collected by the Tennessee Department of Education (TNDOE) and processed for research purposes under a partnership between TNDOE and the Tennessee Consortium on Research, Evaluation, and Development at Peabody College, Vanderbilt University.
Construction of TN-VPK Experiment’s Intensive Subsample Analytic Sample
Prior to the start of the 2009–2010 and 2010–2011 school years, two cohorts of more than 3,000 total children applied to TN-VPK programs in schools targeted for the RCT portion of the study conducted by PRI. 5 Students were offered admission off randomly ordered applicant lists at oversubscribed sites across the state. Students and their families also had to be willing to participate in the piece of the experimental evaluation that directly assessed students across school years. PRI has followed (and is continuing to follow) both groups of students into later grades, those who were randomly admitted to the TN-VPK program and those who were randomly left on the wait list, collecting state data on the whole sample and directly assessing a smaller subsample (referred to as the Intensive Subsample [ISS]). While the counterfactual is a “business as usual” control that makes no adjustments to account for parents who sought out alternative preschool programs, a parent survey revealed that more than half of the ISS analytic sample stayed at home with a parent or other caregiver during the pre-K year. Just more than 11% enrolled in Head Start, and another 15% had formal private child care.
For a child to be included in the ISS, which is the sample of students we focus on in the current study, the child had to (a) meet all eligibility criteria for participation in the experiment, (b) have parental consent to participate in the study, and (c) be assessed by PRI staff at least once during the pre-K or kindergarten school year. 6 In addition, the consented, eligible children on a school’s applicant list were included in the ISS only if there were at least one consented, assessed child who participated in TN-VPK and at least one consented child that did not participate from that randomized applicant list. Furthermore, to construct the analytic sample, PRI restricted the analytic sample to the 1,076 students who were assessed at the end of pre-K. Students are treated as TN-VPK participants where administrative records indicate they attended a TN-VPK program, whether at their assigned school or at another location, for a minimum of 20 days. Conversely, control group nonparticipants were defined as students for whom administrative records do not indicate attendance of at least 20 academic days.
Primary Measures of Interest
The primary outcome variables of interest are generated from individual assessment data collected by the PRI to gauge the effectiveness of the TN-VPK program. Trained research staff assessed students in the fall and spring of the pre-K year and in the spring of each subsequent school year with a selection of subscales from the Woodcock–Johnson III Achievement Battery (WJ; Woodcock, McGrew, & Mather, 2001). The WJ battery is a standardized, longitudinally scaled assessment that is appropriate for a wide age range of test takers. Subtests used across years in the TN-VPK evaluation included two literacy subscales (Letter-Word Identification and Spelling), two language subscales (Oral Comprehension and Picture Vocabulary), and two math subscales (Applied Problems and Quantitative Concepts). A principal components factor analysis revealed that all the WJ scales were rather intercorrelated with high loadings on a single factor. The W-scores, a translation of the raw score which is not age-adjusted, on those scales were therefore averaged together to create a composite measure representing children’s overall achievement in literacy, language, and math. Our main analysis uses the composite WJ score as the dependent variable, while secondary analyses present findings using the subscales.
The primary indicator variables of interest come from the statewide educator evaluation system. In Tennessee, annual evaluations differentiate teacher performance based on a composite teacher effectiveness rating score, which is calculated using individual and school-level student growth scores and achievement data as well as teacher observations for teachers in tested and untested subjects and grades. 7 For all teachers included in the current study, 40% of the evaluation is comprised of student achievement data—25% based on school- or districtwide student growth as measured by the Tennessee Value Added Assessment System and 15% based on alternative measures of student achievement approved by the State Board of Education and selected through joint agreement by the educator and evaluator. The remaining 60% of the overall evaluation scores is determined through qualitative measures including teacher observations, student perception surveys, personal conferences, and reviews of prior evaluations and work.
An individual teacher’s effectiveness score can range from 0 to 500. TNDOE uses these raw scores to assign a teacher to one of five discrete performance categories. Denoting X as the teacher score, for all models teachers with X < 200 are categorized as significantly below expectation (Level 1), teachers with 200 ≤ X < 275 as below expectation (Level 2), teachers with 275 ≤ X < 350 as at expectation (Level 3), teachers with 350 ≤ X < 425 as above expectation (Level 4), and teachers with X ≥ 425 as significantly above expectation (Level 5). 8 Ratings reports provided to teachers include the discrete rating but not the underlying score on the 0 to 500 scale. We use these discrete ratings to create a series of teaching quality indicators, used in separate analytic models, including (a) a set of binary indicators for teachers whose overall evaluation rating make them subject to different sanctions or rewards (e.g., above Level 3 rating or below, above Level 4 evaluation score, etc.) and (b) a categorical indicator which represents a teacher’s specific final evaluation rating on the 1 to 5 scale.
There are a few concerns with regard to the matching of TN-VPK study student records to teacher evaluation data. First, because the teacher evaluation system was introduced in 2011–2012 school year, we lack kindergarten teacher evaluation records for students in the first experimental cohort who were already in first grade when the policy was introduced. For this reason we limit our primary analysis to the interaction of pre-K participation and first grade teaching quality. We do however present estimates using the second cohort to estimate the relationship between kindergarten teacher ratings and pre-K effect persistence, which did not show a significant interaction effect, a fact we attribute to the lack of variation in K-year teacher ratings (nearly 90% of students’ kindergarten teachers were rated 4 or 5).
Second, matching students to teachers relies on the accuracy and completeness of administrative records of course enrollment and teacher evaluation. Of the 1,076 students in the two cohorts of the ISS analytic sample, 972 were matched to at least one first grade core subject teacher (defined as self-contained, reading, language arts, or math). 9 However, a number of students have multiple teachers over the course of a given year due to transfers within or across schools. Following the TNDOE’s policy for assigning students to teachers for accountability purposes, in our primary analysis we apply a further restriction that students were taught by the assigned teacher for a minimum of 150 academic days, reducing the number of students with matched teachers to 897. Our final sample restriction is based on completeness of cognitive test scores and baseline student level covariates resulting in an analytic sample of 823 students.
Student-Level Characteristics and Baseline Group Equivalence
Baseline group equivalence is an important analytic and conceptual consideration in any group comparison, particularly given the consent rate issues in similar randomized studies. To that end, we first examined baseline differences on pretest scores and demographics (primarily from a parent questionnaire collected toward the beginning of the pre-K year) between the treatment and control groups. As evidenced by the unadjusted means for our analytic sample displayed in Table 1, students in the treated sample scored significantly higher on 3 out of the 6 baseline tests, were younger at the time of the pretest, were less likely to be Hispanic and nonnative English speakers, and had higher levels of parental education than the students in the control group. Nonparticipants also experienced a longer lag between the beginning of the pre-K year and their preassessments due to logistical challenges of administering tests to students who were not enrolled in school-based pre-K.
Student Differences at Baseline for Analytic Sample

Note. Means of baseline characteristics for the analytic sample treatment and control groups are presented in the first two columns. Mean difference column significance based on regression t test with SE clustered at the randomization list level. Mean differences on baseline tests are reported as standardized effect sizes for continuity with later tables. Adjusted mean difference column includes control for propensity score for TN-VPK participation to account for baseline imbalances in student characteristics. Analytic sample defined by students with complete records on all covariates included in the primary model.
Age at pre test is presented in years for the mean and days for the mean difference for clarity of interpretation.
Scale from 1 to 3 for regularity of usage.
Number of subscriptions form (0–4 or more) .
Mother’s education is on a 4-point scale from less than high school to more than associate’s.
p < .1. *p < .05. **p < .01.
To adjust for these baseline differences, we use a multilevel logit propensity score as a covariate in all models. 10 Although this method results in two statistically similar comparison groups across all but 2 of the baseline variables (Table 1, column 5), the propensity score adjustment may still be inadequate to account for bias contributed by unobserved characteristics that may have resulted in differential participation rates and are the primary threat to internal validity (Rosenbaum & Rubin, 1983).
Teacher Characteristics
Because the primary focus of this study is the relationship between pre-K participation and subsequent teaching quality, it is also worth examining briefly the characteristics of the students’ teachers, and any evidence of differential sorting associated with treatment or control status. The average first grade teacher of an experiment participant was a White female teacher, around 40 years of age, with roughly 12 years teaching experience, and an overall rating of 3.7, equating to a high meets expectation rating. There were no significant demographic differences between treatment and control group teachers. However, treatment students were slightly more likely to be taught by teachers rated Level 5, and less likely to be taught by teachers rated Level 4 by roughly 10 percentage points. 11 Notably, the propensity score adjustment for baseline imbalances in student characteristics, makes these differences statistically insignificant for the primary analytic sample, reducing concerns about sorting of students to different first grade teachers (Table 2, column 5).
Teacher Characteristics of Students in the Sample
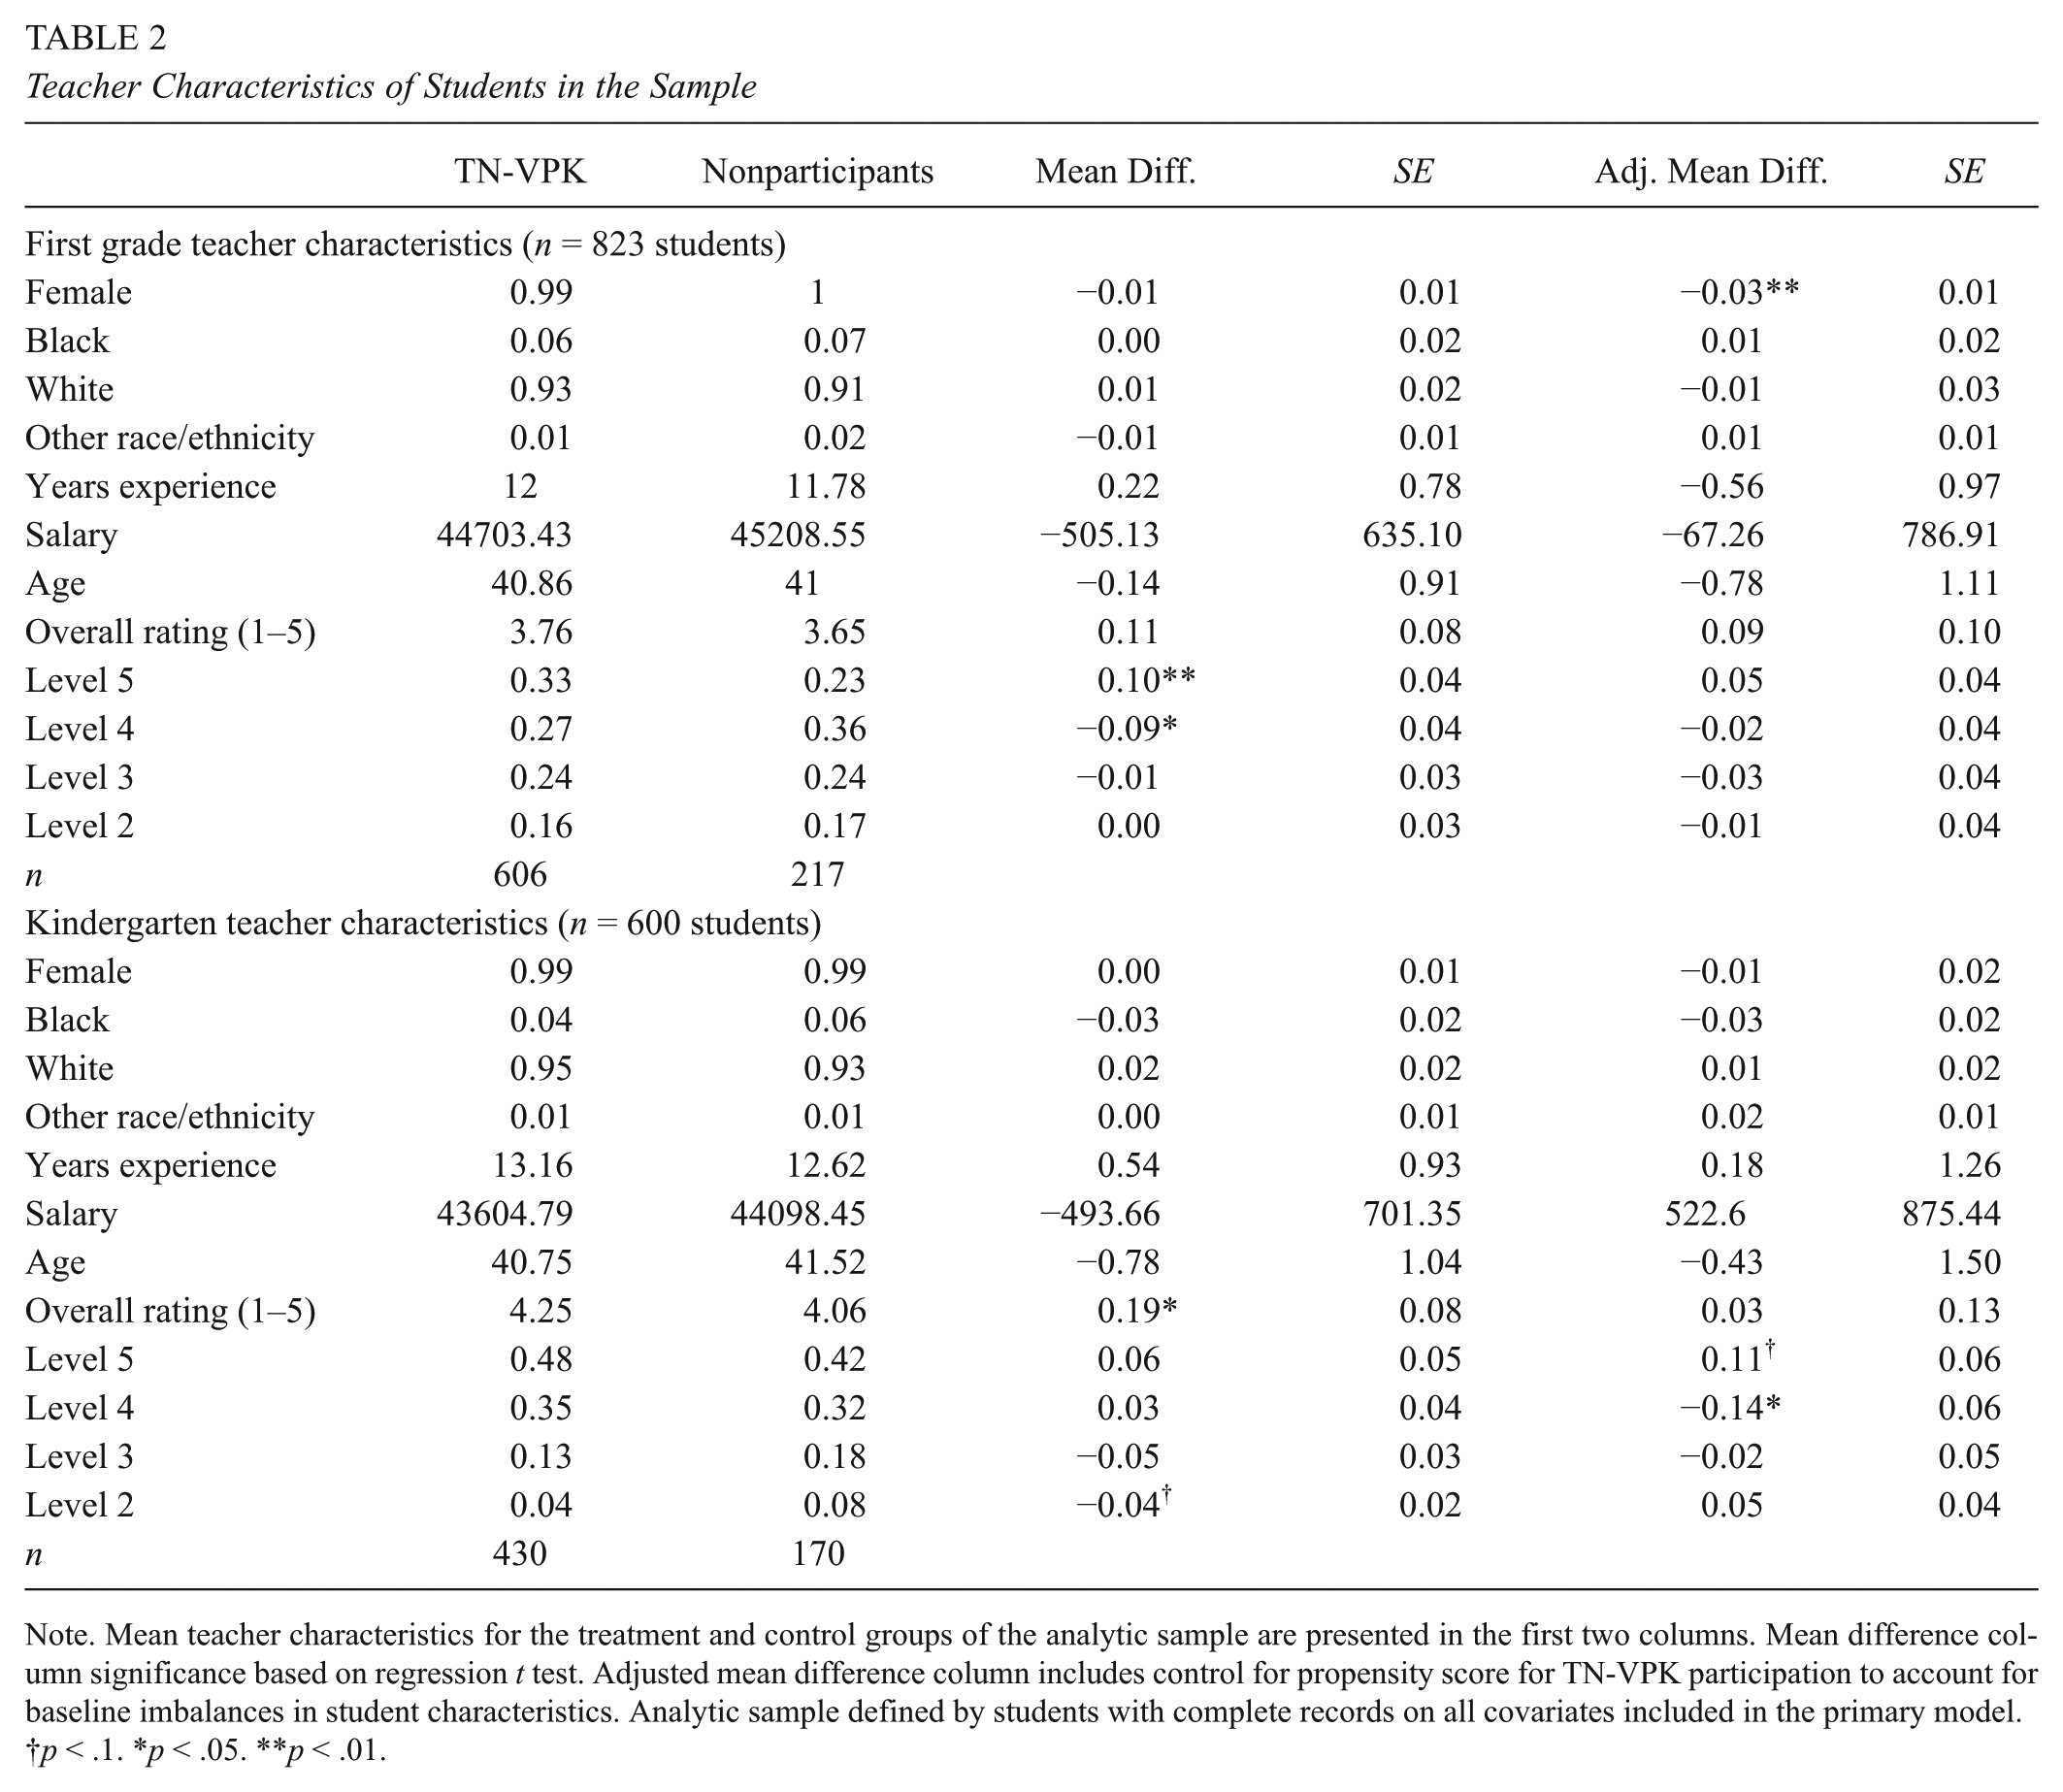
Note. Mean teacher characteristics for the treatment and control groups of the analytic sample are presented in the first two columns. Mean difference column significance based on regression t test. Adjusted mean difference column includes control for propensity score for TN-VPK participation to account for baseline imbalances in student characteristics. Analytic sample defined by students with complete records on all covariates included in the primary model.
p < .1. *p < .05. **p < .01.
Differential Attrition
Another potential source of bias is differential attrition. Since the ISS analytical sample attrition is addressed extensively by Lipsey and colleagues’ (2013), and it appears to be relatively minor and remain balanced across the treatment and control groups (attrition is less than 5% and 4% for the treatment and control group, respectively), we simply present Figure 1, which is a visual consort diagram that shows where participants are excluded at various stages prior to the generation of the sample matched with TEAM teacher evaluation data. Overall, attrition in the ISS sample is of minimal concern as more than 95% of the sample was located and included at the end of each year, and attrition was not differential by experimental condition. Of the analytic sample, 897 students (823 with complete set of controls and cognitive scores) at the end of first grade were matched with TEAM teacher evaluation data (those students who were not enrolled in their first grade year could not have first grade TEAM scores). 12 However, it is worth noting, as discussed above, that low consent rates functionally present the same threats as conventional attrition, for which we ultimately attempt to mitigate through quasi-experimental strategies described in the section that follows.
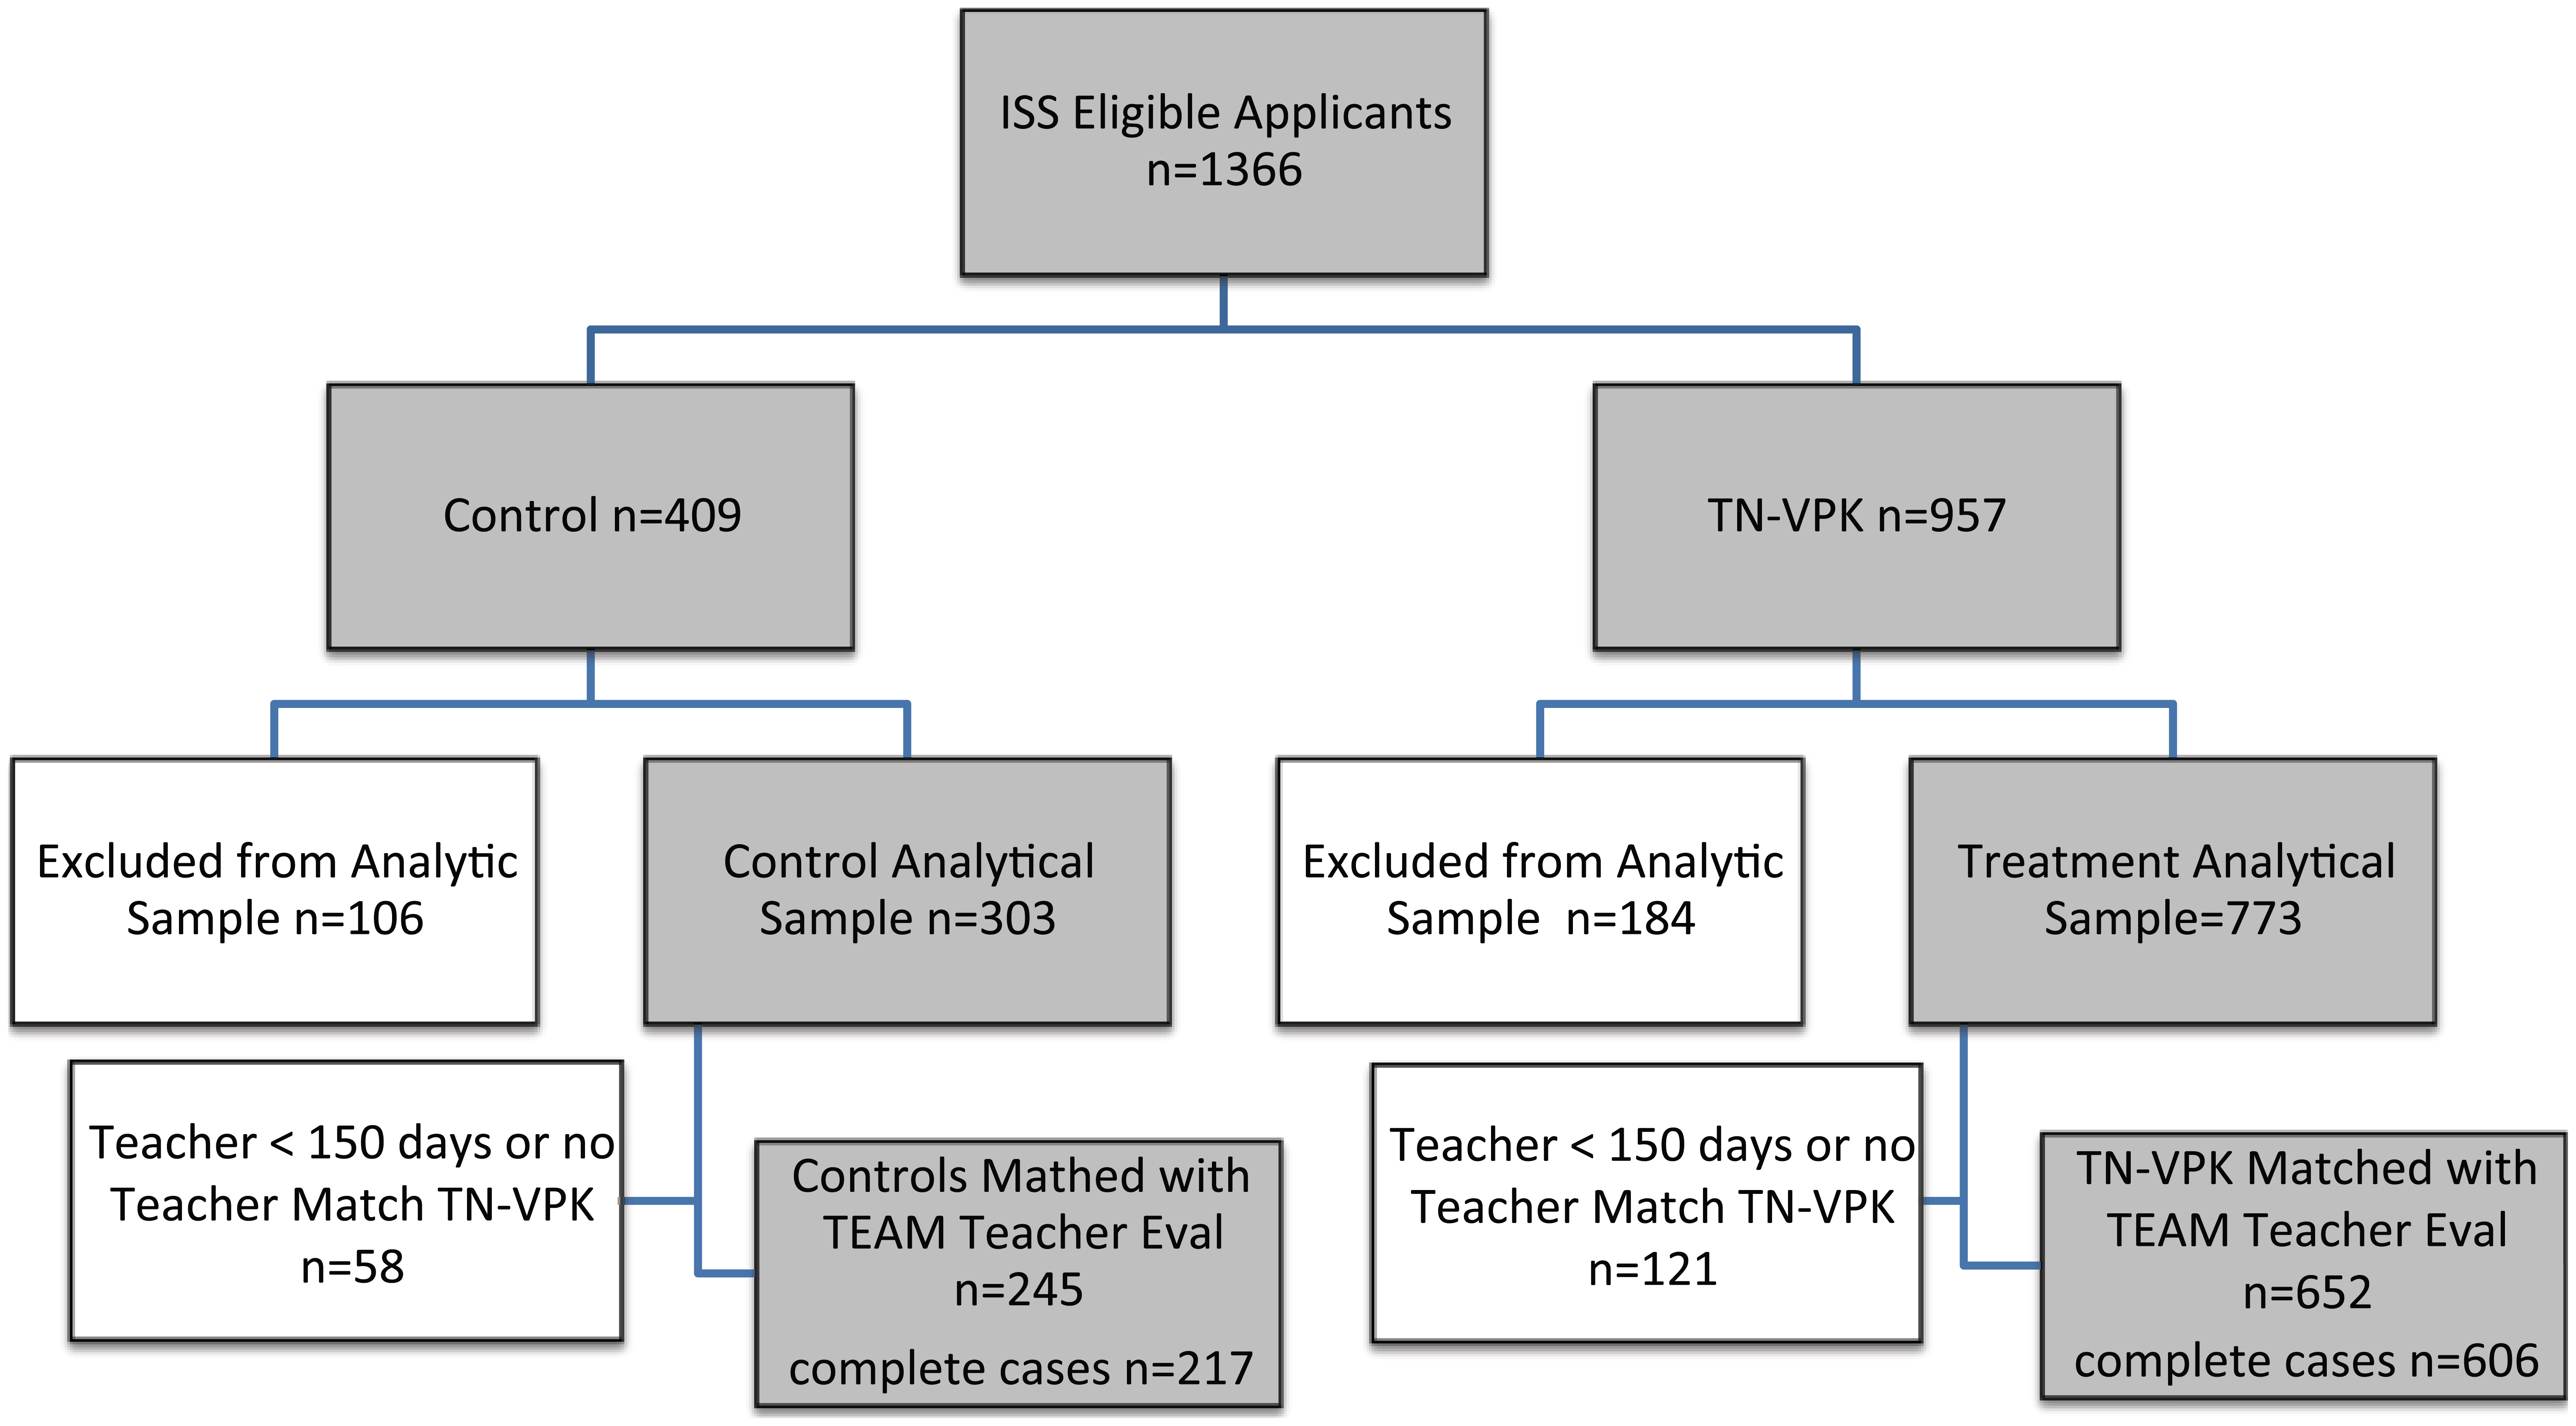
Consort diagram for both cohorts of pre-K study participants.
Analytical Strategy
Our primary research question is: to what extent does early grade teaching quality moderate the persistence of pre-K effects? To inform this question, we focus on the interaction of pre-K participation and teaching quality as it correlates with student achievement, which we interpret as approximating the effect of early grade teaching quality on the persistence of pre-K effects. The moderating effect is identified using two primary configurations of overall teacher ratings: (a) a categorical indicator which represents a teacher’s specific final evaluation rating on the 1 to 5 ordinal scale and (b) a set of binary indicators for comparing teachers who surpass a performance threshold (i.e., rated above 2, above 3, above 4) to those teachers who score below it.
Ideally we would derive this effect estimate from two overlapping experiments, where students were randomly assigned to pre-K and then randomly assigned to teachers with different quality ratings. However, baseline imbalances between “treatment” and “control” students combined with an inability to rule out the potential of students differentially sorting to teachers of varying effectiveness levels necessitate the use of an extensive list of control variables and a propensity score as covariate strategy to attempt to minimize the role of selection in what is ultimately a nonexperimental framework. Our primary ordinary least squares (OLS) regression model takes the following form,
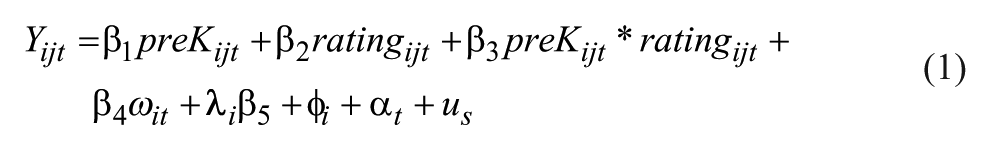
where, Y
ijt
is the composite WJ test score measure in first grade for student i, in classroom j, at time t.
The estimate on
Take, for example, when ratingijt equals 1 if a teacher’s overall evaluation rating is a Level 5 (highly effective) and 0 if a teacher received an overall evaluation rating below 5 (exceeds expectation or lower). The impact of TN-VPK on the first grade test scores of students with a Level-5-rated teacher can be found by adding the estimate on the coefficient from the interaction term to those of the main effect of TN-VPK and the Level 5 rating indicator (
For our subgroup analysis, we estimate a variant of Equation 1 that includes a three-way interaction. A difference-in-difference-in-difference estimand allows us to address our secondary research question: does the magnitude of the moderated effect of TN-VPK on first grade skills based on teaching quality vary based on a student’s academic preparedness, specifically for students with low baseline cognitive scores and nonnative English speakers? The model mirrors that described above, but adds a three-way interaction term, interacting exposure to TN-VPK, first grade teaching quality, and the student characteristic of interest, to assess heterogeneity in response to pre-K and subsequent teaching quality.
Results
Our primary finding is that students who participated in TN-VPK consistently perform better in first grade with higher rated first grade teachers than students with similarly rated teachers who did not participate in TN-VPK. While differences are generally small in magnitude (effect sizes from .10 to .24) and somewhat sensitive to model specifications, the general result of a positive interaction between pre-K participation and first grade teacher ratings is markedly consistent. Figure 2 illustrates this relationship graphically, plotting the covariate adjusted mean WJ composite scores for “treatment” and “control” students over time based on whether or not they were ultimately taught by teachers who earned the highest overall rating. The gap between the lines for TN-VPK participants and similarly situated (by teacher rating) nonparticipants approximates the “pre-K effect.” Students in all groups exhibit convergence after the end of pre-K. However, in Level-5-rated classrooms, the TN-VPK students continue to slightly outperform control students in similarly rated classrooms by the end of first grade, while the pre-K participants are overtaken by the comparison group in all other classrooms.

Adjusted mean WJ composite W scores for TN-VPK vs. nonparticipants, by first grade teacher effectiveness ratings (Level 5 vs. non–Level 5 teacher effectiveness rating).
Teaching Quality, Pre-K Participation, and Composite Cognitive Scores
We next quantify the positive interaction between first grade teacher ratings and TN-VPK using a series of related regression models, and again find that students who participated in TN-VPK consistently perform better in first grade with higher rated first grade teachers. As discussed above, we analyze separately the linear effect of steps up the teacher effectiveness rating scale, and binary indicators for each of the performance thresholds. Table 3 presents five distinct regression models and report estimates as standardized mean difference effect sizes. Model 1 presents the main effect of first grade teacher ratings using the 1 to 5 ordinal scale on students’ achievement scores, without accounting for pre-K participation but controlling for the full set of covariates, and shows that in general students with higher rated teachers perform roughly 0.06 standard deviations better for each 1-unit scale improvement in teacher rating.
First Grade Teacher Quality × Pre-K Interactions on Woodcock–Johnson (Both Cohorts)

Note. Coefficients represent differences in standardized WJ composite W-scores at the end of first grade. All models include the full set of baseline covariates including the composite pretest and propensity score. The first column presents the main effect of first grade teacher ratings, column 2 examines the interaction of the continuous rating (1–5) with pre-K participation, columns 3–5 present the interaction for pre-K participation and a series of binary indicators for teacher rating thresholds. Robust standard errors clustered at the r-list level are presented in parentheses.
p < .1. *p < .05.
Model 2 examines the moderating effect of the same overall teacher rating (1–5) on effect estimates for TN-VPK participation on first grade scores using the same propensity score and full baseline controls as covariates strategy discussed in Lipsey and colleagues (2013). The coefficient on overall teacher rating can now be interpreted as the achievement difference for control group students with higher rated teachers, which is now statistically indistinguishable from zero. The large negative coefficient on the pre-K indicator should be interpreted as the theoretical average performance of a pre-K student with a zero-rated teacher, and the positive coefficient on the interaction term indicates that for each improvement in teacher rating, students who participated in pre-K perform on average roughly 0.10 standard deviations better. This continuous model illuminates an important trend: teaching quality as measured by overall evaluation ratings appears to matter more for students who participated in pre-K, than those who did not. However, it is difficult to interpret practically, as it imposes a linear relationship on a teacher rating that is not normally distributed.
For ease of interpretation, Models 3–5 present a series of binary interactions comparing the effect of pre-K participation on students taught by teachers on either side of a performance threshold. In each of the 3 comparisons, TN-VPK participants perform worse than nonparticipants with the lower rated teachers. In Model 3, which focuses on the comparison of low-rated teachers (1 and 2) compared to more highly rated teachers, none of the estimates are statistically significant, though patterns are consistent with those for the other cutoffs. In classrooms where teachers are rated below 4 (column 4 of Table 3), TN-VPK students on average score a statistically significant 0.17 standard deviations below their control group peers.
However, the positive coefficient on the interaction term for pre-K and above-3 indicates that pre-K participants perform 0.20 standard deviations (significant at the .10 level) better with teachers rated 4 or better. Notably, the difference in performance for the group across this teaching quality threshold is not large enough in magnitude to equate to persistence of a pre-K effect. Across all models, control group students consistently score no better with higher rated teachers than control students with lower rated teachers (coefficient is negative though statistically insignificant).
Column 5 shows a similar pattern of positive interaction between teacher rating and pre-K participation, with a slightly larger magnitude. Also, the negative effect or pre-K participation in the lower rated teacher group is smaller here, which should not be surprising as it now includes teachers rated as high as Level 4. Combining the relevant coefficients, pre-K students with teachers rated Level 5 on average outperform similarly situated control group student by roughly 0.12 standard deviations. 14
Differences by Grade Level
While our primary results focus on the role of first grade teaching quality (where we have teacher ratings for both cohorts of the TN-VPK experiment) in relation to the persistence of pre-K effects, we also assess whether the same patterns hold for teachers of students in their kindergarten year. As stated above, because the TN teacher evaluation system was instituted after the first cohort of the study already completed kindergarten, any multiyear analysis is restricted to the second cohort. For simplicity, we focus here on the model estimating the interaction of TN-VPK exposure and the continuous (1–5) teacher rating, with the sample restricted to the analytic sample of cohort 2 (n = 430 treatment, 170 control). Notably, the interaction between first grade teacher ratings and TN-VPK exposure is qualitatively similar to that of the combined cohort estimate. The second and third columns of Table 4 shows that with each step up the teacher rating scale, students who went to TN-VPK perform 0.10 standard deviations better than their control group peers, when we account for K-year teacher ratings (column 3) and their interaction with pre-K participation (column 2). However, the interaction with kindergarten teacher ratings is statistically zero when predicting end of K cognitive scores (column 1).
Teacher Rating × Pre-K Interaction on WJ Composite at K and First Grade (Cohort 2 Only)
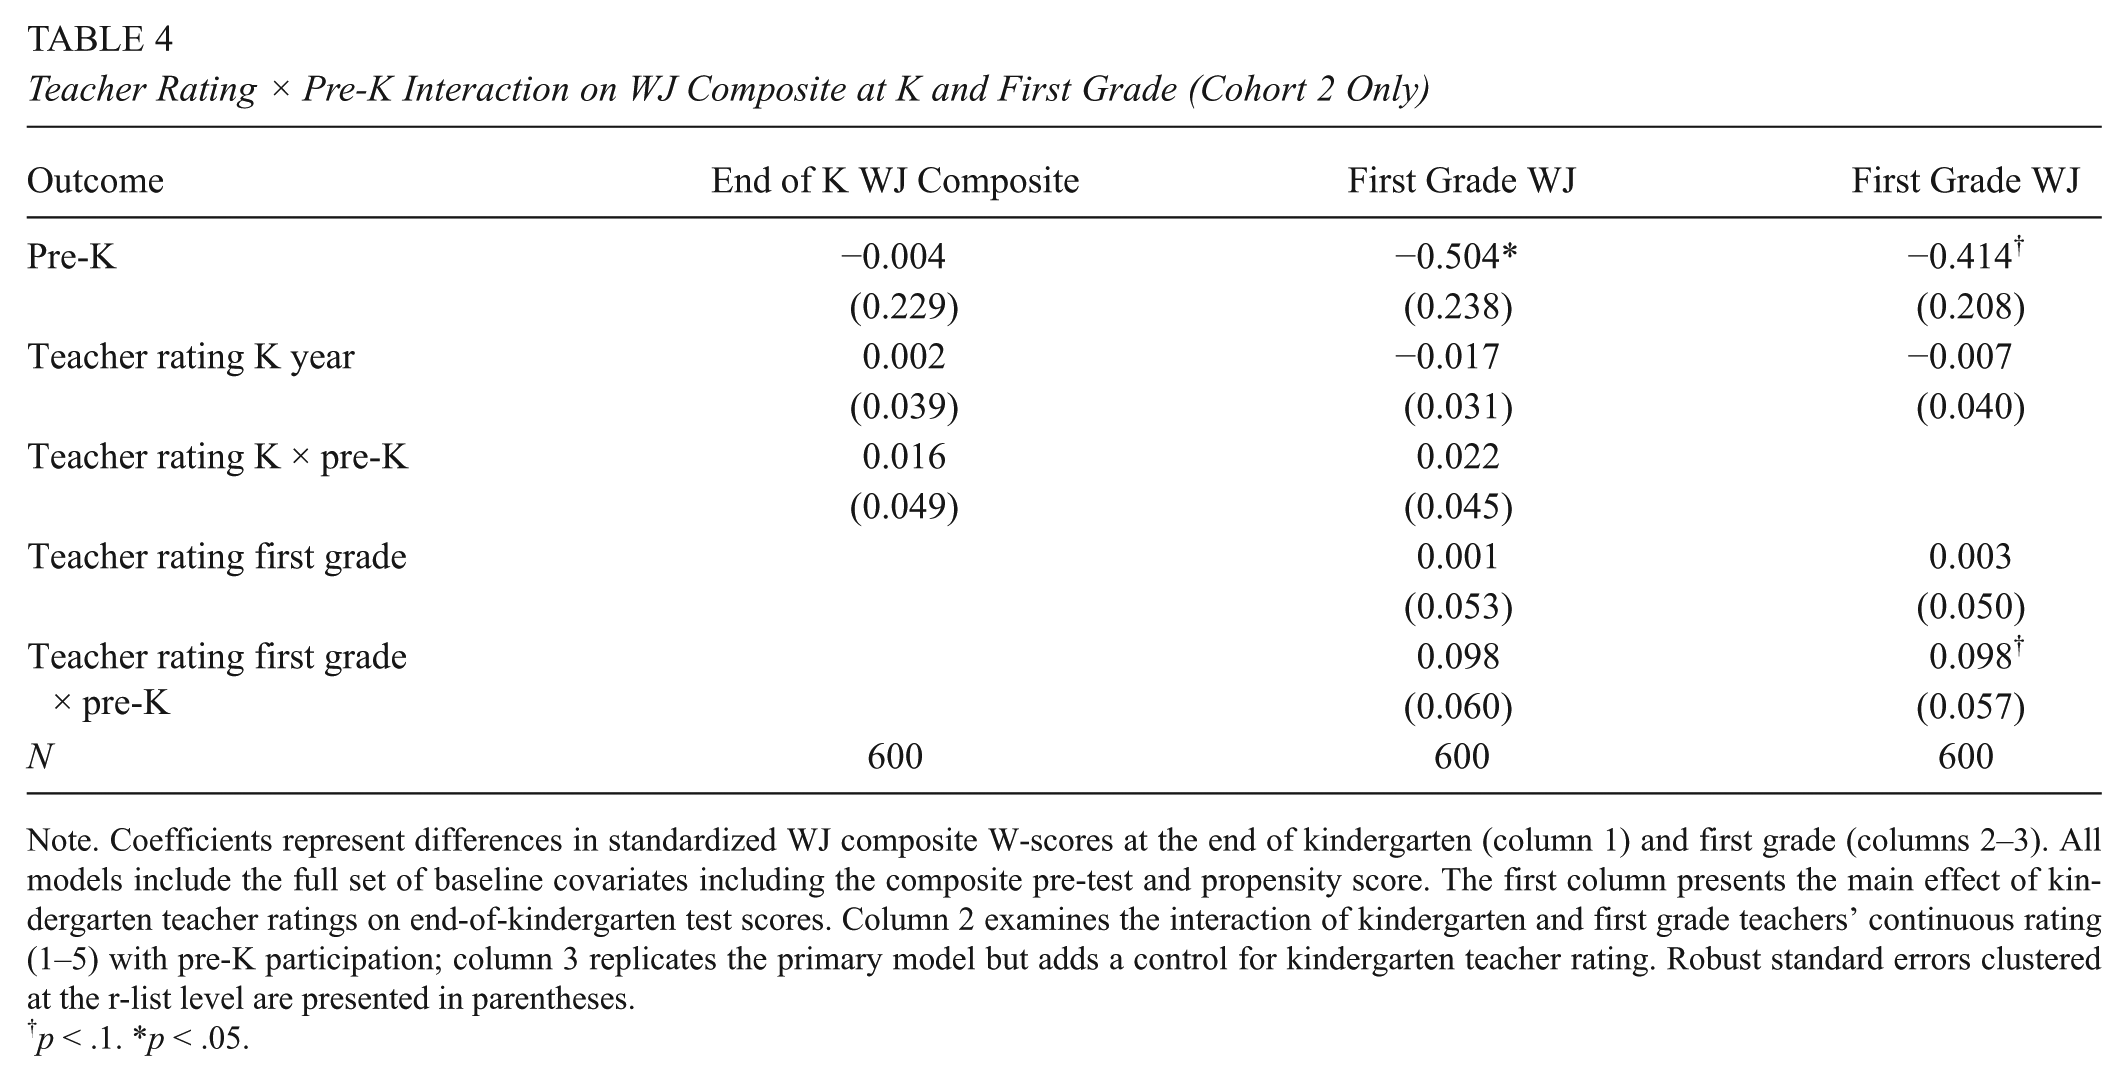
Note. Coefficients represent differences in standardized WJ composite W-scores at the end of kindergarten (column 1) and first grade (columns 2–3). All models include the full set of baseline covariates including the composite pre-test and propensity score. The first column presents the main effect of kindergarten teacher ratings on end-of-kindergarten test scores. Column 2 examines the interaction of kindergarten and first grade teachers’ continuous rating (1–5) with pre-K participation; column 3 replicates the primary model but adds a control for kindergarten teacher rating. Robust standard errors clustered at the r-list level are presented in parentheses.
p < .1. *p < .05.
One plausible explanation for this apparent discrepancy is that the principal ratings of kindergarten teachers could have less to do with instructional techniques that might promote larger cognitive gains than their ratings of first grade teachers who are closer to a tested grade year. To test this hypothesis we constructed a crude value-added-like measure, predicting students’ test score gains based on their teacher rating. In their first grade year, students taught by higher rated teachers made significantly larger gains on the composite cognitive measure (more than 0.5 standard deviations per step up the rating scale). However, a student’s kindergarten teacher rating had no discernable relationship to the their cognitive test score gains in the kindergarten year.
Differences by Student Academic Preparedness
One potential mechanism by which teaching quality might moderate the effects of pre-K participation is by serving to counteract home-based barriers to academic success. Students who had particularly low cognitive scores prior to enrollment in pre-K and students with limited English language backgrounds could be particularly receptive to the combination of preschool and subsequent higher quality instruction. To test these hypotheses, we examine whether the relationship between pre-K participation and teacher ratings differs based on students baseline cognitive scores or English language background through separate three-way interaction models. Tables 5 and 6 present the results of separate regressions mirroring the form presented above but including a three-way interaction term for binary indicators for a student being a nonnative English speaker or scoring in the bottom quartile of the sample on the baseline composite WJ battery. 15 The three-way interaction terms for each model show a consistent and large, significant trend. For both groups, students with lower relative baseline cognitive scores and students who do not speak English as a native language, the interaction between teaching quality and pre-K participation is particularly important (effect size roughly 0.5 for Level 4 teachers and 0.9 for Level 5).
Three-Way Interaction With Indicator for Low (Bottom Quartile) Student Baseline Scores

Note. Coefficients represent differences in standardized WJ composite W-scores at the end of first grade. All models include the full set of baseline covariates including the composite pretest and propensity score. The columns present the three-way interaction among pre-K participation, low baseline cognitive scores (bottom quartile), and a series of binary indicators for teacher rating thresholds. Robust standard errors clustered at the r-list level are presented in parentheses.
p < .1. *p < .05. **p < .01.
Three-Way Interaction With Indicator for Nonnative English Speakers
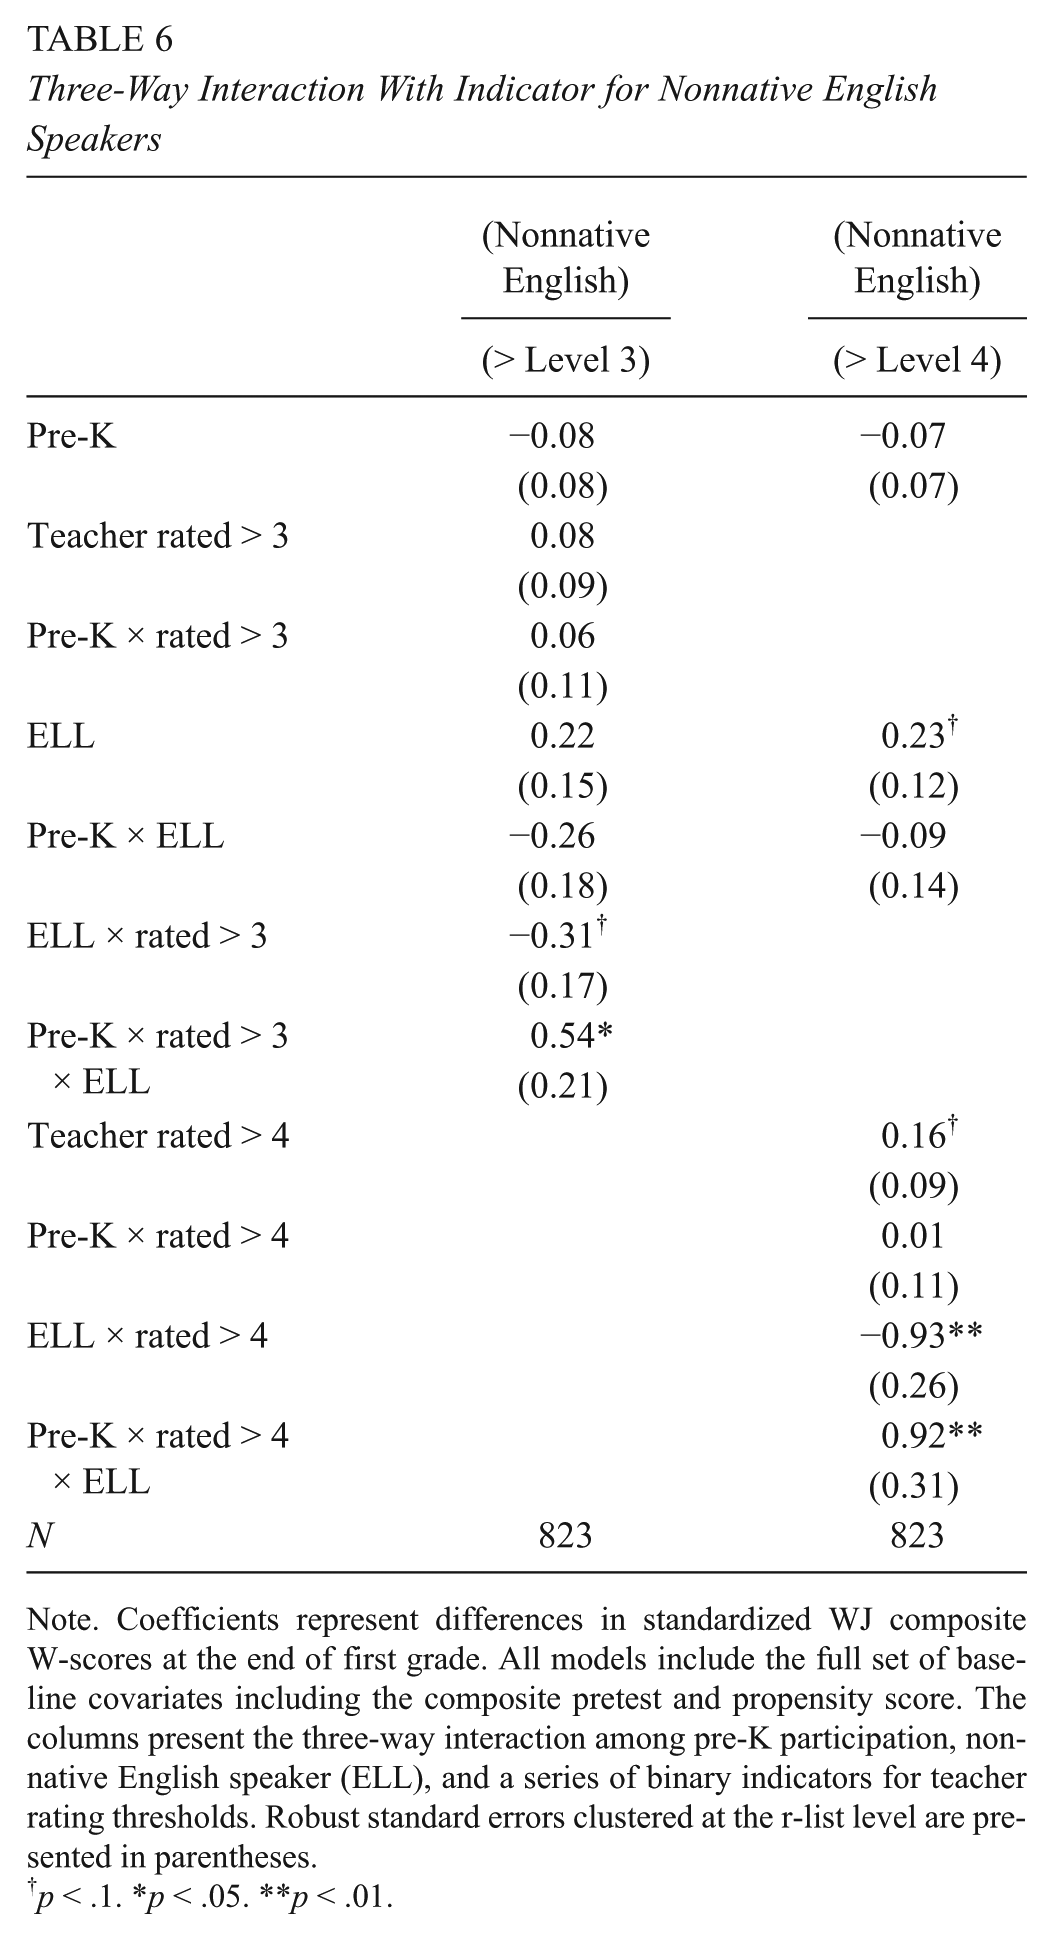
Note. Coefficients represent differences in standardized WJ composite W-scores at the end of first grade. All models include the full set of baseline covariates including the composite pretest and propensity score. The columns present the three-way interaction among pre-K participation, nonnative English speaker (ELL), and a series of binary indicators for teacher rating thresholds. Robust standard errors clustered at the r-list level are presented in parentheses.
p < .1. *p < .05. **p < .01.
While the number of students in the subsets that drive these three-way interactions is admittedly small (210 and 158 for low-baseline test score and nonnative English speakers, respectively), the large magnitudes of the coefficients are indicative of something more than a chance relationship. These estimates indicate that one possible explanation for the positive interaction between teacher ratings and pre-K participation is that TN-VPK participation helps elevate students’ capacity to benefit from high-quality instruction by mitigating problematic baseline deficits. One might also argue that early grade teaching quality moderates the persistence of pre-K gains most for students whose home environments might otherwise counteract the benefits of their early childhood investment.
Sensitivity Analysis—Alternative Modeling Strategies, Sample Compositions, and Tests for Positive Sorting
We conducted a series of analyses to explore whether our findings are sensitive to alternative modeling strategies and sample composition, or subject to bias in the form of positive sorting. First, to account for the role of potential interclass correlations, we replicated the above analyses using a three-level hierarchical linear model with random intercepts at the school randomized list and district levels. Like the primary models, we include the full set of covariates and propensity scores. Results do not differ substantially from those presented in our primary OLS models with clustered standard errors (see Online Appendix E). We also estimate school fixed effect models that include dummy variables for each school that students attend in first grade, making coefficients interpretable as driven by within-school variation (Online Appendix F), and randomization list fixed effects that could be interpreted as within neighborhood estimates, as students generally applied to programs proximate to their homes (Online Appendix F). Although significance levels vary based on the amount of variance left in the comparison group (e.g., within school, within neighborhood), the magnitudes of effect size estimates are qualitatively similar across all modeling strategies.
Next, we examined if our estimates were sensitive to alternative sample composition. Our primary analytic sample includes all students, for whom the full set of cognitive measures and student level covariates are available and that were accurately matched with an evaluated teacher three years after pre-K application (first grade for 95% of students). The question of how to address the role of students’ kindergarten grade-level retention is complicated by the fact that the retentions can be understood as intermediate pre-K effects. Thus, adding an indicator for “on grade level” to the model would introduce bias to the estimates of pre-K effects. However, because the pre-K participants were less likely to be retained in their kindergarten year than students in the control group as detailed by Lipsey, Weiland, Yoshikawa, Wilson, and Hofer (2015), we might be concerned that teacher evaluations for the control group in the third year of the study were more often reflecting ratings of kindergarten teachers, who might be evaluated differently, for example receiving higher ratings for an emphasis of lower-level concepts in their instruction. To simplify the construct of “first grade teaching quality,” we re-create our primary estimates with an alternative sample limited to students who are on grade level, and thus taught by first grade teachers. Estimates from this reduced sample (Online Appendix C) are slightly smaller in magnitude and lose some statistical significance, but are qualitatively similar to those from the more inclusive preferred model.
On the other end of the inclusiveness spectrum, we estimate the same models presented throughout the article with missing data imputed for the full 1,076 students included in the Lipsey et al.’s ISS analytic sample. Online Appendices G–I present results from a multiple imputation strategy using multivariate normal regression techniques. We replace missing values with multiple sets of simulated values to construct an analysis file, apply standard analyses to each completed dataset, and adjust the obtained parameter estimates for missing-data uncertainty (Marchenko, 2010; Rubin, 1987). Here, the objective is not to predict missing values as close as possible to the true ones but to handle missing data in a way resulting in valid statistical inference. Given that fewer than 10% of cases had missing data for any given analytic variable, it is not surprising that results were qualitatively similar to analyses that were restricted to complete cases.
Next, we checked for the possibility of students differentially sorting into classrooms which could introduce bias into the estimated interaction terms that are the focus of this study. Using the continuous form of the students’ teacher rating as the outcome variable, we run a series of models with the same set of covariates describe above to check for an interaction between student scores the previous year and pre-K participation status when predicting the rating of the teacher to whom the student will be assigned. If the coefficient on the interaction were significant, it would elevate concerns that higher-scoring pre-K students were assigned to higher-rated teachers more frequently than their similarly situated control group peers. However, the fact that these coefficients are statistically insignificant is consistent with the argument that, after controlling for the observed characteristics, preschool exposure does not alter the nature of the sorting into classrooms. The small, though statistically significant, coefficient on test scores from the end of pre-K indicates that there may be some positive sorting of students into classrooms, where higher scoring students end up with higher-rated teachers. However, the near zero interaction between the test score and pre-K participation when predicting first grade or average 2-year teaching quality indicates that the sorting mechanisms are similar for both treatment and control students (see Online Appendix J).
To further allay concerns that positive interactions with first grade teaching quality simply highlight differences in pre-K effects among students that were derived prior to their placement with higher or lower rated teachers, we also model a simple falsification test, where we replicate our primary models, but substitute the outcome of kindergarten cognitive scores. Because these exams were administered prior to any interaction with the first grade teachers, significant interaction terms would be indicative of a false attribution of causality (though we acknowledge the inability to draw causal conclusions). None of the coefficients in the model are statistically significant. However, the direction of the relationship is consistent with our primary findings, allowing for the possibility of an underlying trend that preceded the subsequent significant relationship (Online Appendix K).
Discussion
The results reveal some important patterns. The relationship between TN-VPK participation and first grade teaching quality appears to matter. All else equal, students who participate in TN-VPK appear to consistently perform better with higher rated teachers than nonparticipants. This positive interaction between first grade teaching quality and pre-K participation also seems to be most important for students who entered pre-K scoring in the bottom portion of the sample or with limited English skills. One possible explanation for these findings is that the high-rated teachers in our study have adjusted their teaching emphasis to account for higher levels of preparedness due to the expansion of TN-VPK in recent years, or have received training that emphasized more challenging early academic curriculum in response to accountability policies. To the extent that the teacher teaches to the full group, this elevated content emphasis could have negative effects on the control students but benefit students who participated in pre-K.
Recent work by Engel, Claessens, and Finch (2013) demonstrated a negative association between overemphasis of low-level math concepts and student achievement. Similarly, if poorly rated teachers struggle with classroom management, the disruptive environment could result in a convergence of cognitive measures, as pre-K students fail to build on earlier gains. If the higher-rated first grade teachers in our study had stronger classroom management skills or spent more time on challenging concepts and tasks, both of which are factors in the Tennessee observation rubric, it is plausible that such an environment would facilitate greater learning among the pre-K participants than their control group peers, who do not appear to benefit measurably from placement in higher rated classrooms.
The positive interaction between TN-VPK participation and teaching quality could also be interpreted as TN-VPK preparing students (particularly those with language barriers or more pronounced early cognitive deficits) to benefit more from high-quality teachers. If cognitive scaffolding (e.g., Berk & Winsler, 1995) from TN-VPK helped prepare students who might have otherwise struggled with literacy, language, and math, it is not surprising that we see large positive interactions between teaching quality and pre-K participation in these areas.
It is also worth noting that while our primary measure of teaching quality (an overall rating from the consequential statewide evaluation system) has the merits of being more objective than self reports and being composed of multiple measures, it is still subject to the threat of a considerable amount of measurement error in capturing the elusive construct of “high teaching quality.” Any noise in the measure, or competing elements (e.g., high-level instruction vs. differentiation) in the construct of “good teaching” itself, have the potential to attenuate estimated effects toward zero. Moving forward, research should further examine alternative and more specified metrics of teaching practices and their interaction with students’ earliest educational experiences.
The question at the core of this study is the intersection between two of the most prominent aims of contemporary education policy—expanding access to preschool learning opportunities and access to high-quality teachers for traditionally disadvantaged students. Our findings are consistent with the understanding that either intervention without the other is inefficient, if not all together inadequate. When we invest public dollars in providing preschool to students from impoverished homes, the longitudinal test-score effects fade rapidly in elementary classrooms with poor quality teachers. Alternatively, students who have experienced the TN preschool program, tend to benefit more from high-quality teachers than they otherwise would. These findings suggest that policy makers interested in maximizing the cognitive impacts of preschool initiatives should work to ensure access to high-quality early grade teachers. This could be facilitated through policies that discourage school administrators from shifting experienced or effective teachers to later tested grades or through the institution of recruitment and retention bonuses for talented early grade teachers in hard-to-staff schools. 16
As the students from the Tennessee Pre-K experiment progress into tested grade areas, our analysis will expand to estimate cognitive effects for the full sample (approximately 3 times the size and not subject to bias from differential consent rates) and to include teacher test score value-added measures in our construct of teaching quality. Also, the inclusion of additional years of teacher evaluation data will enable more rigorous techniques to account for the potential bias contributed by nonrandom sorting of students into classrooms, which (along with differential consent rates) poses a substantial barrier to causal interpretations of the present results. Furthermore, as students progress to grades where documented disciplinary actions or absenteeism are more common, we can explore the interactions of teaching quality measures and some proxies for the noncognitive effects, which Chetty and colleagues (2011) have shown to better predict long-term impacts. If the findings presented here hold, we can begin to establish a working theory around the ingredients necessary for measures of preschool cognitive gains to persist.
Footnotes
Acknowledgements
We appreciate helpful comments and suggestions from Dale Ballou, Amy Claessens, Dale Farran, Mimi Engel, Gary Henry, and Mark Lipsey, as well as seminar participants at the annual meetings of the Association for Education Finance and Policy, Association for Public Policy Analysis and Management, and Society for Research on Educational Effectiveness. We would also like to acknowledge the many individuals at the PRI, the Tennessee Consortium, and the Tennessee Department of Education for providing data and expert insight to conduct our analyses, in particular Carol Bilbrey, Janie Hughart, Chris Ham, Rick Feldser, Ilknur Sekmen, Susan Burns, Trish Kelly, Erin O’Hara, Art Peng, Matthew Pepper, and Nate Schwartz, as well as assessors across the state. Any errors remain the sole responsibility of the authors. The views expressed in this article do not necessarily reflect those of sponsoring agencies or individuals acknowledged. Kerry G. Hofer was senior research associate at Peabody Research Institute during the completion of this study.
Declaration of Conflicting Interests
The author(s) declared no potential conflicts of interest with respect to the research, authorship, and/or publication of this article.
Funding
The author(s) disclosed receipt of the following financial support for the research, authorship, and/or publication of this article: This study was supported by the Peabody Research Institute (PRI) and the Tennessee Consortium on Research, Evaluation, and Development (the Consortium), both of which are located at Vanderbilt University’s Peabody College. PRI conducted the Tennessee-Voluntary Pre-K experiment with funding from the Institute of Education Sciences (Grant R305E090009). The consortium is funded by the state of Tennessee’s Race to the Top grant from the U.S. Department of Education (Grant S395A100032).
Notes
Authors
WALKER A. SWAIN is a PhD student in Leadership and Policy Studies at Vanderbilt University’s Peabody College of Education and Human Development. His research focuses on the impacts of education and social policy on traditionally disadvantaged populations.
MATTHEW G. SPRINGER, PhD, is an assistant professor of public policy and education at Peabody College of Vanderbilt University and the director of the National Center on Performance Incentives. His research focuses on incentives, accountability, and compensation.
KERRY G. HOFER is an associate/scientist at Abt Associates, Inc. She holds a PhD in teaching and learning with a focus on research methodology from Vanderbilt University. The majority of her research involves rigorous evaluations of early educational programs and practices.
References
Supplementary Material
Please find the following supplemental material available below.
For Open Access articles published under a Creative Commons License, all supplemental material carries the same license as the article it is associated with.
For non-Open Access articles published, all supplemental material carries a non-exclusive license, and permission requests for re-use of supplemental material or any part of supplemental material shall be sent directly to the copyright owner as specified in the copyright notice associated with the article.