
Abstract
While early studies found participation in public prekindergarten reduced the need for later special education services, recent studies of large-scale programs yield mixed results. Using a randomized controlled trial of the Tennessee Voluntary Pre-Kindergarten (TN-VPK) program, we find that TN-VPK students were more likely to have an individualized education program at all timepoints through sixth grade. These differences were driven by increased identification of speech-language impairment in the early grades and specific learning disabilities in the later grades. The increased participation in special education does not fully explain previously reported negative findings for all TN-VPK students on achievement and disciplinary outcomes. We conclude by proposing potential mechanisms that may explain these concerning findings and make recommendations for future research.
Preceding the COVID-19 pandemic, the number of students enrolled in state-funded prekindergarten programs steadily increased across the United States for several years, with 34% of 4-year-olds served in such programs in 2020 (Friedman-Krauss et al., 2022). While there was some post-pandemic recovery, the total number of children enrolled remained lower in 2022 than in 2019 (Friedman-Krauss et al., 2024). Simultaneously, the proportion of children between the ages of 3 and 5 receiving special services through the Individuals with Disabilities Education Act (IDEA) also increased over the past decade, peaking in 2022 at over half a million children nationwide (Our Kids Count, 2024). While these two trends may not be causally related, the relationship between the expansion of publicly funded prekindergarten and special education is of great interest to educators, policymakers, and advocates in both the early childhood and special education fields. The call for increasing access to public prekindergarten, beginning with Darlington et al. (1980), has at least in part been predicated on the assertion that earlier identification and intervention for students with disabilities will lead to better long-term academic outcomes for those students and subsequent savings for taxpayers (Gillette-Mallard, 2015; Heckman, 2012). The argument that increased pre-K attendance will substantially reduce later need for special education services however, while supported by early studies (McCoy et al., 2017), was called into question by more recent evaluations of large-scale programs (Durkin et al., 2022; Lipsey et al., 2018; Watts et al., 2023; Weiland et al., 2020).
Special Education in Early Childhood
The most common category for special education classification in young children for many years was speech-language impairment (SLI), closely followed by developmental delay (U.S. Department of Education, 2017, 2018, 2019). In recent years, developmental delay surpassed SLI as the most common disability category for children aged 3 to 5 (U.S. Department of Education, 2020, 2021). Students in these two disability categories comprise 70% to 80% of 3 to 5-year-olds served through IDEA. SLI includes a variety of communication disorders including “stuttering, impaired articulation, a language impairment, or a voice impairment” (IDEA, 20 U.S.C § 1400 (2004) Sec 300.8(c)(11)). Developmental delay is a broad category for students aged 3 to 9 that may include delay in one or more of the following: “physical development, cognitive development, communication development, social or emotional development, or adaptive development” (IDEA, 20 U.S.C § 1400 (2004) Sec 300.8(b)(1)). Normal developmental differences in this age range combined with vast inequities in resources make identifying disability in young students difficult.
Various factors play a role in determining which young students are likely to receive special education services. Shapiro (2023) found that the youngest students in a kindergarten class were 40% more likely to be placed in special education than the oldest students, and SLI classifications primarily drove this effect. Very low birth weight and externalizing problem behaviors also increased children’s likelihood of receiving SLI services, while Black children and children with home languages other than English were less likely to receive early SLI services (Morgan et al., 2016). Low birth weight and other perinatal factors also raised the risk for developmental delay classification in preschool-age children (Delgado et al., 2007).
These two classifications, SLI and developmental delay, are distinguished from disabilities with unequivocal biological markers, in that they result from interactions with societal expectations (Farran & Shonkoff, 1994; Hebbeler & Spiker, 2016); they depend on professional judgment as to whether behaviors fall within normative developmental patterns (Fletcher et al., 2024). In most cases, each of these classifications begins with a teacher recommendation for evaluation (Fish, 2022). In several publications, Fowler (2019, 2023) raised concerns about the overlap in most states between teacher licensure in early childhood, typically pre-K–3rd grade and elementary licensure, K–5th or K–6th grade, and the fact that in most states teachers with an elementary license can easily add on an ECE endorsement. His concerns involve the differences in preparation between the two teacher certifications, notably that an early childhood license involves a focus on the child, while an elementary license focuses on curriculum (Fowler, 2024). Issues related to exceptionality are much less frequently covered in elementary programs. This fact may place young children with possibly transient developmental differences at risk of being labeled early as needing special services. Also, the younger the children are, the more difficulty a teacher has drawing the line between typical and atypical variations in development (Fletcher et al., 2024).
In addition to initial identification for services, many young students experience declassification or reclassification. Declassification or “exiting” occurs when a new evaluation determines that the student no longer requires special education services. Reclassification occurs when a student’s disability category changes to meet that student’s unique needs better. Shinde and Maeda (2019) found that fewer than half of 3-year-olds with individualized education programs (IEPs) experienced consistent classification in the 4-year study period covering ages 3 to 7. Nearly 30% were declassified and no longer received services; an additional 5.9% were declassified but later became eligible to receive services again, and the remaining 64% of the students were reclassified at some point during the observation period. Such findings highlight the need to track disability status over time when evaluating longitudinal impacts rather than focusing on a single distal timepoint.
Over/Under Identification for Special Education by Race
There is considerable debate in recent years over whether students of color are appropriately identified and served by current special education systems (Morgan & Farkas, 2015; Welner & Skiba, 2015). While students of color, and especially Black students, are a larger proportion of the special education population than the general population, when controlling for covariates such as family income and academic ability, students of color are less likely to be identified as needing special education services than similar white peers (Morgan et al., 2017, 2018). Since thresholds for disability classification vary between schools, districts, and states, students with mild disabilities or delays are subject to strong location impacts on their disability classification. Many schools are still largely segregated by race and socioeconomic status (SES), and these location impacts often play out along the expected paths of race and class with less-resourced schools struggling to provide services to all the students who could possibly benefit from intervention.
Long-Term Effects of Special Education
The net benefit of participation in special education is difficult to determine, especially for students with mild disabilities who spend most of their time in general education contexts. Recent policies in Texas capped both overall special education enrollments and also the disproportionality of special education enrollments among racial groups. Evaluations of those changed policies found that in general students who lost access to services they had previously received due to the overall enrollment cap were less likely to finish high school and enroll in college (Ballis & Heath, 2021b). Conversely, when the cap on disproportionality was imposed, Black students who were declassified as needing special education services became more likely to finish high school and enroll in college (Ballis & Heath, 2021a). Spillover effects following the same pattern were also observed: general education students experienced negative outcomes when special education enrollment caps were imposed, but positive outcomes from disproportionality caps.
Students classified as having a learning disability in the early grades face consequences. They are less likely to take college prep courses in high school (Shifrer et al., 2013). In addition to achievement outcomes such as high school completion and college enrollment, there is a complex relationship between special education classification and school discipline. There is well-documented evidence that students with disabilities, especially Black students with disabilities, are more likely to be suspended from school (Gage et al., 2019).
Pre-K Attendance and Special Education
In small programs implemented in the 1960s and 1970s, the long-term effects of pre-K attendance showed a reduced need for later special education services for pre-K attendees, both in terms of how many children ever required services and for how many years students received services on average (Campbell & Ramey, 1995; Darlington et al., 1980; Schweinhart et al., 1985). Cost–benefit analyses of these programs asserted that they provided an excellent return on investment, in part due to reduced K–12 spending on special education services (Barnett & Masse, 2007; Heckman, 2006). These early landmark studies were small, took place in a single location, were research-based, and were highly targeted at families living in poverty or whose children were determined to be at risk. In addition, programs varied between one like Abecedarian that provided full-workday, full-year care and others that also included parental involvement and/or wrap around services. It is important to remember that these small programs were implemented before the passage of The Education for All Handicapped Children Act of 1975 (PL 94-142; Zettel & Ballard, 1979); thus, the programs were not likely to serve children with disabilities, and there were no special services to which teachers could refer children of concern.
For these reasons, it is critical to explore the effects of current, scaled-up pre-K programs, ones that serve more diverse and much larger student populations living in generally better socioeconomic and environmental conditions and that do not include all the intervention components of programs such as Abecedarian or Perry Preschool, but do include special education services for children 3 to 5 years old.
More generalizable studies of contemporary programs show mixed results for the long-term special education outcomes for state-funded pre-K attendees. Examining the effects of state funding to counties, Watts et al. (2023) found no effect on county rates of special education placements from North Carolina’s early childhood initiatives. Weiland et al. (2020) and Gray-Lobe et al. (2023) found no effect on long-term special education participation for attendance in Boston PreK. Barnett and Jung (2021) found weak but positive effects for the Abbott preschool program in New Jersey through 10th grade. More concerning are the findings from a randomized controlled trial of Tennessee’s public pre-K program. Durkin et al. (2022) found that students who attended Tennessee’s Voluntary Pre-K (TN-VPK) program had a higher incidence of special education placements through sixth grade.
A similarity among these findings is that results are reported generally for nearly all special education recipients. Most researchers specify that giftedness and low-incidence physical disabilities are excluded from their analyses; however, greater specificity around the disability classification behind a student’s IEP could better clarify the connection between special education placements and pre-K attendance. Additionally, researchers have typically reported the incidence of special education participation at specific but largely arbitrary time points or over a range of years, while little detail is given to the timing of initial classification, the duration of services, or the possible interaction effects between pre-K attendance and demographic characteristics on special education classification. Furthermore, if the mechanism by which pre-K attendance reduces the later need for special education services is early identification, more attention should be given to those students who are identified as needing services during the pre-K or kindergarten year and how delivery of those services progresses compared to non-attendees.
TN-VPK Effects Through Sixth Grade
Like other longitudinal studies of public pre-K programs, the initial results of the TN-VPK study indicated positive effects for students who attended TN-VPK on a range of student learning outcomes at the end of the pre-K year (Lipsey et al., 2013a). Also, in line with other studies of public pre-K, these impacts were not sustained, and by the end of kindergarten, TN-VPK students were performing similarly to students in the control condition (Lipsey et al., 2013b). Additionally, these early reports found that TN-VPK students were more likely to have an IEP, typically for SLI, a finding generally interpreted as a positive sign that students in need of services were being identified early in their education. Follow-up analyses at third and sixth grade, however, showed that not only had the gains TN-VPK students made in pre-K faded, TN-VPK students were actually performing significantly worse than students in the control condition on state achievement tests, had more disciplinary infractions, and the higher rate of disabilities in the TN-VPK group first identified in kindergarten persisted beyond the time period that could be considered early identification (Durkin et al., 2022; Lipsey et al., 2018). These findings were and are surprising and alarming. The special education outcomes in particular run counter to what prior, often-cited research suggested—that pre-K attendance should reduce the need for later special education services.
In this article, we expand on these previously reported findings by examining the special education outcomes of the TN-VPK sample in much greater detail than past reports. Past studies, both those of the TN-VPK program and other longitudinal studies of pre-K outcomes, have typically treated special education status as a simple, binary outcome with little attention given to the complexities of different disability classifications or variation in the timing of identification of students with disabilities.
We specifically seek to answer the following research questions to provider a clearer and more nuanced understanding of the special education outcomes for students in the TN-VPK sample: (a) To what extent do treatment and control children differ in the timing and duration in which students are designated as needing special education services resulting in an IEP? (b) To what extent are there changes over time in the specific disability categories into which treatment and control students were placed? and (c) To what extent do increased special education placements explain previously reported impacts on other outcomes, especially performance on state achievement tests and disciplinary outcomes?
Method
Participants
This study builds on previously reported findings from an evaluation of the long-term impacts of the TN-VPK program. Begun as a pilot program in 1996, full implementation of the VPK program occurred in 2005. The state department of education directs the program that serves more than 18,000 children statewide. Grants are given to individual districts. At the time the program started, the VPK program met nine of the 10 standards advocated by the National Institute for Early Education Research (Barnett et al., 2009) for state supported pre-K programs. The program requires a minimum instructional time of 5.5 hr per day during the academic school year. Classrooms have a maximum of 20 students, including one licensed teacher and an assistant, and are to follow an approved curriculum from a state list. Teachers are paid and have benefits consistent with the state salaries for elementary teachers. Almost all (93%) of the classrooms are housed in public elementary schools.
The children in this sample attended the TN-VPK program during the 2009–2010 and 2010–2011 school years. It is worth noting that since then, the Tennessee legislature passed Chapter 703 of the Public Acts of 2016 (CTS Legal Staff, 2016) that resulted in changes to the program, such as supporting curriculum implementation, reducing the number of curricula considered high-quality and approved for use by the Tennessee Department of Education (TDOE), and shifting to a competitive grant application based on program quality. It is an open question whether the findings presented here and previously would replicate with the current program.
This study began with the close involvement and cooperation of the TDOE. The TN-VPK program had a hierarchy of criteria for eligibility to apply; the top priority was family income qualifying for free or reduced-price lunch. Other risk factors include characteristics such as homelessness. In 2009 to 2010, only 42% of eligible 4-year-old children could be served by the program; hence, there were many programs in which there were more applications than there were seats. TDOE conducted a survey to identify programs that expected to be oversubscribed after which it informed those oversubscribed that they were eligible to participate in an evaluation of TN-VPK. Most programs agreed to participate; each sent the list of applicants to their program to the research team that then returned the list in random order within 24 hours. If seats in the classroom were pre-designated, that seat was not open to randomization. Programs could designate seats in a classroom for particular students; in almost all cases the pre-designated seat was allocated to a child with a disability. Rarely the seat involved a child who qualified for another reason (e.g., military family) or who was accepted because a sibling attended the school. No pre-designated seats were included in the randomization. Two cohorts were recruited with this procedure (2009–2010 and 2010–2011).
TN-VPK programs were asked to fill the available seats by first offering admission to the child at the top of the randomized list and then going down the list in order until all the available seats were filled. Programs were asked to try to contact parents at least three times on different days and times to offer admission. If the program could not reach the parent, or the parent declined the offer, they went to the next child on the list. Once a program had admitted enough children to fill its seats, any remaining children were put on a waiting list and offered admission in order, if an additional seat became available. All the children in randomized order through the last one who was offered and accepted admission via this process became the intent-to treat (ITT) treatment group, including those earlier on the list that the program had been unable to reach or who declined. Those remaining below them on the randomized list became the ITT control group.
This process did not require parental consent as the children were followed in the state database, and the project evaluated the effectiveness of a state program with TDOE approval; all data were de-identified in analysis files.
Across the two cohorts, this procedure generated 150 randomized lists (R-Lists). However, some R-Lists were discarded because the VPK classroom was blended with other support or did not include at least one eligible child who attended VPK and one child on the control list. These criteria resulted in 111 R-Lists from 79 programs in 29 school districts across the state and included 3,131 children. Of these children, 2,990 had a record in the state education database for at least 1 year of attendance at a Tennessee school following pre-K.
The 2,990 children in the full randomized sample are those participants who were eligible and applied for VPK on one of the randomized lists, and who were present for at least one school year in the state education database after prekindergarten. Of the 2,990 children in the full randomized sample, 1,852 were offered admission while the remaining 1,138 were not. The control group averaged 39% across R-Lists, depending on the number of spots available for a program and how many families were interested in enrolling. These groupings made up the ITT treatment and control conditions. Of the 1,852 children assigned to TN-VPK, 1,608 ultimately attended a VPK program while 244 did not attend. Of the 1,138 children assigned to the control condition, 389 ended up attending a TN-VPK program, while 749 complied with the control condition assignment. These compliers, crossovers, and no-shows result in treatment-on-treated (TOT) conditions in which there are 1,997 TN-VPK attendees and 993 non-attendees.
While our evaluation sample constituted only a portion of those who attended TN-VPK classrooms during the years we recruited, TDOE supplied us with a list of characteristics they identified as representing differences among the programs across the state, such things as urban/rural and the region of the state (the full list is outlined in the section below on covariates used in the analyses). There were slight differences in proportions of some categories for our TN-VPK sample and the statewide program. Our sample contains more children from the central/west region of the state, which includes Nashville, and an underrepresentation of White students with a concomitant over representation of Hispanic children. Those characteristics and others are controlled for in the analyses.
Analyses reported here are based on observed data, not imputed data. The N’s reported in each table, therefore, will vary from the 2,990 in the original sample. Table 1 presents demographic data for the entire sample as well as those in the sample who were or were not assigned to attend VPK (i.e., the ITT conditions) and those who ultimately did and did not attend VPK (i.e., the TOT conditions). Table 2 presents data on the available sample from kindergarten to sixth grade. Our sample retention rate has been exceptionally strong. In Table 2 and through the remainder of the article, we use the term “Grade” to designate the follow-up years a student was expected to be in even though some children may have been retained in grade.
Demographic Characteristics by Treatment Assignment and Participation
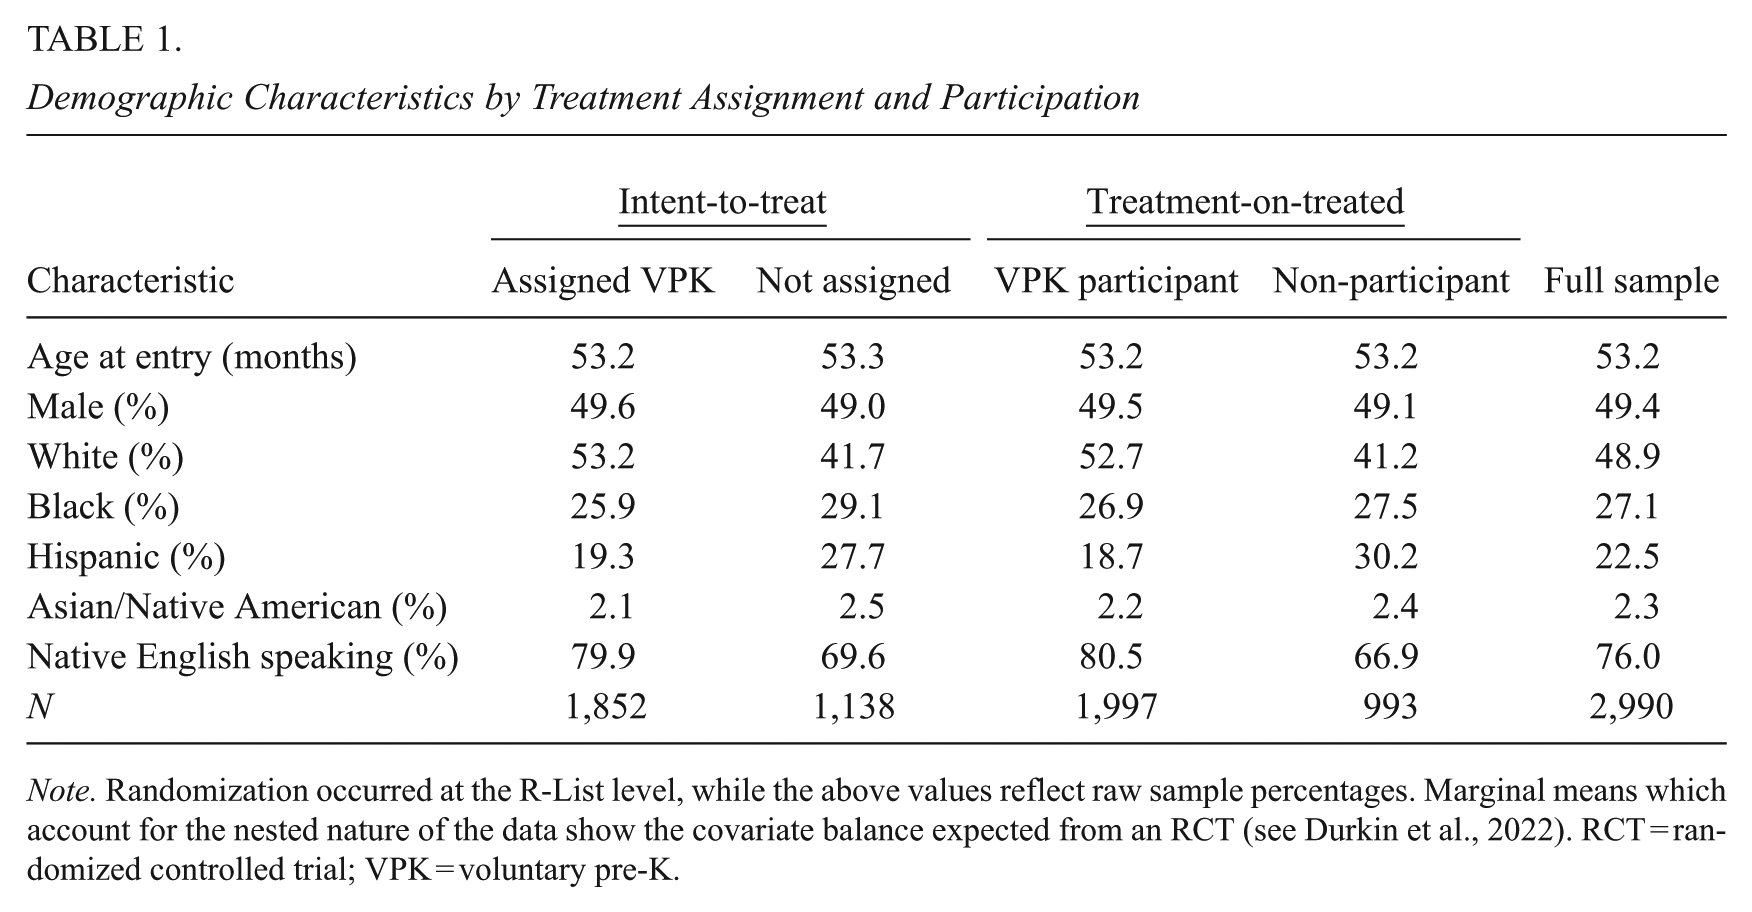
Note. Randomization occurred at the R-List level, while the above values reflect raw sample percentages. Marginal means which account for the nested nature of the data show the covariate balance expected from an RCT (see Durkin et al., 2022). RCT = randomized controlled trial; VPK = voluntary pre-K.
IEP Information Available Across the Grade Levels for the Full VPK Sample
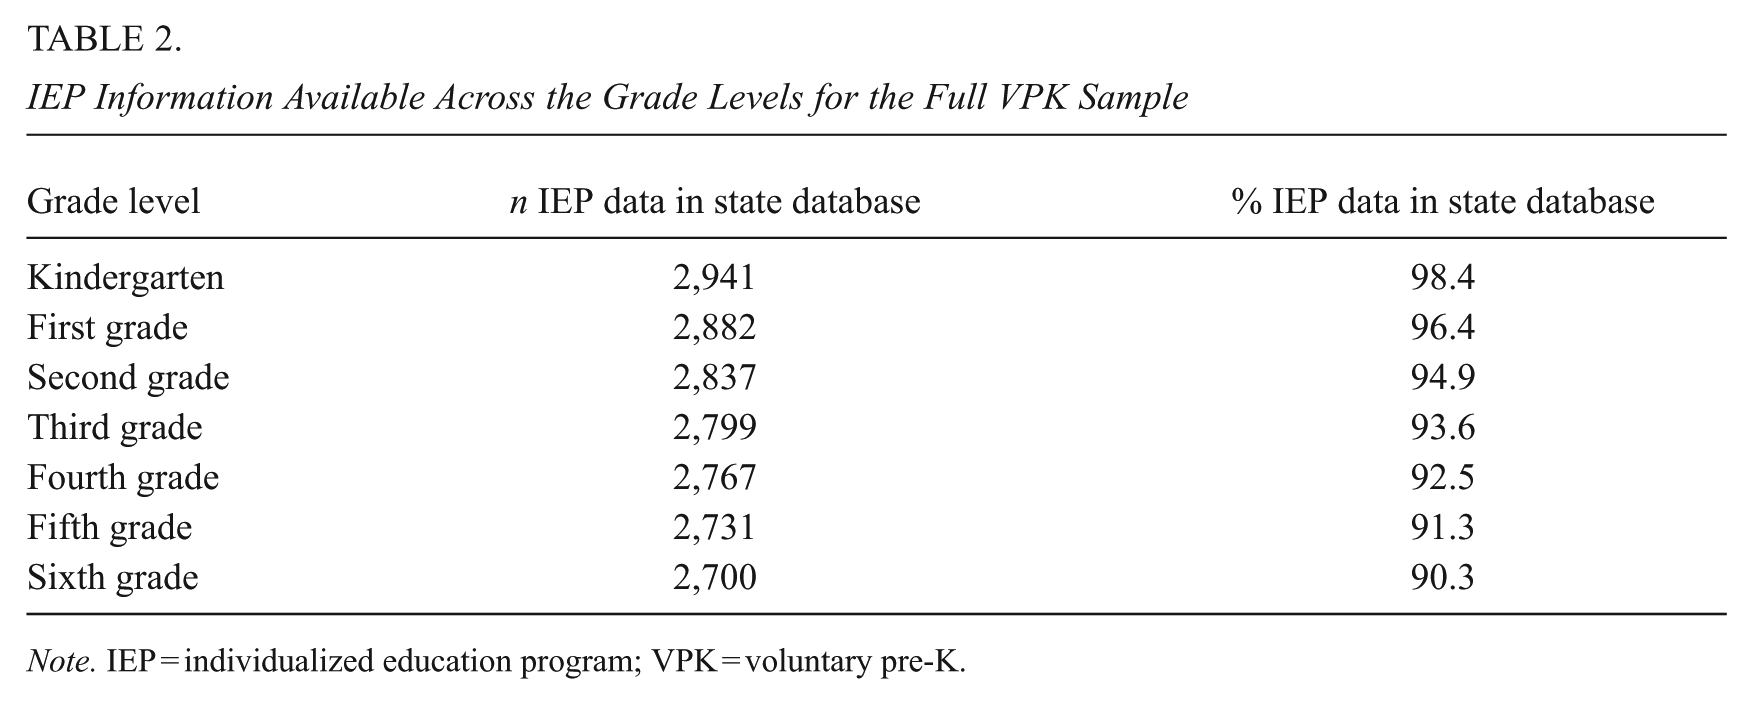
Note. IEP = individualized education program; VPK = voluntary pre-K.
Measures
Programs collected demographic data including age, gender, race, and ethnicity on all participants at the time of their application to TN-VPK. Administrative data collected via the state education database on all participants still in public schools in the state each year include the following: TNReady state achievement test scaled scores in English Language Arts, Math, and Science; disciplinary data including both minor violations of school rules and major infractions; attendance rate; what grade level the student is enrolled in; and whether the student has an IEP and what the classification was. The IEP data through sixth grade are the focus of this article.
Students with IEPs in Tennessee are reported as having one of 16 disability classifications each school year, based on definitions established by the IDEA (Sec 300). We focus in this article on those IEP categories that are most prevalent in the elementary years and that participation in PreK may reasonably be expected to have affected. The categories we include for analysis are: specific learning disabilities (SLDs), SLIs, other health impairments, developmental delay, and giftedness. The category of other health impairments is included because it is the umbrella category for various conditions, the most common of which is attention-deficit/hyperactivity disorder (ADHD).
The categories we do not include as individual outcome variables in these analyses are: intellectual disability, emotional disturbance, autism, orthopedic impairments, four categories related to hearing and vision difficulties, multiple disabilities, functional delay, and traumatic brain injury. The multiple disabilities category does not include students who happen to have multiple classifications but rather is used to indicate a combination of impairments that cause severe educational need such as intellectual disability and deafness. Less than 1% of our analytic sample was ever observed to have one of the categories excluded from our analyses in a given year. The incidence rates of autism and intellectual disability are lower than many would expect; we cannot know positively, but it is possible that young children with autism or intellectual disability—as well as deafness and blindness—were served in programs associated with special education services (IDEA, Part B, 619) and less likely to be given a general education TN-VPK slot, or if they were, they were not eligible for this study. As part of the study design, children were only eligible to be part of the current sample if they could be randomly assigned to attend or not attend TN-VPK, thus children who were guaranteed a slot because of already identified disabilities were ineligible to participate in the study.
We have also constructed a composite variable we call “Any IEP” that includes SLD, SLIs, other health impairment, developmental delay, intellectual disability, emotional disturbance, autism, and functional delay. The categories excluded from Any IEP are giftedness, orthopedic impairments, the categories related to hearing and vision difficulties, traumatic brain injury, and the multiple disabilities category.
Analysis
Hierarchical linear models (HLMs) with students nested in program sites and sites nested in school districts were used to analyze special education effects of participation in TN-VPK. All analyses included a standard set of covariates including age at the beginning of pre-K, gender, race, ethnicity, and native language. As we have described, at Level 2, to aid statistical power, we included TN-VPK program site characteristics identified by representatives of the TDOE as relevant to program performance: urbanicity (urban vs. rural), partner programs (operated by community organizations vs. schools), priority schools (operated in the lowest performing schools), pilot programs (funded in 1996 as pilot pre-K programs), and region (west, central west, central east, and east parts of the state). Primary analyses were performed using ITT comparisons on observed data. The formal model is as follows:
(1) Level 1, child level:

where DVijk is the dependent variable score for child i in the sample of I children, with each child record nested in a j R-List and a k district; α0jk is the intercept within the J R-Lists and K districts; β 0 is the coefficient for the treatment variable Tx; β is the coefficient for a representative covariate X; and e is the error term at Level 1.
(2) Level 2, R-List level:

where γ 00k is the random R-List intercept in each k District; ϕ is the coefficient for program-level covariates Z; and u0jk is the error term at Level 2.
(3) Level 3, District level:

where λ 000 is the random District intercept and r00k is the error term at Level 3.
To generate TOT estimates, we employ a principal stratification strategy based on that used in the Head Start Impact Study (Puma et al., 2010), which was also used in previous analyses of this sample (Durkin et al., 2022). Using this strategy, we rescale the estimated ITT effect from the models above by the inverse of the difference between the proportion of the ITT treatment group who were compliers and attended VPK and the proportion of the ITT control group who crossed over and attended VPK. For the full N = 2,990 analytic sample, this adjustment factor is 1.901; however, for each model, we calculate a separate adjustment factor that accounts for attrition in the sample. This approach generates complier average causal effect (CACE) estimates that are equivalent to two-stage least squares instrumental variable analysis (Gennetian et al., 2005). If we can assume that compliers and non-compliers experience similar TN-VPK effects, the CACE estimates derived from this procedure can be interpreted as TOT estimates. Prior work with this sample has found support for this assumption (Durkin et al., 2022); therefore, we present TOT estimates in the results section. For a more detailed explanation of this procedure, see Gennetian et al. (2005) and the supplement to Durkin et al. (2022).
Although many of our outcome variables are binary in nature, for consistency across analyses both in this article as well as in previous publications based on the same study, we report HLM results rather than logistic model estimates. While logistic regression is widely recognized as the preferable approach when estimating probabilities, that is not clearly the case when estimating group differences in experimental comparisons (Deke, 2014; Gomila, 2021; Timoneda, 2021). Furthermore, when we have compared results from linear and logistic regressions in previously published reports from the same study, we have found highly similar results for the outcomes with proportion values that are reported here (Durkin et al., 2022; Lipsey et al., 2018).
As a robustness check, we also model all our HLM estimates using a fixed-effects approach with fixed effects included for each of the R-Lists in our sample. The results of these fixed-effects models are available in the Supplemental Materials in the online version of the journal. For the fixed-effects models, we retain the same set of child-level covariates used in the HLM analysis. As expected, the results of the fixed-effects models largely mirror the HLM results.
Results
Timing and Duration of IEP Status by VPK Treatment and Control
In this section, we estimate differences for the covariate-adjusted means of the treatment and control groups with the coefficient on the treatment variable being the treatment effect. These means can be interpreted as the covariate-adjusted proportion of students in each condition who are estimated to have an IEP for a specific disability category. We then calculate pooled standard deviations (SDs) for the ITT and TOT estimates separately by summing the variances across all levels of the models for both treatment and control groups and taking the square root. We then divide the mean differences by the pooled SDs to calculate effect sizes, and we report TOT-adjusted mean differences and effect sizes for each model. The TOT adjustment has no effect on the reported p values. Each time period (i.e., “Grade”) is analyzed separately unless otherwise noted. For instance, each timepoint in Figures 1 to 3 includes the estimated marginal means from a separate HLM at each grade, while the analysis of whether children ever had an IEP from first to sixth grade uses a set of binary outcome variables that cover the entire period. For the sake of consistency across time periods and disability categories, we report higher incidences of IEPs in the treatment group with a positive effect size at all time points and for all disability categories. The valence of the effect size should thus not be interpreted as a beneficial or harmful effect but rather an indicator for the relative propensity of receiving an IEP. For all models, we also test interactions between the treatment variable and age, gender, race, and ethnicity variables. We find no significant interactions between TN-VPK assignment and these demographic characteristics for any of our outcomes. In the following section, we focus on the main treatment effects for VPK; however, we also acknowledge patterns of findings related to included covariates. For full model results, including the coefficients for all covariates, see the Supplemental Materials in the online version of the journal.
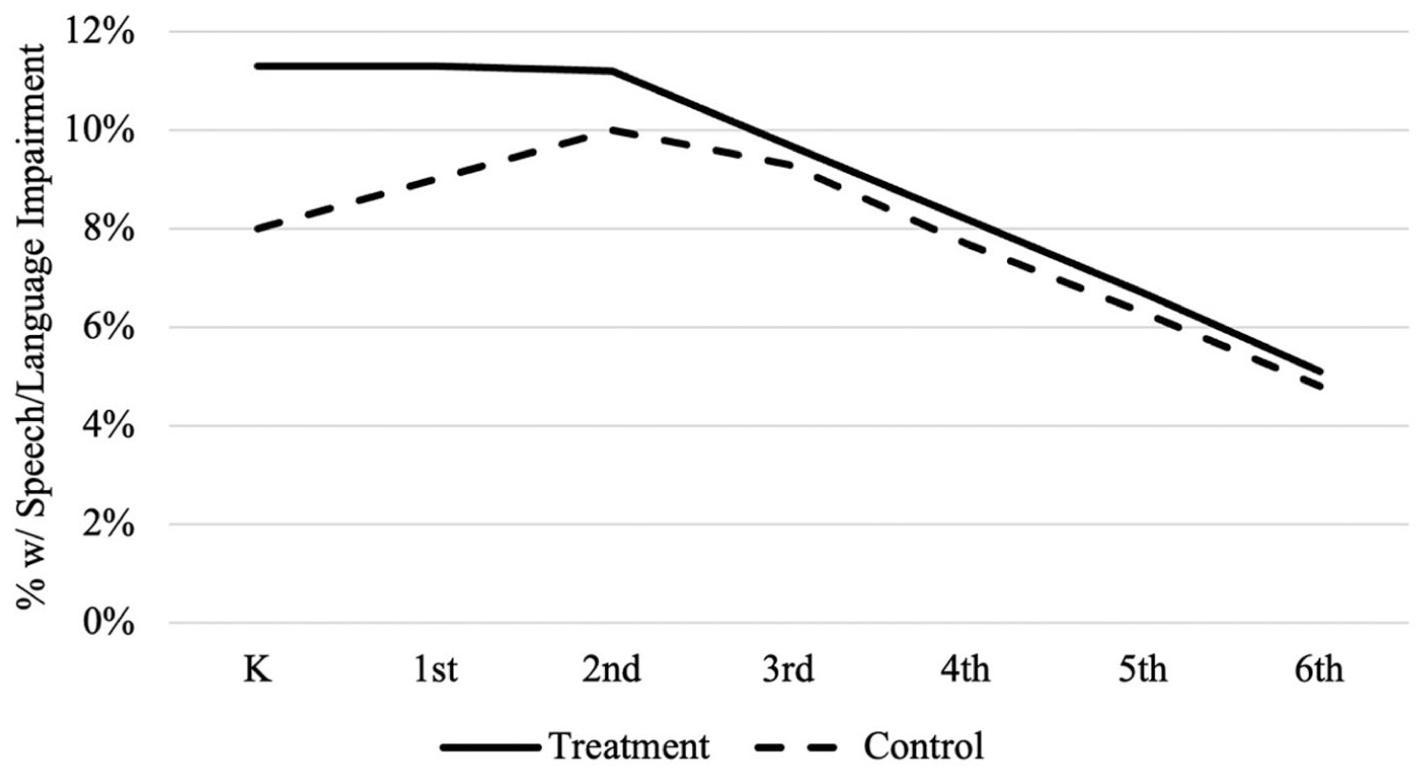
Estimated marginal means for speech-language impairment over time.
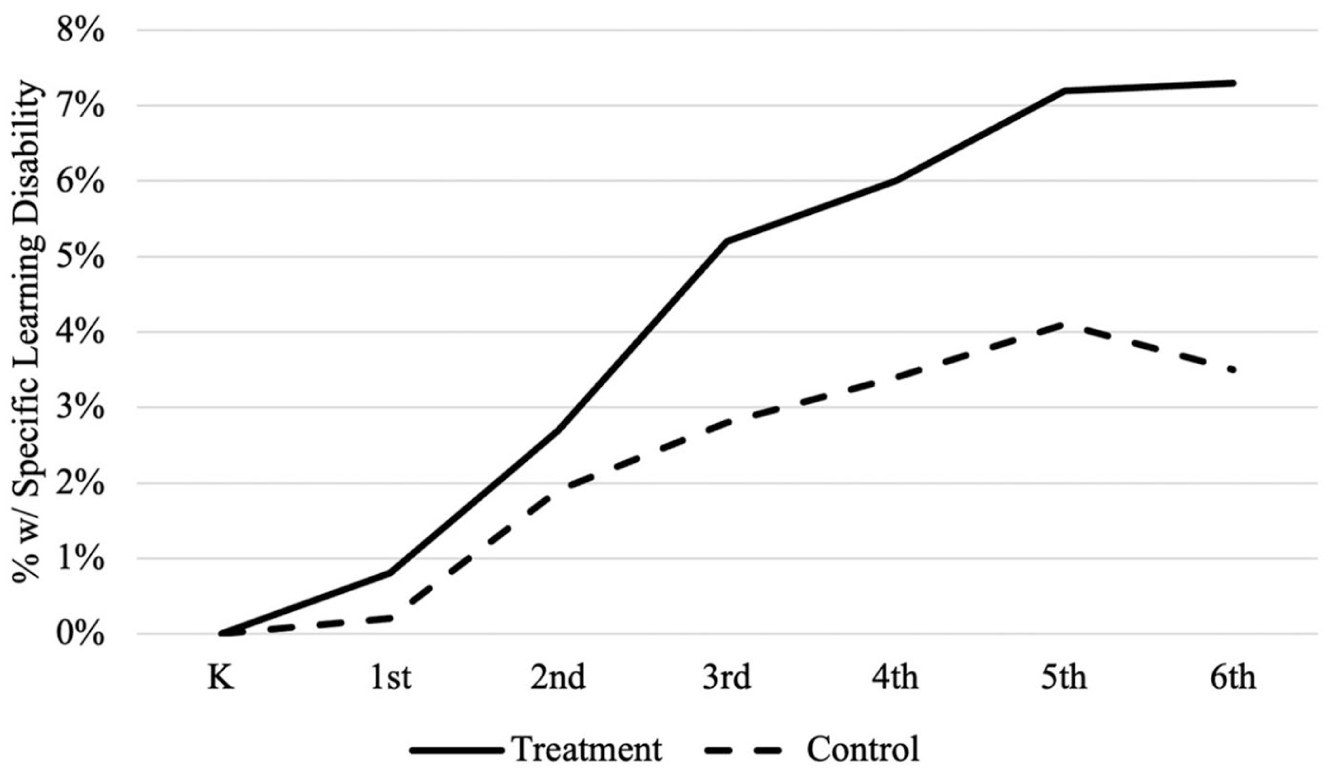
Estimated marginal means for specific learning disabilities over time.
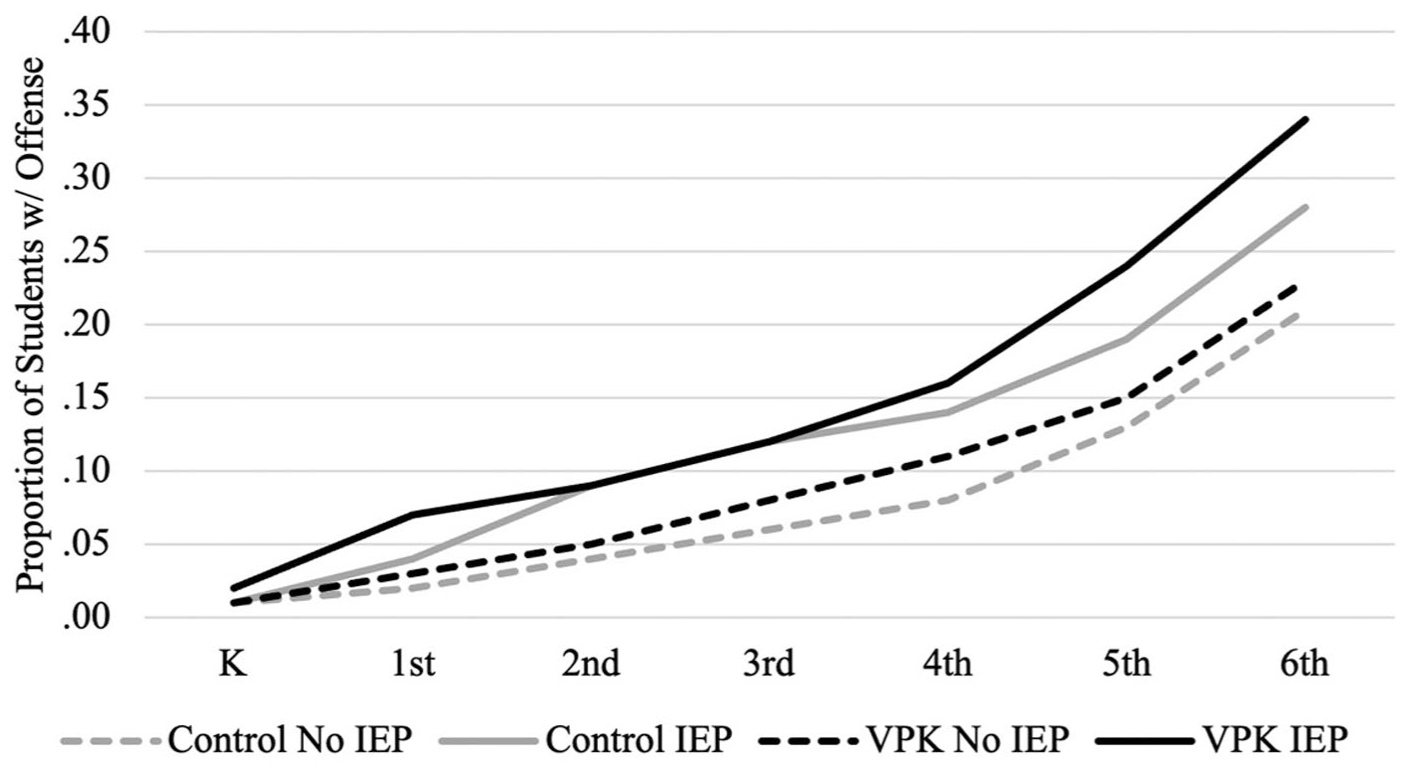
Cumulative disciplinary offenses by condition and ever having an IEP.
Identification for an IEP In the First Year of Schooling
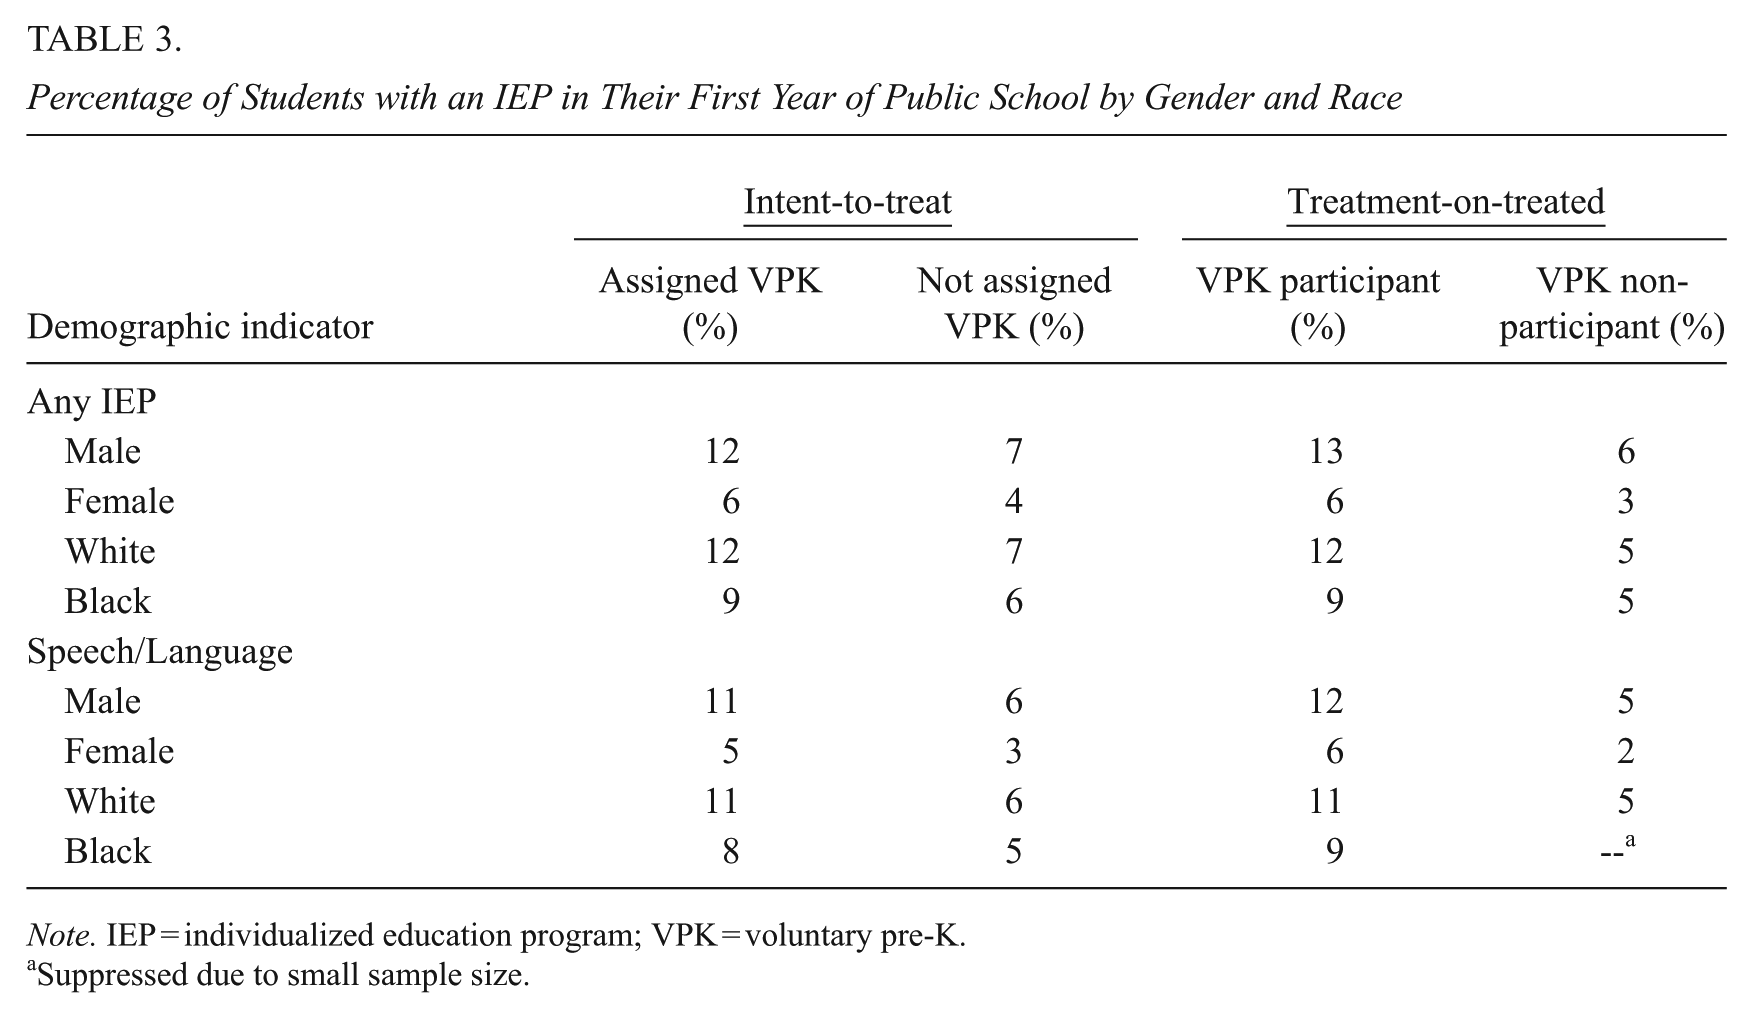
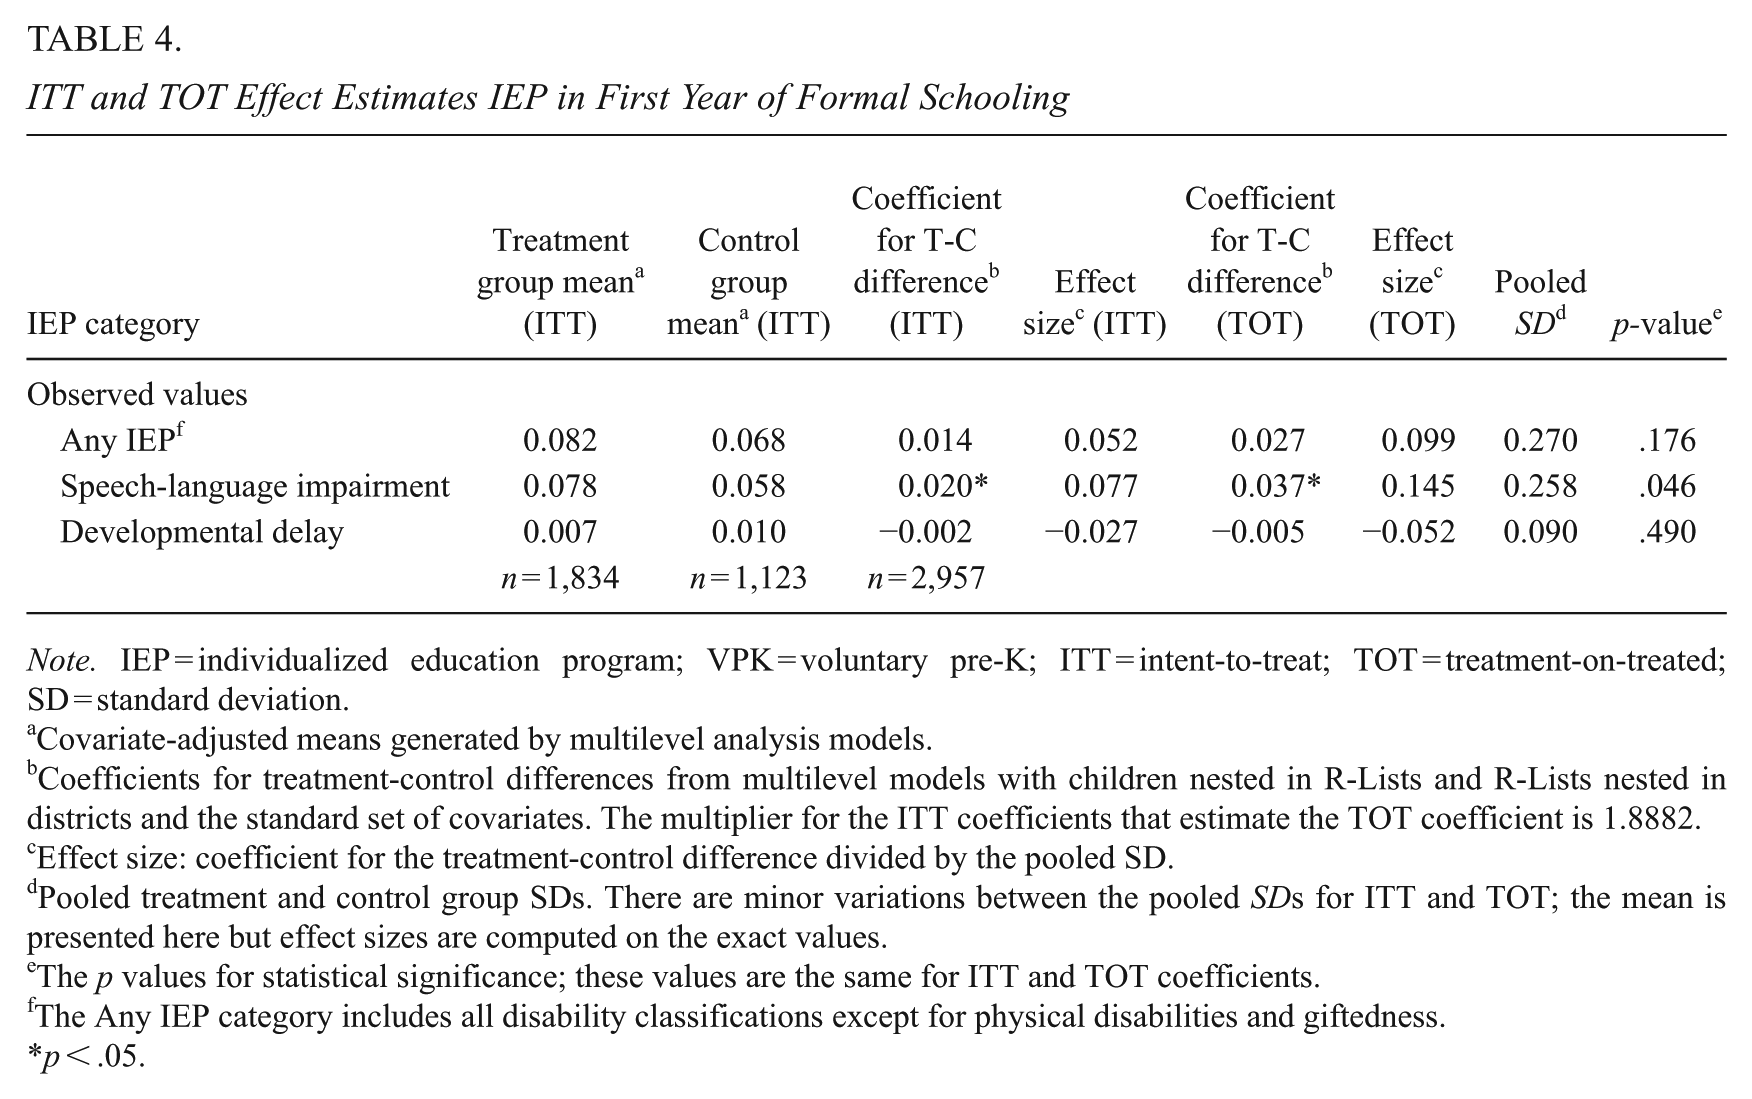
For children attending pre-K, the pre-K year was their initial introduction to formal schooling in a public-school setting; for the control children, the kindergarten year was their first introduction to a public-school classroom. Table 3 presents the demographic data for treatment and control children in both the ITT and the TOT samples within IEP categories for the first year of formal schooling (pre-K or K depending on the group). Categories presented are Any IEP and SLIs. Developmental delay rates and rates for certain subgroups (e.g. Hispanic, Asian/Native American, non-native speakers) are not reported due to incidence rates below thresholds for TDOE reporting standards. Presented in Table 4 are the analytic results comparing treatment and control children. Table 4 demonstrates that TN-VPK participants (TOT) were significantly more likely to receive an IEP for speech language delay in pre-K than nonparticipants were when those children attended kindergarten. ITT treatment group children were 2 p.p. (p < .05) more likely than ITT control group children to have an IEP for SLI in their first year of formal schooling, a 34% increase in the likelihood of receiving such an IEP. Male students in both conditions were more likely to have an IEP in general and to have one for SLI specifically, but there was no significant interaction with VPK status. For both conditions, non-native English-speaking students were less likely to have an IEP for SLI. There were no significant differences by racial or ethnic category.
Percentage of Students with an IEP in Their First Year of Public School by Gender and Race
Note. IEP = individualized education program; VPK = voluntary pre-K.
Suppressed due to small sample size.
ITT and TOT Effect Estimates IEP in First Year of Formal Schooling
Note. IEP = individualized education program; VPK = voluntary pre-K; ITT = intent-to-treat; TOT = treatment-on-treated; SD = standard deviation.
Covariate-adjusted means generated by multilevel analysis models.
Coefficients for treatment-control differences from multilevel models with children nested in R-Lists and R-Lists nested in districts and the standard set of covariates. The multiplier for the ITT coefficients that estimate the TOT coefficient is 1.8882.
Effect size: coefficient for the treatment-control difference divided by the pooled SD.
Pooled treatment and control group SDs. There are minor variations between the pooled SDs for ITT and TOT; the mean is presented here but effect sizes are computed on the exact values.
The p values for statistical significance; these values are the same for ITT and TOT coefficients.
The Any IEP category includes all disability classifications except for physical disabilities and giftedness.
p < .05.
Identification for IEP in Kindergarten
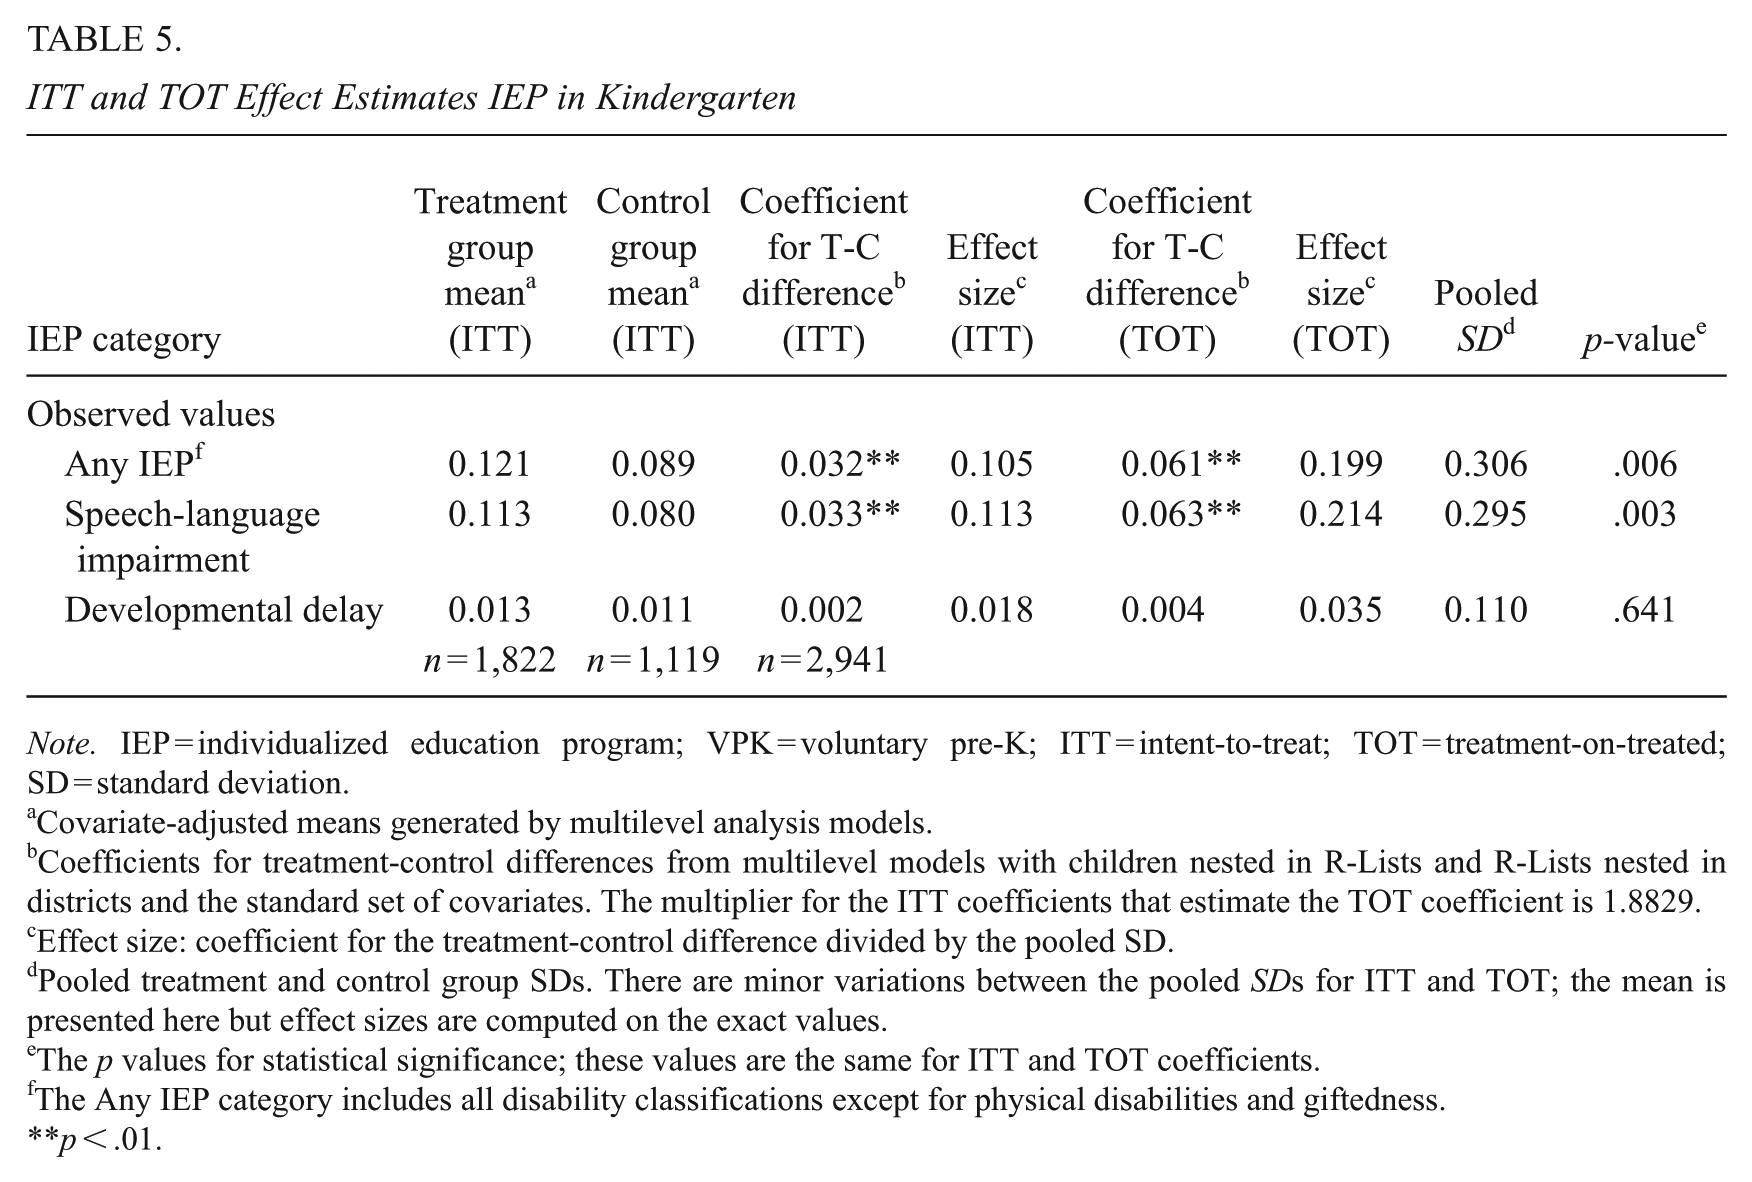
Both children who had attended TN-VPK and those who had not were eligible for IEP designations in kindergarten. Children who had not attended TN-VPK were attending a formal education program for the first time. For the TN-VPK attending sample, IEPs in kindergarten consisted of ones obtained earlier in pre-K as well as new identifications in kindergarten. It is possible that once the control children entered kindergarten the identification for special services would catch up to the treatment children’s earlier identification. Instead as Table 5 demonstrates, differences between the groups remained and were now significant at the p < .01 level in kindergarten for the overall Any IEP category and for SLIs. For the combined Any IEP analysis, 12.1% of ITT treatment children had an IEP in kindergarten, while only 8.9% of controls children had an IEP in kindergarten. Thus, ITT treatment group children were 3.2 p.p. more likely to have an IEP than ITT control group children, representing a roughly 36% increase in the likelihood of having an IEP over the control group. This difference is primarily driven by an increased likelihood of having an IEP for SLI, with ITT treatment group children 3.3 p.p. more likely to have such an IEP, representing over a 40% increase over the control group. There were no significant differences for developmental delay by treatment condition.
ITT and TOT Effect Estimates IEP in Kindergarten
Note. IEP = individualized education program; VPK = voluntary pre-K; ITT = intent-to-treat; TOT = treatment-on-treated; SD = standard deviation.
Covariate-adjusted means generated by multilevel analysis models.
Coefficients for treatment-control differences from multilevel models with children nested in R-Lists and R-Lists nested in districts and the standard set of covariates. The multiplier for the ITT coefficients that estimate the TOT coefficient is 1.8829.
Effect size: coefficient for the treatment-control difference divided by the pooled SD.
Pooled treatment and control group SDs. There are minor variations between the pooled SDs for ITT and TOT; the mean is presented here but effect sizes are computed on the exact values.
The p values for statistical significance; these values are the same for ITT and TOT coefficients.
The Any IEP category includes all disability classifications except for physical disabilities and giftedness.
p < .01.
In both treatment and control groups, male students were more likely to have an IEP in general and for both SLIs and developmental delay. In the sample as a whole, Black students were less likely to have an IEP in general as well as for SLIs but not for developmental delay. Non-native English-speaking students in the total group were less likely to have an IEP for SLIs. There were no other significant differences by demographic groups.
Ever Had an IEP Across the Grades from First to Sixth
Students may receive an IEP in one grade, say first, but no longer have that designation in second or third grade (declassification). Having already examined the prevalence of an IEP designation in kindergarten, we examined whether at any point between first and sixth grade, a student had an IEP, regardless of how long the student kept it. As shown in Table 6, between first and sixth grade, TN-VPK students were more likely than control students to be represented in every disability category and less likely to be identified as gifted.
ITT and TOT Effect Estimates for Ever Having an IEP From First to Sixth Grade
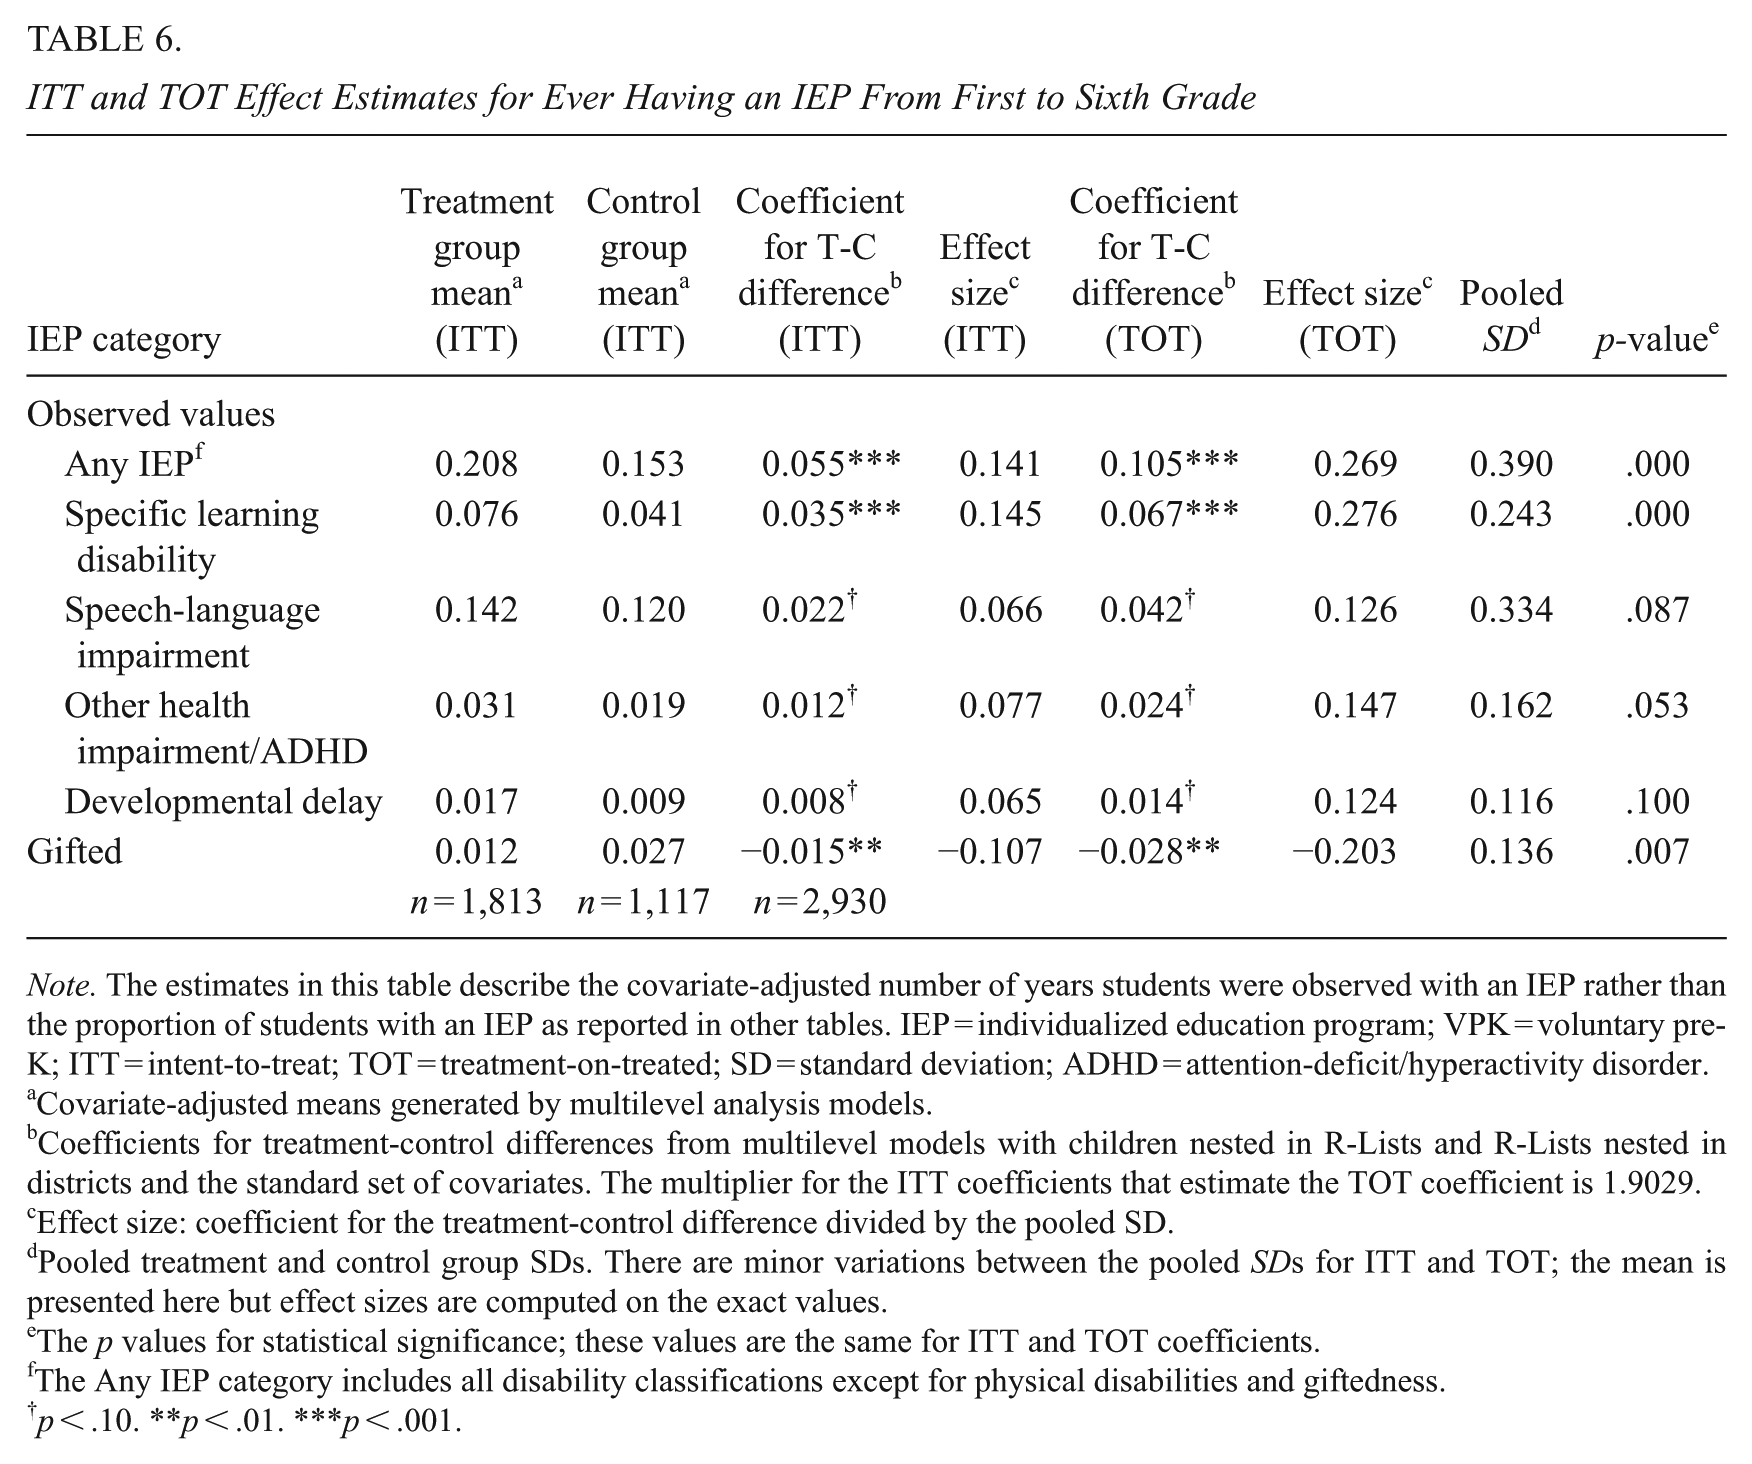
Note. The estimates in this table describe the covariate-adjusted number of years students were observed with an IEP rather than the proportion of students with an IEP as reported in other tables. IEP = individualized education program; VPK = voluntary pre-K; ITT = intent-to-treat; TOT = treatment-on-treated; SD = standard deviation; ADHD = attention-deficit/hyperactivity disorder.
Covariate-adjusted means generated by multilevel analysis models.
Coefficients for treatment-control differences from multilevel models with children nested in R-Lists and R-Lists nested in districts and the standard set of covariates. The multiplier for the ITT coefficients that estimate the TOT coefficient is 1.9029.
Effect size: coefficient for the treatment-control difference divided by the pooled SD.
Pooled treatment and control group SDs. There are minor variations between the pooled SDs for ITT and TOT; the mean is presented here but effect sizes are computed on the exact values.
The p values for statistical significance; these values are the same for ITT and TOT coefficients.
The Any IEP category includes all disability classifications except for physical disabilities and giftedness.
p < .10. **p < .01. ***p < .001.
Across all categories, TN-VPK students were 5.5 p.p. more likely to have an IEP than control students, with the largest effect for SLDs where students assigned to TN-VPK were 3.5 p.p. more likely to have an IEP for SLD than students assigned to the control group. This represents a roughly 85% increase in the likelihood of having an IEP for SLD for students assigned to attend TN-VPK. For SLI, TN-VPK students were 2.2 p.p. more likely to have an IEP; for other health impairments/ADHD, 1.2 p.p. more likely; for developmental delay, 0.8 p.p. more likely; and finally, TN-VPK students were 1.5 p.p. less likely to have an IEP for giftedness. Furthermore, these are only the ITT effects, and TOT estimated effects are even larger in magnitude. For corresponding TOT effect estimates, see Table 6.
Male students were significantly more likely to have an IEP overall, including for SLDs, SLIs, and other health impairment, and marginally more likely to have an IEP for developmental delay. Black students were significantly less likely to have an IEP overall and specifically for SLIs. Non-native English-speaking students were significantly less likely to have an IEP overall and specifically for SLIs. Non-native English students were also marginally less likely to have an IEP for other health impairment. The combined Asian and Native American group was marginally more likely to be identified as gifted. There were no significant differences for Hispanic students in the Any IEP category. There were no interactions with attending TN-VPK for any of the demographic characteristics.
Cumulative Years with an IEP From First to Sixth Grades
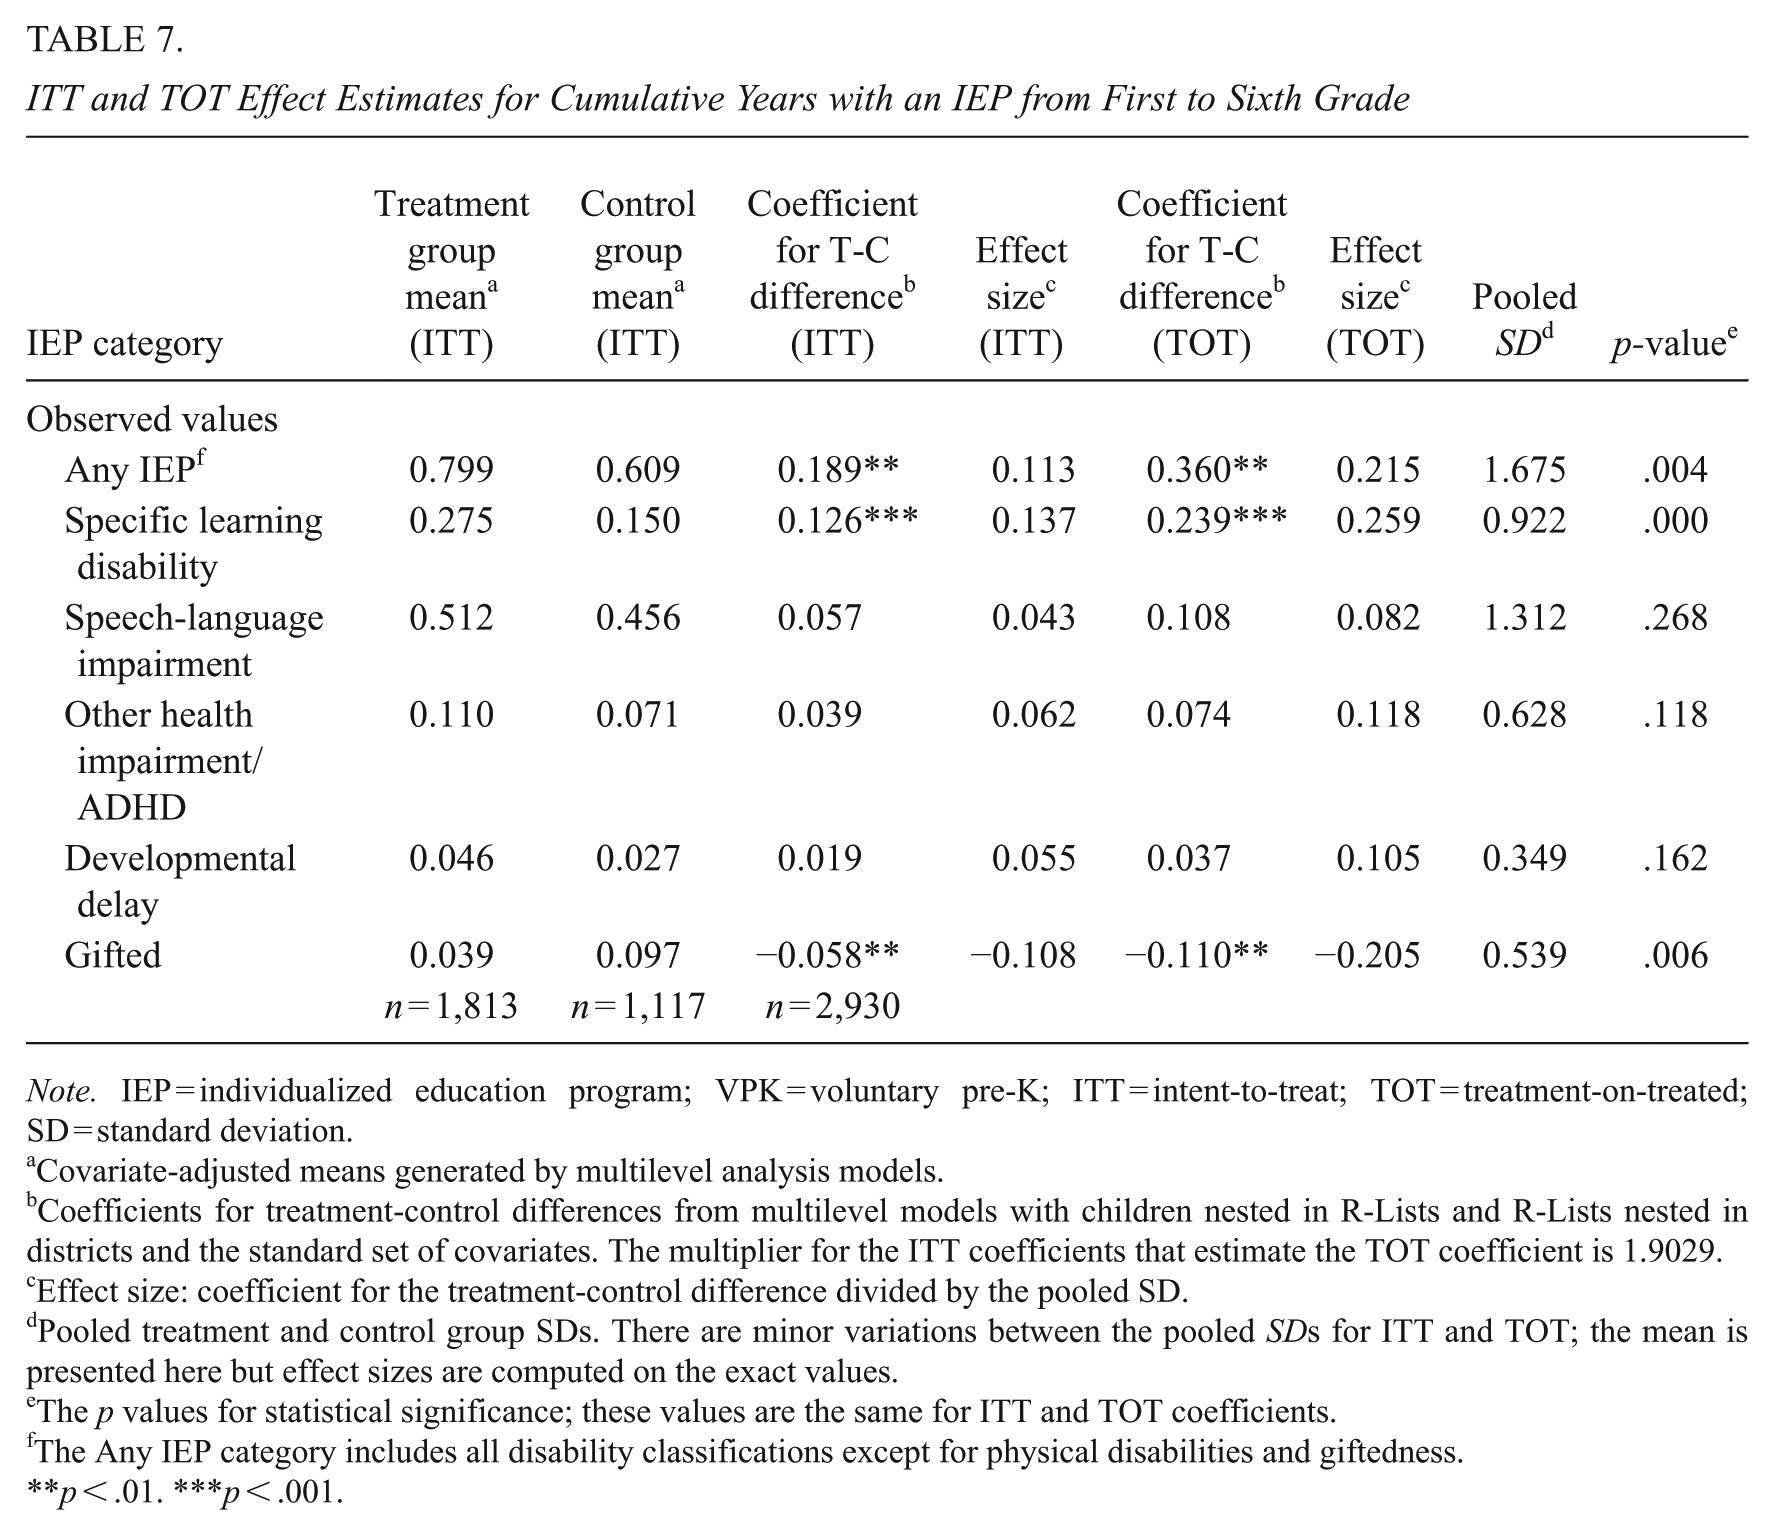
Another way to examine having an IEP is to look at how long the designation remained with the student. It is possible that students who attended TN-VPK in pre-K received an early diagnosis of SLI, kept that designation for a year or two but then moved out of the need for special education services. Thus, we compared treatment and control children on the cumulative number of years they had an IEP between first and sixth grade. As Table 7 shows, from first to sixth grade, students who attended TN-VPK had more years of enrollment with an IEP designation in several disability categories and fewer years with an IEP for giftedness than control students. Focusing on the ITT estimates, students assigned to TN-VPK spent on average 0.19 more years with an IEP of any type (p < .01) and 0.13 more years with a diagnosis of SLDs than children not assigned to TN-VPK (p < .001).
ITT and TOT Effect Estimates for Cumulative Years with an IEP from First to Sixth Grade
Note. IEP = individualized education program; VPK = voluntary pre-K; ITT = intent-to-treat; TOT = treatment-on-treated; SD = standard deviation.
Covariate-adjusted means generated by multilevel analysis models.
Coefficients for treatment-control differences from multilevel models with children nested in R-Lists and R-Lists nested in districts and the standard set of covariates. The multiplier for the ITT coefficients that estimate the TOT coefficient is 1.9029.
Effect size: coefficient for the treatment-control difference divided by the pooled SD.
Pooled treatment and control group SDs. There are minor variations between the pooled SDs for ITT and TOT; the mean is presented here but effect sizes are computed on the exact values.
The p values for statistical significance; these values are the same for ITT and TOT coefficients.
The Any IEP category includes all disability classifications except for physical disabilities and giftedness.
p < .01. ***p < .001.
Male students across both groups were significantly more likely to have an IEP longer and specifically longer for SLDs, SLIs, other health impairment, and marginally more likely to have an IEP for developmental delay for more years. Black students in both groups were significantly less likely to have an IEP in general over the grades. Non-native English-speaking students were significantly less likely to continue to have an IEP in general. Non-native English students were also marginally less likely cumulatively over the years to have an IEP for other health impairment. The combined Asian and Native American group was more likely to be identified as gifted and to maintain that designation from first to sixth grades. There were no significant differences for Hispanic students in the Any IEP category.
Changes in the Most Prevalent IEP Categories from Kindergarten to Sixth Grade
SLI Over Time
As shown in Figure 1, SLIs were significantly more common in the treatment group than the control group in kindergarten and marginally more common in first grade. After first grade, there were no significant differences in the rate of SLI between the treatment and control children.
SLD Over Time
SLDs were first observed diagnosed in first grade and were marginally more common in the treatment condition than the control condition in first and second grades. Figure 2 shows that, from third grade to sixth grade, the diagnosis of SLDs increased greatly and was significantly more common in the treatment condition children than the control condition children. Children who attended TN-VPK were thus newly diagnosed with a SLD in the later grades at a much higher rate than children who had not attended TN-VPK.
Impact of Having an IEP on VPK Findings for Achievement and Suspensions
In addition to conducting a more detailed investigation of the timing and types of disability classifications students in the VPK sample received, an additional research question is the extent to which the higher proportion of identified disabilities in the VPK condition explain previously reported negative findings around achievement and discipline. To investigate the role of special education as a mediator for the VPK effects on these outcomes, we present a set of regression estimates that provide results for the sixth grade achievement and discipline outcomes for the full analytic sample as well as a subsample that includes only those students who were ever identified as having an IEP through sixth grade and a subsample that includes only those students who were never identified as having an IEP through sixth grade. It is important to note that in these subsamples, we are conditioning on a dependent variable (IEP status); thus, the regression results presented do not reflect causal estimates of the impacts of the program on achievement for the subgroups but rather serve as a secondary mediator analysis.
Achievement
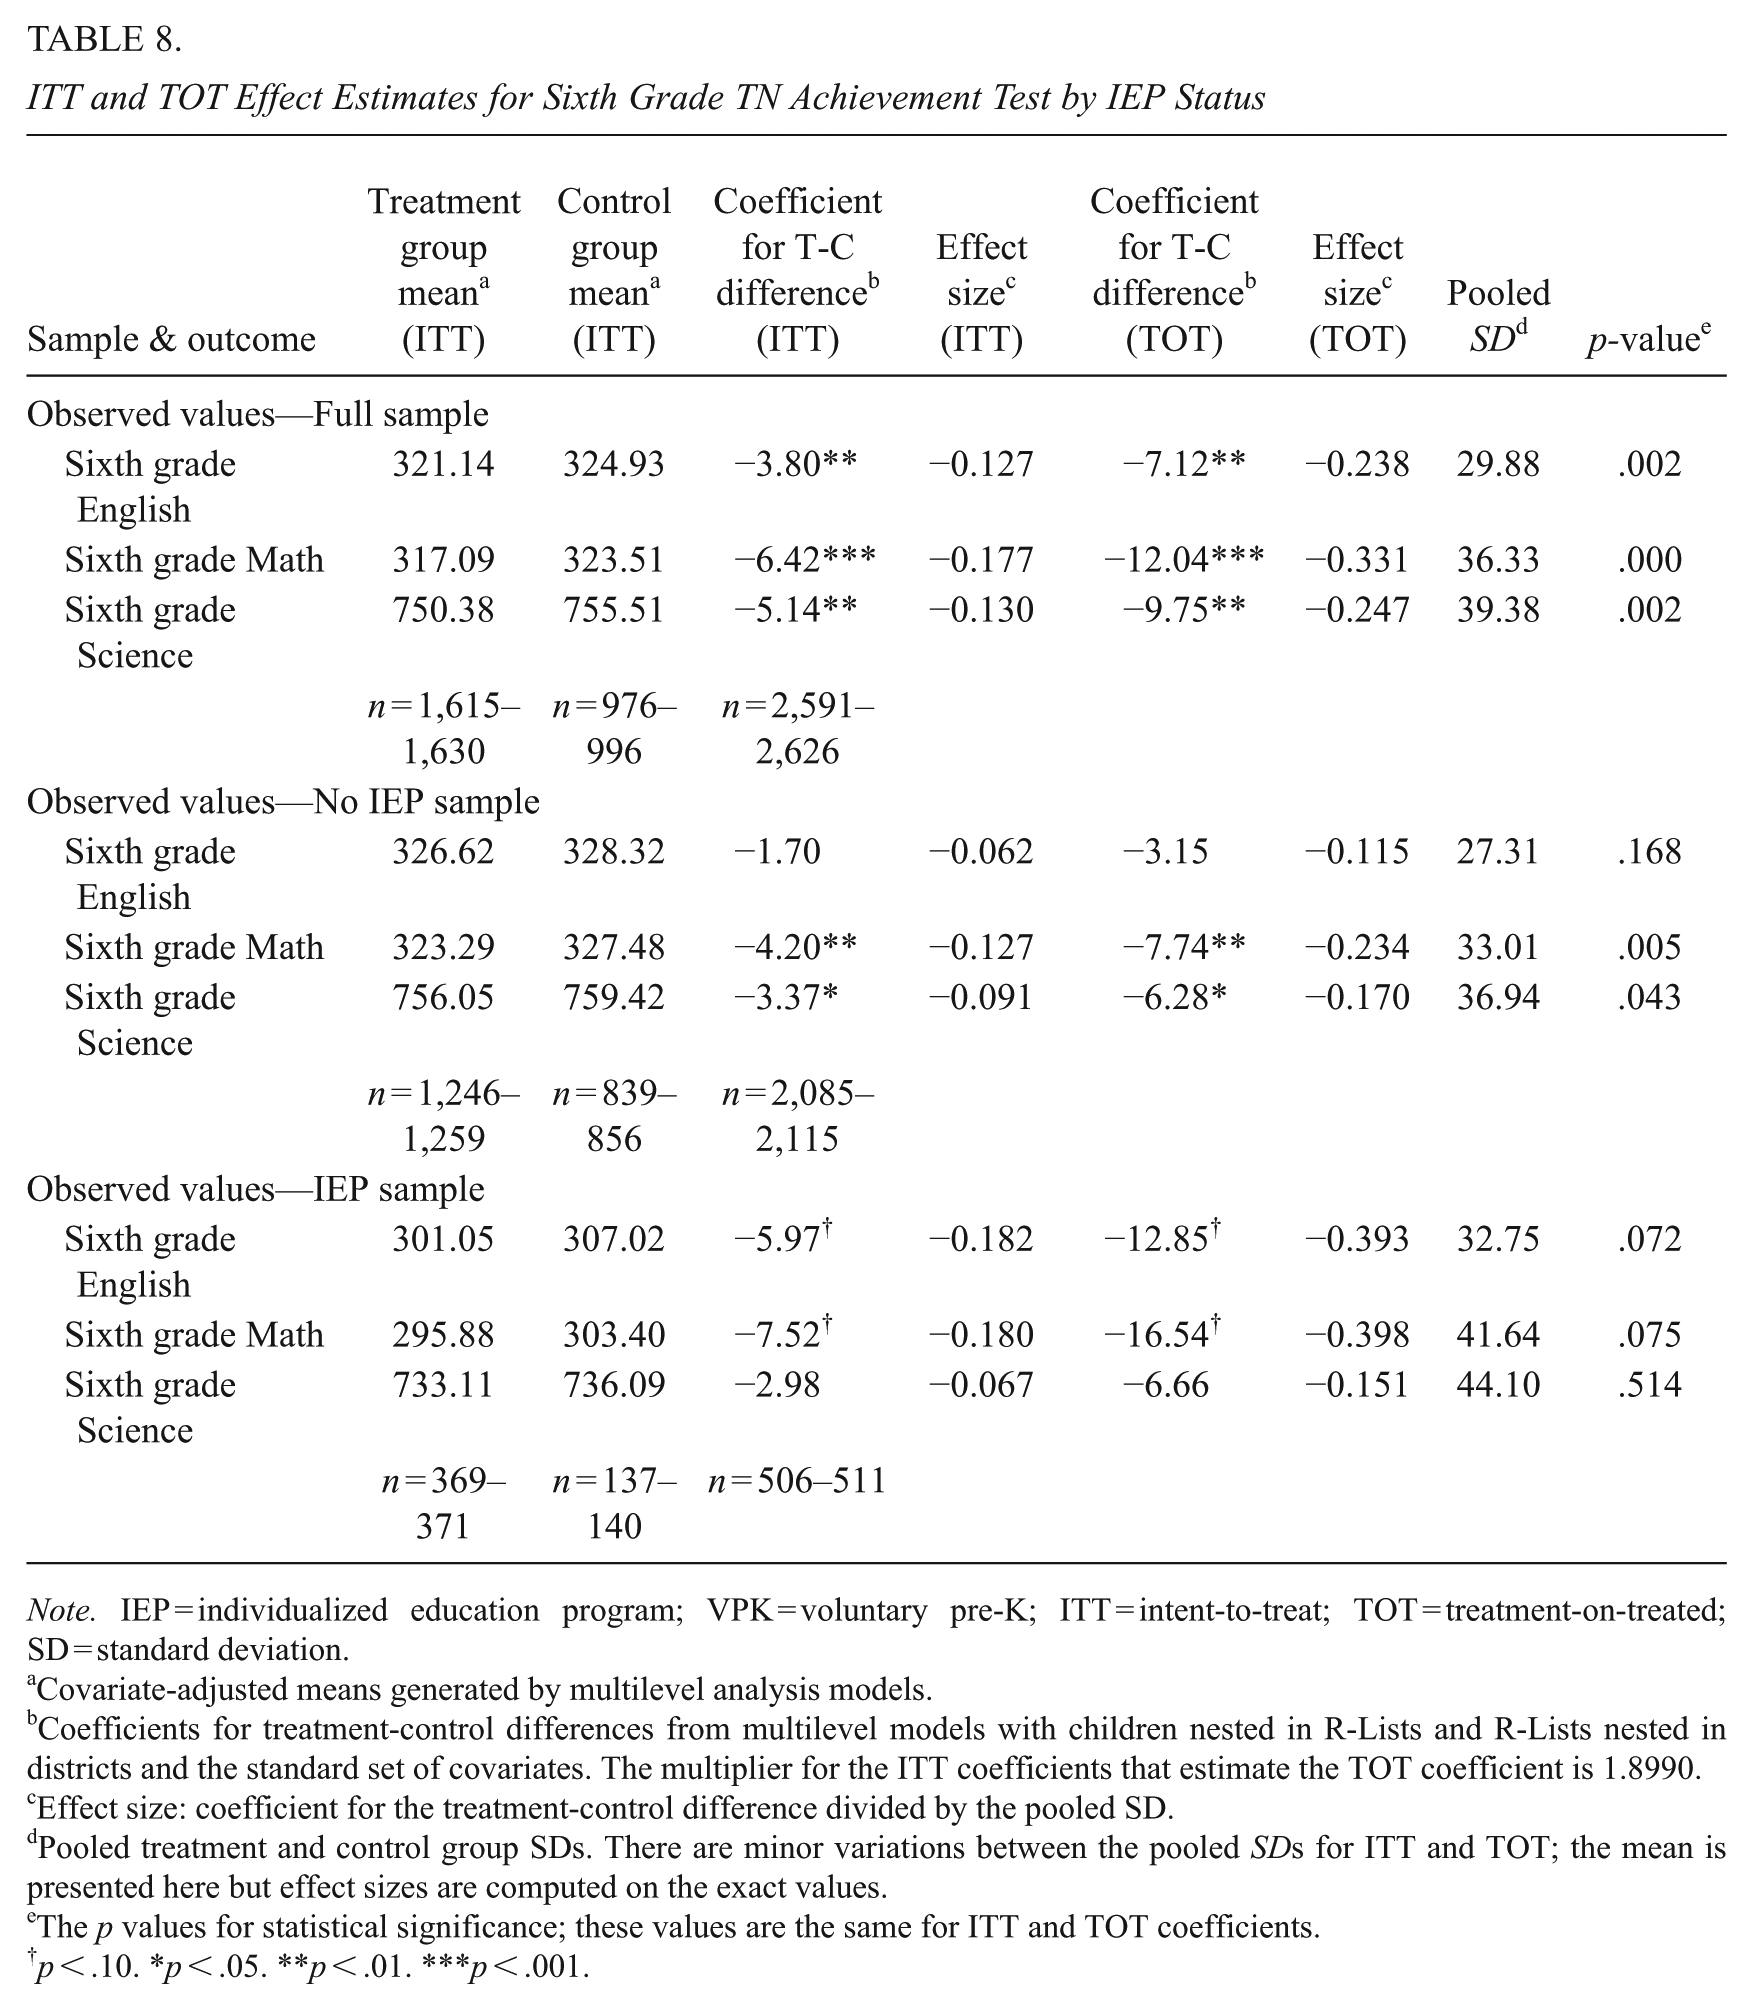
The negative effects on state achievement tests in sixth grade were reported previously (Durkin et al., 2022). In Table 8, we examine whether the earlier negative findings on achievement outcomes for those who attended TN-VPK could have been due to the greater prevalence of children with IEPs in the TN-VPK group. These analyses have updated covariates from the findings presented in earlier publications, but the differences between these estimates and earlier ones are negligible.
ITT and TOT Effect Estimates for Sixth Grade TN Achievement Test by IEP Status
Note. IEP = individualized education program; VPK = voluntary pre-K; ITT = intent-to-treat; TOT = treatment-on-treated; SD = standard deviation.
Covariate-adjusted means generated by multilevel analysis models.
Coefficients for treatment-control differences from multilevel models with children nested in R-Lists and R-Lists nested in districts and the standard set of covariates. The multiplier for the ITT coefficients that estimate the TOT coefficient is 1.8990.
Effect size: coefficient for the treatment-control difference divided by the pooled SD.
Pooled treatment and control group SDs. There are minor variations between the pooled SDs for ITT and TOT; the mean is presented here but effect sizes are computed on the exact values.
The p values for statistical significance; these values are the same for ITT and TOT coefficients.
p < .10. *p < .05. **p < .01. ***p < .001.
The middle panel of Table 8 presents the results from models restricted to participants who never had an IEP up through the year of test administration. As is evident in the tables, at sixth grade, restricting the analytic sample to include only students without IEPs does not change the overall pattern of results. Control students in the restricted sample outperformed TN-VPK students in Math and Science.
Comparing the achievement outcomes for children in both treatment and control conditions who had an IEP (bottom panel of Table 8) demonstrates that control children with an IEP outperformed TN-VPK children with an IEP in English and Math.
Discipline
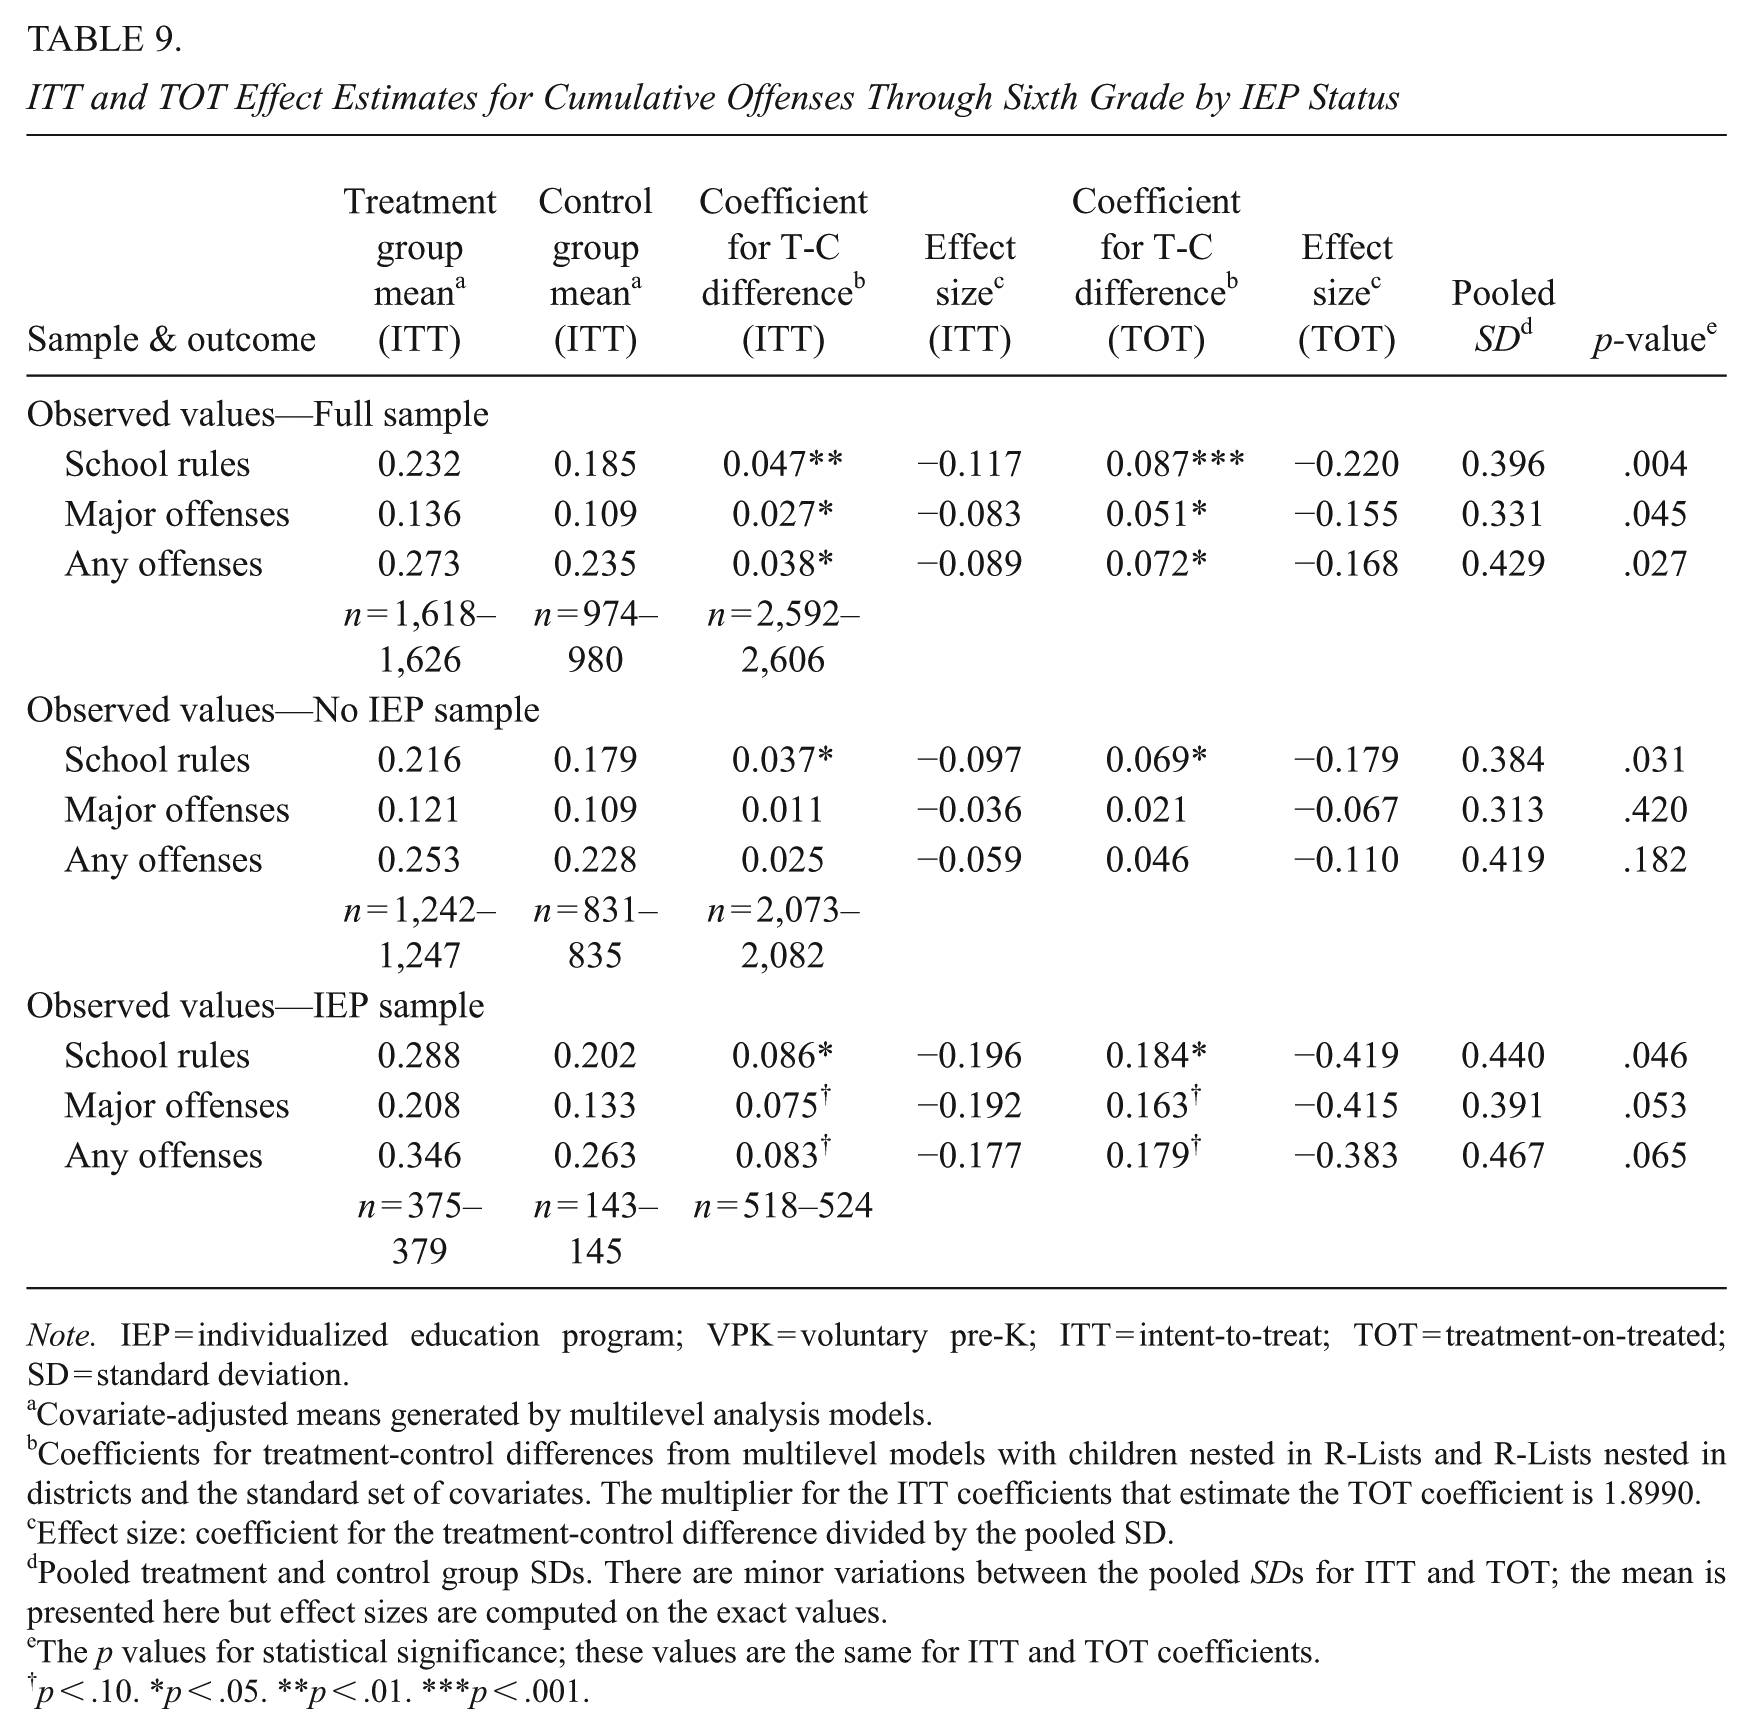
Across the first 7 years in school, TN-VPK students have previously been shown to have higher rates of disciplinary infractions (Durkin et al., 2022). Disciplinary offenses are of two types: minor (school behavior offenses such as speaking disrespectfully, wearing a cap backward, etc.) and major offenses (those include fighting, bullying, bringing a weapon to school, etc.). Results for the overall sample are presented in Table 9 with updated covariates along with analogous results from models restricted to participants who had not had an IEP through sixth grade as well as an examination of a sample that includes only students with an IEP. TN-VPK students in the restricted model continue to have significantly more minor offenses; however, the difference in major offenses and the overall difference are no longer statistically significant. Results for those students with an IEP indicate significant differences between the treatment and control groups. Those TN-VPK students with an IEP were significantly more likely to commit both minor and major offenses than the control students who had an IEP. Figure 3 shows how disciplinary offenses for both TN-VPK and control students with and without IEPs changed over time.
ITT and TOT Effect Estimates for Cumulative Offenses Through Sixth Grade by IEP Status
Note. IEP = individualized education program; VPK = voluntary pre-K; ITT = intent-to-treat; TOT = treatment-on-treated; SD = standard deviation.
Covariate-adjusted means generated by multilevel analysis models.
Coefficients for treatment-control differences from multilevel models with children nested in R-Lists and R-Lists nested in districts and the standard set of covariates. The multiplier for the ITT coefficients that estimate the TOT coefficient is 1.8990.
Effect size: coefficient for the treatment-control difference divided by the pooled SD.
Pooled treatment and control group SDs. There are minor variations between the pooled SDs for ITT and TOT; the mean is presented here but effect sizes are computed on the exact values.
The p values for statistical significance; these values are the same for ITT and TOT coefficients.
p < .10. *p < .05. **p < .01. ***p < .001.
Discussion
The findings presented here add to the ongoing discussion concerning the impact of pre-K attendance on long-term special education outcomes. We show that during pre-K students who attended a state-funded pre-K program were more likely than students who did not attend to receive an IEP for SLI and more likely to have an IEP overall. We show that during kindergarten TN-VPK non-attenders were eligible to receive an IEP for the first time for school-identified special needs but did not catch up to TN-VPK children, some of whom also received their first referral. We show that these special education effects were persistent and long-lasting with TN-VPK attenders more likely to have an IEP in every disability category and less likely to be identified as gifted through sixth grade.
Additionally, students who attended TN-VPK spent more time with an IEP for SLD in first through sixth grade. We also show that, although students receiving special education services scored lower on state exams and had more disciplinary infractions, the different rates of special education for attenders and non-attenders in our sample do not explain previously reported negative findings on these outcomes. However, children who attended a TN-VPK program and subsequently received an IEP had lower achievement scores and higher rates of disciplinary referrals than control children who were given an IEP. We did not find any interaction effects for ethnicity or gender and attending TN-VPK.
These results come from the only randomized control study of a statewide, public pre-K program operating at scale and meeting nine of 10 NIEER benchmarks for quality in the program delivery years (Barnett et al., 2009) with data extending through sixth grade. These findings are worrisome considering the expectation that participation in pre-K would allow for earlier intervention and reduce the need for special education services in later grades. It is certainly conceivable that identifying children earlier (in pre-K) meant those children received needed intervention services that could have prevented the need for later special education services. This, however, is not what the current results show. Moreover, in the later grades, TN-VPK students who had not had an earlier IEP were newly referred for services, most often for SLD.
We now turn to discussing how these findings fit into the broader literature around pre-K and special education and propose potential mechanisms that may explain these unanticipated findings. We also address the limitations of this study and make recommendations for future research.
Historical Context
The argument that early intervention would ameliorate the need for special education services for many students is on its face sound and supported by early research (reviewed by McCoy et al., 2017). More recent studies, however, found no long-term effect on special education services conditional on pre-K attendance (Watts et al., 2023; Weiland et al., 2020). To some extent, this shift in the empirical evidence is not entirely surprising. Early studies such as Abecedarian and Perry Preschool not only offered far more wraparound services beyond pre-K, but they also highly targeted the most at-risk families, and researchers who fundamentally believed in the malleability of the skills of participating children carried out the programs. More recent evaluations focus on larger-scale programs typically implemented in public schools (and sometimes community centers under the auspices of the state department of education) with a more specific focus on academic preparedness.
Furthermore, we are now several policy generations removed from the context in which the early studies were conducted. The passage of the Education for All Handicapped Children Act in 1975 and its reauthorization as the IDEA in 1990 fundamentally changed the way public schools educate children with disabilities. While there was a serious need for better identification and intervention in the 1960s and 1970s, the current special education environment involving access to services for many more students could conceivably impact the identification of children with special needs in their pre-K classrooms. The growth in number of children identified as needing special services has been large, most especially in the two categories we found to be most frequent—SLI and SLDs, each of which has a more subjective basis for referral (Fletcher et al., 2024). This shift in the historical context does not, however, fully explain the findings we have presented here.
Focusing on the results of the present study, the question of why and how so many TN-VPK participants were placed into special education in the years following pre-K attendance remains unanswered. We propose possible explanations based on the current literature around public school-based pre-K programs and early special education.
Transient Versus Persistent Developmental Issues
Our first possible mechanism is illustrated by the most common disability classification we observed in pre-K and kindergarten, SLI. Students who present with speech difficulties in the early years are in one of two groups, those with transient issues (often speech) and those with persistent ones (often language). Given the younger age range of the pre-K children, we find it likely that many of the students identified as having a language issue severe enough to warrant an IEP may in fact have had transient issues that would have otherwise resolved before the beginning of kindergarten or shortly thereafter. McConkey et al. (2021) found that by parent report one in six 5-year-old children had a speech or language difficulty, which by age 9 had reduced to one in 12 children.
In fact, the ages of 3 to 5 are marked by both great developmental gains in most areas and great variability among children in exactly when milestones are achieved. It takes a very sensitive and informed teacher to understand the difference between transient developmental differences and those that would profit from specialized intervention. Many states, including Tennessee, require pre-K classrooms to be taught by a certified teacher. Having a certification in the primary grades (e.g., pre-K through Grade 4 or 8) will likely not provide the in-depth developmental preparation teachers need for working with very young children (Fowler, 2024). Added early childhood endorsements sometimes provided by states may offer insufficient training. Elementary licensed teachers may be ill equipped to facilitate the development of young children, especially with the increased emphasis on academic preparation and teaching a set, academically focused, scripted curriculum (Yoshikawa et al., 2013).
As noted earlier, in a large statewide study of kindergarten students, Shapiro (2023) reported a significant age effect, with the youngest kindergarten students more likely to receive a referral for special services: Younger students could be more likely to be referred to special education because age-typical developmental differences are attributed to signs of disability. Particularly in the early grades, when performance on academic measures and age are highly correlated, we might expect that the youngest children are more likely to be referred to special education because teachers have age-inappropriate expectations for skill acquisition and classroom behavior for the youngest children. (p. 163)
All the children in pre-K classrooms are young and encountering formal education with its behavioral and learning requirements for the first time.
The Consequences of Early Labeling
With the exception of a few states or districts implementing a universal pre-kindergarten program, these programs are targeted to children from low-income families. Low income is the highest priority in the TN-VPK program, and all the children in our sample qualified for free and/or reduced-price lunch. SES in general is associated with higher rates of referral for special education services (Schifter et al., 2019). Thus, children attending most state-funded pre-K classrooms are possibly at twice the risk for IEP designations in general: they are all young (taught by teachers whose training primarily focused on older children), and they are all from poorer families.
One response to our findings of the early IEP designations in pre-K could be that children will profit from receiving services early in their school careers, which could then prevent later school difficulties. Our data, however, match other explorations of receiving a label, especially in the early grades. In a large meta-analysis of the influence of diagnostic labels, Franz et al. (2023) concluded that “the simple fact that a child is diagnosed with a disorder can lead to more negative evaluations of the child” (p. 28), resulting in poorer academic and behavioral outcomes. Schifter et al. (2019) described this historically as the “paradox of special education.” Special education can provide children with needed services but also result in lowered expectations and stigma.
This stigma can result in higher rates of disciplinary offenses. In a large-scale longitudinal study, Anderson (2021) found that children with IEPs were more likely to be suspended or expelled, especially if they had a diagnosis in the K–5 grades. As in our data, Anderson found that the vast majority of disciplinary infractions were for “non-specified violations,” likely the same as “minor” infractions, those violations of school rules that are troublesome in school but not likely to be problems outside of school.
Labels persist. Children do not immediately exit from special education services once they receive an early diagnosis, or they may exit and then re-enter with a different diagnosis. Following the young kindergarten children who received a diagnostic label, Shapiro (2023) found that the labels were persistent; younger children experienced longer periods of time with an IEP than children who were older and received a diagnosis. She concluded that much of the effect concentrated on an early diagnosis of SLI, positing that this diagnosis is more subjective in nature. However, once an SLI diagnosis is received, the diagnoses tended to persist at least through the early grades.
A back of the envelope calculation of our data similarly shows that children who had an IEP for SLI in kindergarten were much more likely to later be identified as having a SLD—15.6% of children with SLI in kindergarten later were identified as having a SLD compared to only 5.4% of children without SLI in kindergarten. This, however, does not fully explain our findings as a significant majority of children identified as having a SLD in later grades, over 75%, were not identified for SLI in kindergarten. Thus, while early labeling does seem to predispose children to more long-term labels, it does not fully explain the patterns we observe in our data.
Pre-K in Formal Schooling Environments
Two puzzling findings in our data are the increase in referrals for a SLD beginning in second grade and accelerating through sixth grade, and the lower rate of identification for giftedness among TN-VPK students across the elementary grades. These longer-term effects of attendance require considerable thought.
Most of the pre-K classrooms studied here were in elementary schools, and many of the students in our sample who attended TN-VPK went on to attend later grades at the same school. Even if a child was not formally identified as having a disability in prekindergarten, it is possible that some children were informally labeled as struggling or misbehaving and that these informal labels led to increased scrutiny in later years. Alternatively, children may have been referred by a teacher for special education services in prekindergarten, but evaluations showed they did not meet the criteria for SLI or developmental delay at the time. This early referral may have increased the likelihood of subsequent referrals when students were older and eligible for identification of a SLD. We have no data on the number of children who were referred but then not found to be eligible for services, nor do we know if a referral alone could lead to future issues for a child.
An alternative possibility is that TN-VPK attendance resulted in later school enrollment decisions that differed from non-attenders. Studies of other public pre-K programs have shown that public school-based pre-K attendance may affect later enrollment through increased enrollment in public schools through at least third grade (Weiland et al., 2020) and greater school stability in the early grades (Conger et al., 2019). To the extent that TN-VPK attendance resulted in sorting into different schools throughout the early grades and those schools had different disability identification practices, such sorting may explain some of the impacts we see in special education service receipt in later grades. Although we are unable to explore this mechanism for the full TN-VPK sample, a follow-up study of over 800 study participants from the second cohort tracked students through third grade and found “no evidence in unadjusted or adjusted comparisons that the schools of students who attended VPK differed in quality from those of children who did not attend VPK” (Pearman et al., 2020, p. 555). We view this finding as evidence against the hypothesis that changes in later school enrollment resulting from TN-VPK attendance are responsible for the increased identification in the treatment group; however, school-specific practices around special education may have differed even if quality did not, leaving the door open for this mechanism as a potential explanation.
Another possible explanation is that the demands of formal schooling are too high and too rigid for many young students, resulting in behaviors that led teachers to refer them for special services. This would be in line with a growing concern regarding the developmental appropriateness of school-based pre-K programs that have proliferated in recent years (Burchinal et al., 2024; Dearing & Farran, 2022; Fuller & Leibovitz, 2021). This explanation would also help us understand the reduced number of TN-VPK students who were identified as gifted in later grades as past research has shown that many teachers have views of giftedness that do not allow for such problem behaviors (Carman, 2011).
We need to recognize the possibility of continuing effects from the early experiences children had in their pre-K classrooms. While all children with an IEP had more instances of suspensions and/or expulsions, those children who attended TN-VPK were significantly more likely to be suspended compared to children who did not attend but who also had an IEP. The TN-VPK students with an IEP also had significantly lower achievement scores than those with an IEP who did not attend. It appears that attending pre-K created an independent effect in addition to the effects from having an IEP.
What is it about pre-K classrooms that might bring this about? Recently, concerns have arisen about the didactic focus of current preschool programs (Whitaker et al., 2023) and the narrow skills focus that excludes the development of possibly more important skills for young children (McCoy & Sabol, 2025). Whitaker et al. assert that “the combination of redundant instruction and harsh interactions with teachers may cause children to disengage from learning, perhaps setting them on less positive academic trajectories during the early school years” (p.12). Empirical evidence from Phillips et al. (2022) supports this concern; they describe the effects on the development of self-regulation when Tulsa pre-K teachers exhibited a high rate of disapproval and negative behavior management approaches. These intrusive and overcontrolling behaviors on the part of the teachers were associated with less gain in self-regulation for children, sometimes, in the more extreme classrooms, leading to losses in self-regulation over the pre-K year. If pre-K is to be implemented even more widely, more attention must be paid to the characteristics of the classrooms and to accommodating the wide spectrum of behaviors young children exhibit.
Limitations
While the current study is one of the only randomized-controlled trials of public, state-funded pre-K, it is only one study, and the results provided here should be considered in concert with other rigorous research findings. Additionally, the current TN-VPK program has been through several rounds of program improvement and revision in the intervening years since the students in our sample attended. A similar evaluation of the current TN-VPK program may yield different results.
Regarding special education outcomes, we are only able to leverage whether students had an IEP in a given year. We know nothing about the rates of referral, where referrals originated, what processes were used for evaluation and screening, or what special education services these students have received across the different districts. While this is a common limitation for studies such as ours that rely on administrative data, it prevents us from understanding the exact mechanism by which pre-K participation contributed to the increased prevalence of special education in our sample.
One possible limitation could be that our data all involve a statewide program in a single state. We have investigated whether Tennessee could be a high referral state thus contributing to our findings. Our investigation reveals that, if anything, Tennessee tends to under-refer, reporting an IEP rate of 13.1% for students in first through 12th grade in 2022 compared to a national rate of 14.9% (IDEA Section 618 Data Products, Part B, Data Display, Tennessee 2022).
Future Research
Future research is needed in several areas. First, it would be greatly beneficial to researchers to have access to more detailed data not only on whether students are participating in special education but also on how their participation varies and how long they retain an IEP designation. Without information regarding referrals, the screening and evaluation processes, and services rendered, it is difficult to fully understand both the impacts of interventions on special education outcomes as well as the impact of participation in special education on other educational outcomes.
Second, as pre-K programs expand, including with universal access in some states, it is imperative that states and districts rigorously investigate the effects. In most states, there is a greater demand for placement than there is room in the program. This situation lends itself to a lottery study that would not be so difficult for states and/or districts to enact. States would have to document all who apply, select attendees through a lottery draw (something parents would find fair), and then, most important, give all who applied a state education ID number so that they can be tracked through administrative data. The possibility, revealed by our findings, that children may experience long-term effects of early labeling on achievement and later disciplinary infractions is too problematic to ignore. This type of prospective, longitudinal research stands in stark contrast to the usual evaluations of the long-term effects of pre-K as shown in a recent Science article (Burchinal et al., 2024).
Finally, as pre-K becomes an increasingly prevalent part of the education landscape, more attention must be paid to credentialing teachers, particularly ensuring their deep knowledge of young children’s development. Schools and districts often prefer teachers with a broader license, say PK-Grade 4 or even Grade 8. Those teachers are easier to move among classrooms when shortages emerge. However, requirements of broad teacher preparation programs that include learning to teach reading and math do not likely leave room for the in-depth developmental preparation teachers need to work with young children. Especially as districts and states enact specific curriculum requirements, it is possible that the focus will continue to be whole group instruction with little facilitation of the typical and transient developmental differences among children.
Supplemental Material
sj-pdf-1-epa-10.3102_01623737251413228 – Supplemental material for Special Education Outcomes for Students Attending a State-Funded Pre-K Program
Supplemental material, sj-pdf-1-epa-10.3102_01623737251413228 for Special Education Outcomes for Students Attending a State-Funded Pre-K Program by Easton Stone Dawson, Dale C. Farran and Kelley Durkin in Educational Evaluation and Policy Analysis
Footnotes
Acknowledgements
This work would not have been possible without the assistance of the Tennessee Department of Education (TDOE) and the Tennessee Education Research Alliance. Notwithstanding any TDOE data or involvement in the creation of this research product, the TDOE does not guarantee the accuracy of this work or endorse the findings. Any errors are the sole responsibility of the authors. Special thanks to Mark Lipsey for his expert advice and leadership on this project, Sarah Wiesen for her help in compiling related references for this article, and Jane Hughart and Ilknur Sekmen for their hard work in collecting, cleaning, and analyzing data for this project. We are also grateful for the support of multiple school districts and school administrators throughout Tennessee.
Declaration of Conflicting Interests
The authors declared no potential conflicts of interest with respect to the research, authorship, and/or publication of this article.
Funding
The authors disclosed receipt of the following financial support for the research, authorship, and/or publication of this article: This research was supported by the U.S. Department of Education Institute of Education Sciences Grants R305E090009 and R305A210130 and the U.S. Department of Health and Human Services National Institute of Child Health and Human Development Grant R01HD079461-01. The opinions expressed are those of the authors and do not represent the views of the Institute of Education Sciences, the U.S. Department of Education, or the National Institute of Child Health and Human Development.
Authors
EASTON STONE DAWSON, MEd, is a doctoral student at Peabody College at Vanderbilt University. His research focuses on early childhood education programs and their impacts.
DALE C. FARRAN, PhD, is an Emerita professor at Peabody College at Vanderbilt University. Her research focuses on interventions for and the development of children from high-risk circumstances.
KELLEY DURKIN, PhD, is a research assistant professor at Peabody College at Vanderbilt University. Her research focuses on improving math instruction in pre-K through high school classrooms, understanding misconceptions, and evaluating educational programs.