
Abstract
In open-fit hearing aids (HAs), the interaction between the direct and processed sound leads to comb-filtering and, thus, perceived coloration effects. The magnitude of these effects depends on the level difference between the direct and processed sound and on the processing delay. A critical issue for HA uptake and use is own-voice perception, which the current study focused on. Its aims were to investigate (1) whether short processing delay is preferred over longer delays, (2) how processing delay influences different perceptual dimensions related to own-voice perception, and (3) whether spectral discrimination abilities can predict delay preference. Twenty-four individuals with mild-to-moderate hearing impairment participated. Using prototype receiver-in-the-canal HAs, processing delays of 0.5, 5, and 10 ms were compared. Delay preference was assessed using a paired-comparison task. Perceptual dimensions relating to own-voice perception were investigated using a customized version of the “Own Voice Qualities” questionnaire. Spectral discrimination abilities were assessed using a spectral ripple discrimination (SRD) task. The analyses showed that the 0.5-ms delay was preferred over the longer delays. Furthermore, the 0.5-ms delay received better ratings related to tonality perception (e.g., attributes such as metallic and sharp) and own-voice quality compared to the 10-ms delay. SRD abilities did not predict delay preference. Overall, these results provide insights into how open-fit HAs can be optimized with respect to own-voice perception.
Introduction
Sound quality is an influential factor for hearing aid (HA) satisfaction and perceived HA benefit (Bannon et al., 2023; Picou, 2020). Satisfaction with the sound of one's own voice is critical for HA satisfaction (Kochkin, 2010) and has been linked to HA non-use (Kochkin, 2000). Under normal conditions, one's voice signal reaches the cochlea via air- and bone-conduction pathways (e.g., Pörschmann, 2000; Reinfeldt et al., 2010; Stenfelt, 2011). Conventional HAs amplify air- but not bone-conducted sound, which can alter the perception of one's own voice (Stiefenhofer, 2022). In general, own-voice perception is affected whenever the air- or bone-conduction sound signals are altered, for example by acoustic coupling (e.g., an earmold) or when listening to a recording of one's own voice, where bone-conduction does not play a role (Pörschmann, 2000).
To investigate own-voice complaints among HA users systematically, Laugesen et al., (2011) developed the ‘Own Voice Qualities' (OVQ) questionnaire. The OVQ includes 102 items covering multiple dimensions, including intensity control, group conversations, and specific own-voice attributes. It has since been used in a handful of studies to explore factors influencing own-voice perception, that is, (1) open versus closed domes (Hengen et al., 2018; Laugesen et al., 2011), (2) unaided versus aided listening (Hengen et al., 2018), (3) initial HA fitting versus re-fitting (Hengen et al., 2020), and (4) normal hearing (NH) versus hearing impairment (HI) (Hengen et al., 2018, 2020; Laugesen et al., 2011). These studies found that open domes and NH thresholds were associated with better (lower) OVQ ratings, while closed domes, aiding, and HI tended to be associated with poorer (higher) ratings.
Because open fittings can help counteract the occlusion effect, they tend to improve own-voice perception relative to closed fittings (e.g., Dillon, 2012). Closed fittings increase the level of low-frequency bone-conducted sound, thereby reducing the influence of air-conducted sounds on perception (Stenfelt & Reinfeldt, 2007). The occlusion effect relates mainly to the perception of lower-frequency components of self-generated sounds, such as own voice, chewing, and swallowing, which are often described as booming (Dillon, 2012; Kuk & Ludvigsen, 2002).
Open fittings have also drawbacks. For example, they give rise to comb-filtering and thus poorer sound quality. Comb-filtering arises when the delayed HA sound interacts with the undelayed direct sound in the ear canal, producing frequency-specific addition and cancellation effects (e.g., Stone et al., 2008). This leads to ripples in the frequency spectrum of the combined sound signal. As the processing delay increases, the spectral distance between the ripples decreases and the number of ripples for a given frequency interval increases (e.g., Bramsløw, 2010). As the current study focuses on the perceptual consequences of processing delay in open-fit HAs, studies related to that focus area will be reviewed below, whereas studies focusing on closed fittings (e.g., Stone & Moore, 1999, 2002, 2003, 2005) will not be considered.
A few studies have investigated own-voice perception in relation to processing delay in open-fit HAs (Agnew & Thornton, 2000; Bramsløw, 2010; Groth & Birkmose, 2004; Stone et al., 2008). Despite differences in methodology across these studies, shorter processing delays were generally preferred. Agnew and Thornton (2000) found a processing delay of 10 ms to be objectionable for listeners with NH. Groth and Birkmose (2004) found that listeners with NH and HI rated a 10-ms delay as more disturbing than 2 and 4 ms of delay. Stone et al. (2008) found that disturbance ratings increased with longer processing delay, and decreased with increasing gain. Bramsløw (2010) found no difference in the sound quality ratings of participants with NH and HI for delays of 5, 7, and 10 ms.
The perceptual effects of short (<2 ms) processing delays have, independent of own-voice perception, received little attention so far. Two recent studies investigated individual factors that can explain preference for very short processing delay (Lelic et al., 2022; Súsonnudóttir et al., 2024). Lelic et al. (2022) found that (near-)normal low-frequency hearing thresholds were associated with a preference for a 0.5-ms delay relative to delays of 2, 5, and 10 ms. In a follow-up study, Súsonnudóttir et al. (2024) found that spectral discrimination abilities were a more effective predictor of delay preference than low-frequency hearing thresholds. Lelic et al. (2022) and Súsonnudóttir et al. (2024) also found that, for external stimuli, short processing delay was preferred over longer delays. These findings raise the questions of how processing delay influences own-voice perception and whether spectral discrimination abilities can predict delay preference when own voice is the test stimulus. As alluded to above, comb-filtering effects can be expected to differ between own voice and external stimuli, as the bone-conduction path plays a role for the former but not the latter type of stimulus.
To summarize, own-voice perception has been linked to HA satisfaction. Prior research on own-voice perception by HA users has focused on the effects of dome type (Hengen et al., 2020; Laugesen et al., 2011), HA experience (Hengen et al., 2020), and HI (Hengen et al., 2018, 2020; Laugesen et al., 2011). Currently, there is a lack of knowledge about how own voice-related perceptual dimensions are influenced by processing delay. Previous studies about the effects of processing delay have, independent of stimulus type, focused on overall disturbance/annoyance caused by processing delay (Goehring et al., 2018; Groth & Birkmose, 2004; Stone et al., 2008) or on preferred processing delay (Bramsløw, 2010; Lelic et al., 2022; Súsonnudóttir et al., 2024). It is still unclear how different perceptual dimensions related to voice quality are affected by processing delay, for example sharpness, hollowness, or echo-like sensations related to the perception of reflections and room size (Laugesen et al., 2011).
In view of the above, the purpose of the present study was to investigate the effects of processing delay on own-voice perception using prototype receiver-in-the-canal HAs. The effects of processing delay in open-fit HAs in relation to own-voice perception have not previously been investigated for delays shorter than 2 ms (Groth & Birkmose, 2004). Thus, delays of 0.5, 5, and 10 ms were implemented in the test devices and compared in terms of preference. The three delays were chosen as they are representative of modern HAs (e.g., Lelic et al., 2022), with 0.5 ms and 10 ms of processing delay representing the lower and upper boundaries of the commercially available range. To unravel the perceptual dimensions related to own-voice perception that are influenced by processing delay a customized questionnaire based on the OVQ was used. To follow up on the findings of Súsonnudóttir et al. (2024) concerning the link between spectral discrimination abilities and delay preference, spectral ripple discrimination (SRD) thresholds were measured to explore their predictive power in relation to delay preference for own-voice perception.
Methods
The current study was evaluated by the Regional Committees on Health Research Ethics for Southern Denmark (case no. 20212000-06) and the Regional Committees on Health Research Ethics for the Capital Region of Denmark (case no. H-18056647). In both cases, full ethical approval was deemed unnecessary. Therefore, waivers were granted, as is standard practice in the Danish system. The participants received written and oral instructions about the aims of the study and then signed an informed consent form. They were offered financial compensation for their participation.
Participants
The inclusion criteria for participation in the current study were as follows: (1) Symmetrical mild-to-moderate sensorineural HI, (2) age 18 years or older, and (3) proficiency with the Danish language. Twenty-four Danish-speaking individuals (10 females, 14 males) aged 62–83 years (mean: 72 years) with symmetric mild-to-moderate HI participated. Eighteen of the participants were experienced HA users. The chosen sample size was based on the sample sizes used in similar studies (e.g., Bramsløw, 2010; Súsonnudóttir et al., 2024). If, for a given individual, no audiogram was available or the latest available audiogram was older than six months, otoscopy and pure-tone audiometry were performed. The mean pure-tone average hearing loss calculated across 0.5, 1, 2, and 4 kHz (PTA4) was 34.6 dB HL for the participants’ right ears (range: 12.5–50.0 dB HL) and 34.0 dB HL for their left ears (range: 22.5–47.5 dB HL). Figure 1 shows individual and mean audiometric thresholds for the participants’ right and left ears.

Individual (dashed lines) and mean (thick line) air-conduction thresholds for the participants’ right and left ears.
The participants were mainly recruited from the Odense municipality area, either by word of mouth or from a participant database available at the University of Southern Denmark. Four participants were recruited from a participant database available at WSA, Lynge. Roughly half of the participants had previous experience with sound quality judgements, while the remaining participants were naïve listeners.
HA Fittings
Widex prototype receiver-in-the-canal HAs with a sampling rate of 33.1 kHz were used as test devices. The HAs were programmed to have a fixed directional microphone setting (“Front Focus”). Noise reduction was activated, while adaptive feedback cancellation and sound classification were deactivated. The HAs were configured to have three programs. The first program had a delay of approximately 0.5 ms, which was nearly constant in the frequency range from 0.5 to 8 kHz. For the two other programs, a delay line was implemented in the test devices that allowed extending the delay to 5 and 10 ms. All HAs were fitted with open domes and Widex V.2 M receivers.
Typically, open-fit HAs provide only limited amplification in the low-frequency range (e.g., Groth & Birkmose, 2004; Lelic et al., 2022). In the current study, amplification was provided down to approximately 1 kHz. At lower frequencies, the gain decreased by approximately 12 dB per octave. The proprietary Widex Fitting Rationale (WFR; Smeds & Schmidt, 2026) was used to calculate individual target insertion gains (IGs). Due to the test devices not having adaptive feedback cancellation activated, the fitting rationale was modified to achieve acoustic stability for conversational speech levels. That is, the target IG for levels below 65 dB SPL was limited to the target IG provided for a speech signal at 65 dB SPL. Consequently, for levels below 65 dB SPL the HA provided linear amplification. For levels above 65 dB SPL, all adaptive features, except adaptive feedback cancellation and sound classification, were activated, such as compression and noise reduction.
A feedback test was conducted to determine the maximum stable gain before acoustic instability. To ensure adequate audibility of conversational speech, the maximum available gain was required to be equal to or greater than the prescribed gain at 65 dB SPL for frequencies between 1 and 4 kHz. For two participants, this requirement could not be achieved. In one case, the gain deviated by −4.5 dB at 4 kHz for the right ear, while in the other case it deviated by −6.5 dB at 4 kHz for the left ear and by −3.5 and −7.5 dB at 3 and 4 kHz for the right ear. Furthermore, due to an error in the fitting procedure that was discovered after the first 10 participants had been fitted, the above-mentioned target IG limitation for levels below 65 dB SPL was ineffective for these participants. Consequently, these participants likely received more gain at low levels. This would have made differences between the different processing delays less noticeable, as the comb-filter effect is most pronounced when the direct sound and amplified HA sound are equal in level (e.g., Stone et al., 2008). Despite this, all participants were included in the data analysis, as the results were not noticeably affected by this (for more details, see the Supplemental Materials).
Figure 2 shows the real-ear IGs (REIG) before performing the feedback test. The REIG were measured on a Brüel & Kjær high-frequency head and torso simulator (HATS) with a 65-dB-SPL speech signal played from a loudspeaker 1 m in front of the HATS. The speech signal used was the International Speech Test Signal (Holube et al., 2010).

Boxplots of real-ear insertion gains for the participants’ left (blue) and right (red) ears. The measurements were performed on a Brüel & Kjær high-frequency HATS with a 65-dB-SPL speech signal. Boxes show IQRs. Horizontal lines show median values. Whiskers show minimum and maximum values. Red dots show potential outliers. HATS: head and torso simulator; IQR: interquartile range.
Preferred Processing Delay
Overall preference for the three tested processing delays (0.5, 5, and 10 ms) was assessed using a paired-comparison task (e.g., Lelic et al., 2022; Súsonnudóttir et al., 2024). Since the focus was on own-voice perception, the participants were instructed to speak and listen to their own voice throughout the study. They were encouraged to speak freely. Materials for reading aloud (e.g., rhymes and short stories) were provided, if needed.
The three possible combinations of delays were compared three times each, resulting in a total of nine comparisons. The study design was single blinded, and the order in which the processing delays were presented was randomized. The paired-comparison task was performed with a graphical user interface (GUI) implemented in Matlab version 2023a (The MathWorks Inc., Natick, Massachusetts). The participants could switch between the delays on the GUI as often as needed. The paired-comparison task was performed twice (i.e., 2 × 9 comparisons), where the first nine comparisons served as training. For any given pair, the participants were asked to indicate which delay they preferred; they were not asked about the strength of their preferences.
Perceptual Dimensions of Own Voice: customized OVQ (cOVQ)
To shed light on the effects of processing delay on own-voice perception, the OVQ was used. The 102 OVQ items are divided into six categories (Laugesen et al., 2011): (1) General own voice-related questions, (2) Level control, (3) Speak and hear, (4) Whisper, (5) Sound qualities, and (6) Emotional consequences. The questionnaire is available in three versions to accommodate the following target groups: (1) Bilateral HA users, (2) unilateral HA users, and (3) HA non-users. All 102 OVQ items are completed using a 13-point Likert scale, ranging from 0 (‘completely disagree’) to 12 (‘completely agree’). Additionally, there is an option to select ‘not applicable.’ The rating scale is shown in Table 1.
cOVQ Questionnaire with 19 OVQ Items and Two Added Preference-Related Items.
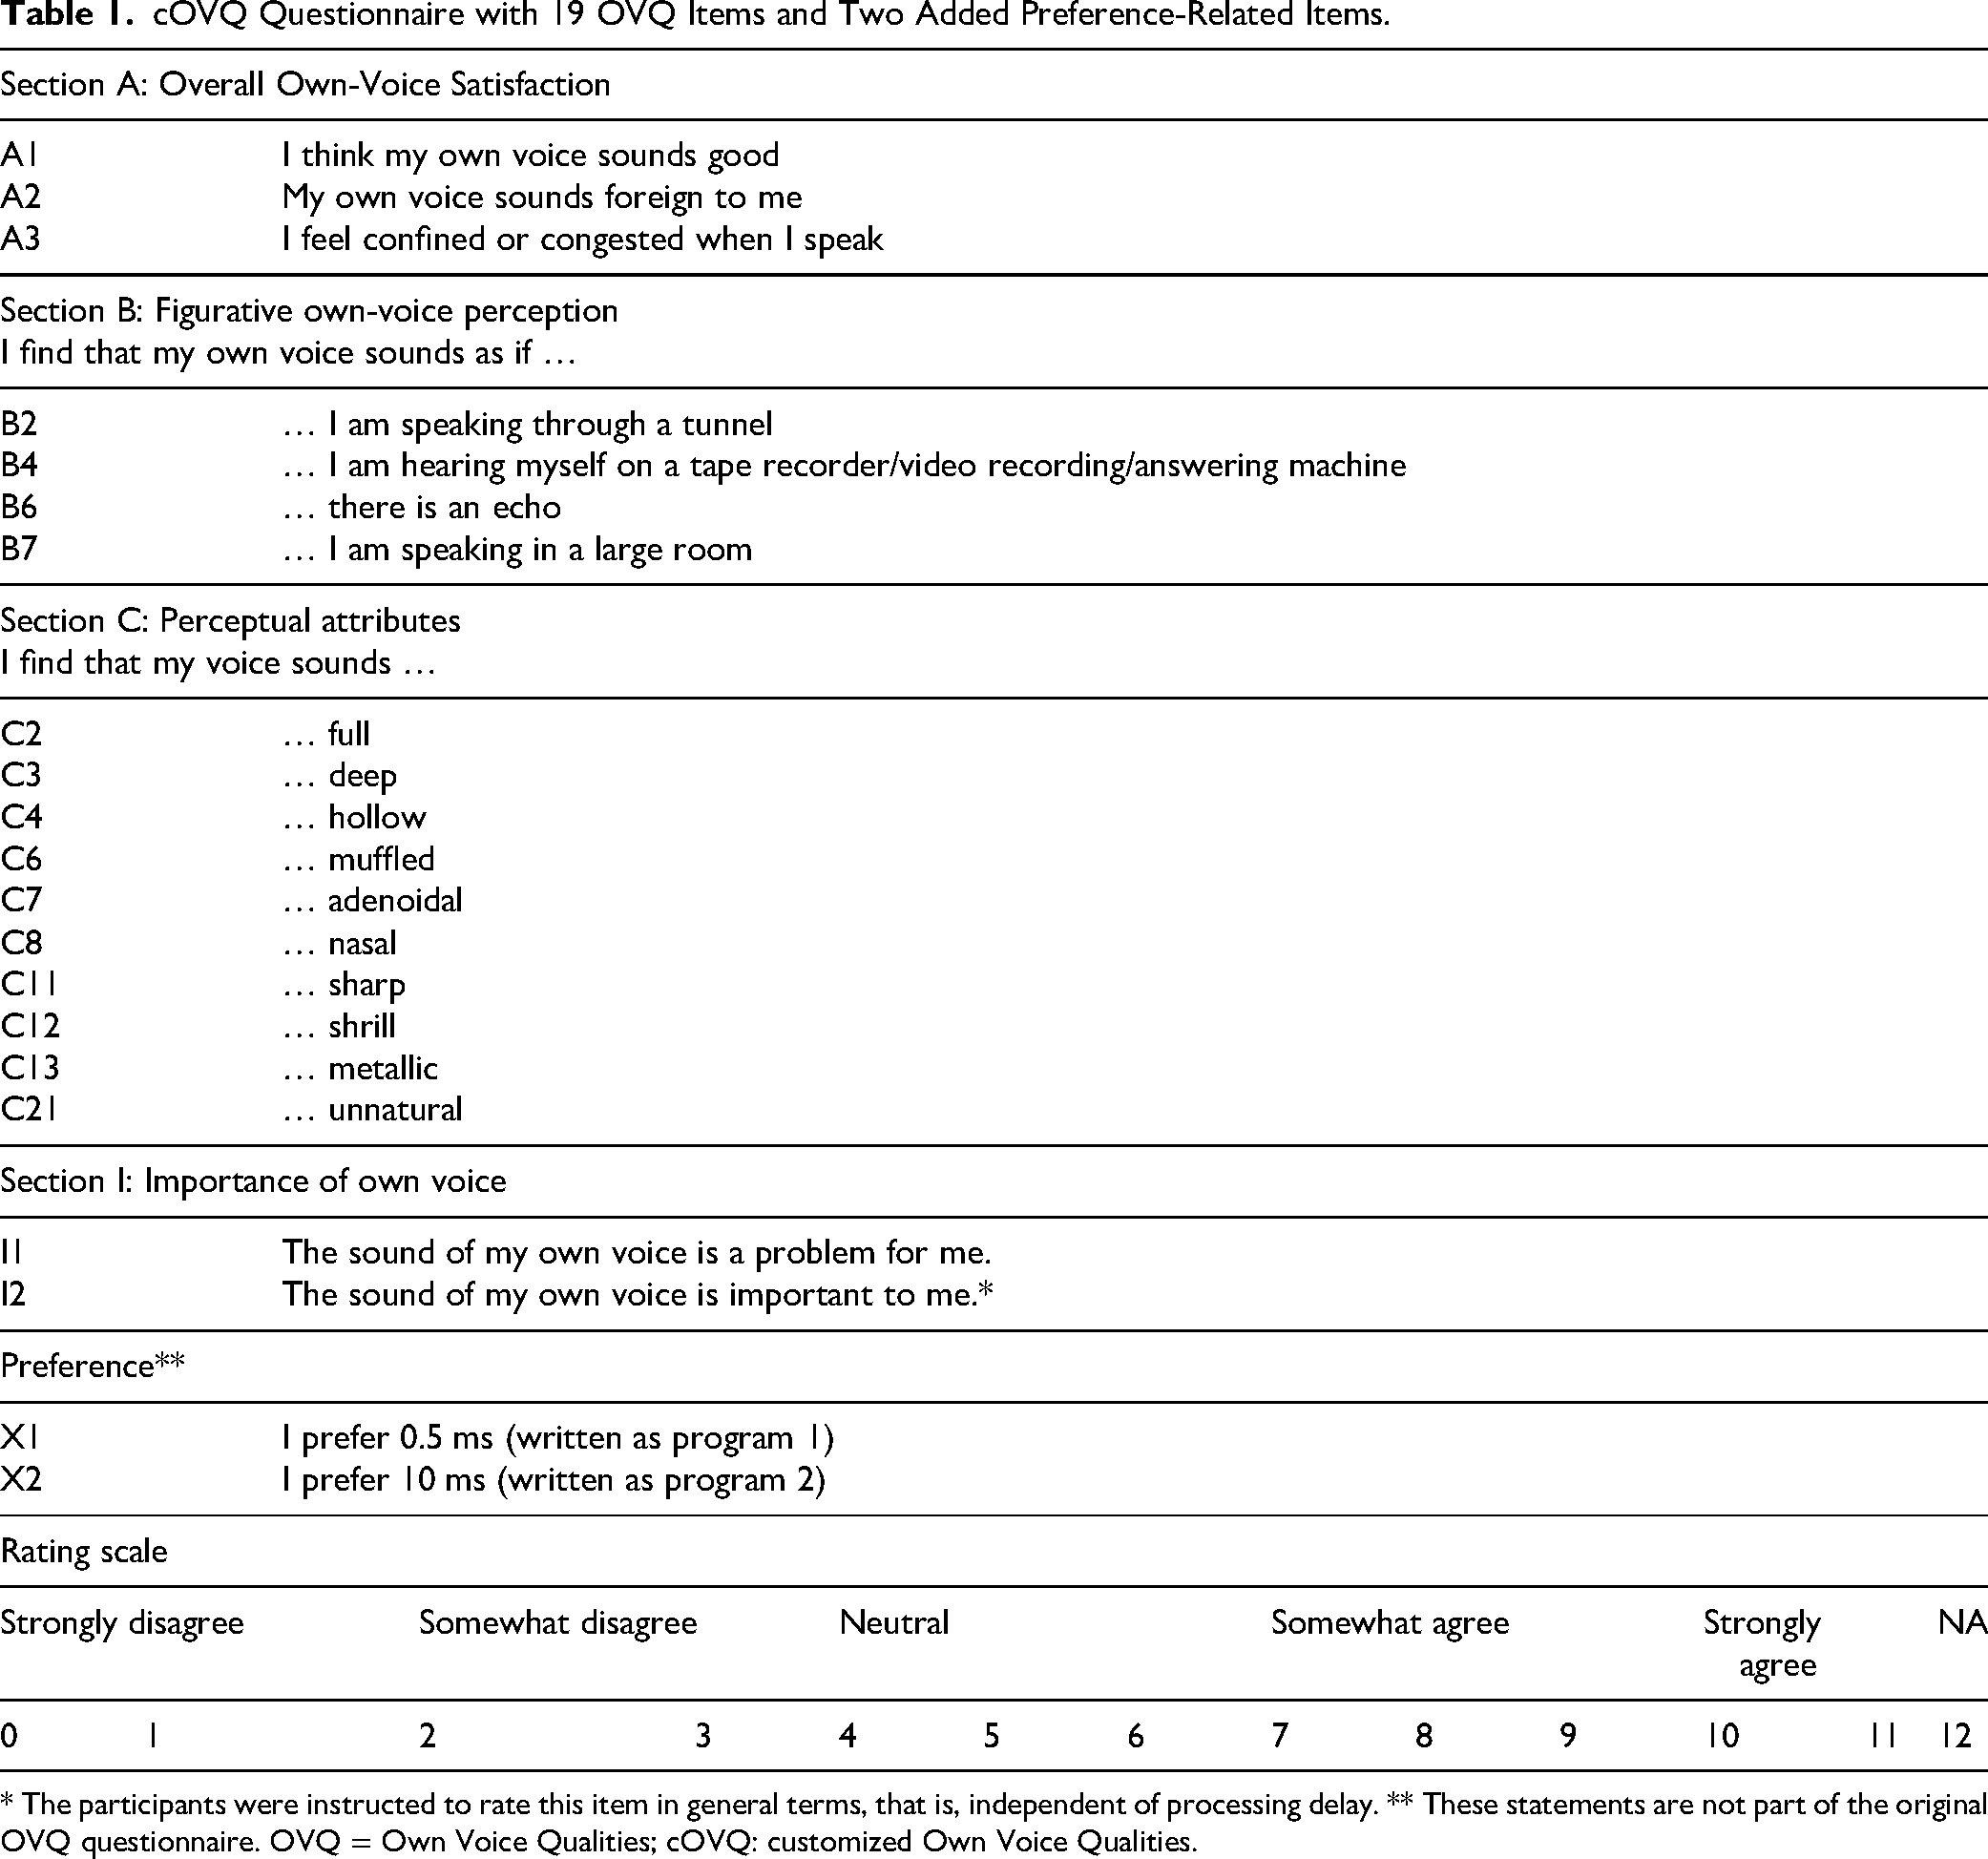
* The participants were instructed to rate this item in general terms, that is, independent of processing delay. ** These statements are not part of the original OVQ questionnaire. OVQ = Own Voice Qualities; cOVQ: customized Own Voice Qualities.
Item Selection
Because the current study focused on the sound quality of one's voice, not all 102 OVQ items were relevant. Items relating to long-term use, conversations, level control, and noisy environments were excluded, leaving 35 items. These items were assessed in a pilot study with two processing delays and a group of NH individuals to identify potential redundancies. Based on a principal component analysis, all three items from Section A were included, while Section B was reduced from seven to four items, and Section C was reduced from 15 to 10 items. Two items from Section I were kept, resulting in selection of 19 OVQ items. In addition, two statements (X1 and X2) regarding overall preference were added to investigate whether the participants preferred the short or long (0.5 or 10 ms) delay after completing the assessments. In total, there were therefore 21 items. In the following, this set of 21 items will be referred to as ‘customized OVQ’ (cOVQ). The included items are shown in Table 1.
Procedure
Eighteen of the 21 cOVQ items were used to compare 0.5 ms and 10 ms of delay. The 5-ms processing delay was not included, since the aim was to unravel the perceptual effects of the lower and upper boundary of processing delay. The remaining item, I2, was administered independently of processing delay. That is, the participants were instructed to respond to this item as a general statement about the importance of own-voice quality. Item X1 was only completed for the 0.5-ms delay, while X2 was only completed for the 10-ms delay.
The cOVQ was administered in an interview-style fashion, as recommended by Laugesen et al. (2011). The participants’ task was to evaluate both HA programs (delays) based on the cOVQ items. Each cOVQ item was evaluated in relation to one program followed by the other program. For Section C, a list of definitions was provided, which the participants were encouraged to consult. If the participants did not understand the given item, they could select ‘not applicable’. The participants could switch between the programs using a GUI. The responses were noted on a physical questionnaire using three different colors. The first color was used for program 1, the second color for program 2, and the third color for I2, X1, and X2.
Spectral Ripple Discrimination
To assess spectral discrimination abilities, the SRD task used by Súsonnudóttir et al. (2024) was adopted.
Stimulus Generation and Presentation
On each trial, white noise with a sample rate of 48 kHz and a duration of 1.5 s was generated in Matlab. The reference signals were created by delaying the noise by Δt and adding it to its undelayed version, resulting in a comb-filter pattern with ripples spaced at 1/Δt Hz. The target signals were created in the same manner, except that the delayed noise was multiplied with a step function alternating between +1 and −1 with an inversion rate of 4 Hz (i.e., every 0.25 s), prior to adding it to the delayed noise. The inversion ensures that participants must listen for spectral changes, as there are no differences in spectral bandwidth, ripple depth, ripple density, or intensity between the target and reference signals. The reference and target signals were bandpass-filtered from about 400 to 1300 Hz to emphasize the frequency range where comb-filtering in HAs is most likely to occur (Stiefenhofer, 2022). To compensate for the participants’ elevated hearing thresholds, all signals were linearly amplified with individual frequency-dependent gain prescribed by the NAL-NL2 fitting rationale (Keidser et al., 2011) for a 65-dB-SPL speech input. Finally, 5-ms Hanning window ramps were applied to the onsets and offsets. The signals were presented monaurally via free-field-equalized Sennheiser HDA200 headphones.
Procedure
SRD thresholds were measured using a 3-alternative forced-choice procedure with a 1-up 2-down tracking rule, converging at 70.7% accuracy (Levitt, 1971). On any given trial, the target signal was allocated randomly to one of the three intervals. Ripple spacing was the tracking variable, with a starting value of 150 Hz. The initial step size was 50 Hz, which was halved upon correct identification for every lower reversal until the minimum step size was reached. Measurements were based on six reversals after reaching the minimum step size of 12.5 Hz.
Súsonnudóttir et al. (2024) tested 20 individuals with symmetrical HL and found no statistical difference between left- and right-ear SRD thresholds. Therefore, only the ear with the smaller PTA4 for each participant was tested here. Three measurements were obtained, based on which a mean threshold was calculated. The standard error (SE) of the three measurements was also calculated. Before conducting any measurements, one training run was performed. The training run was a shortened version of a measurement run.
General Procedure
All measurements were completed within one visit to the audiological laboratory at the University of Southern Denmark or the audiological laboratory at WS Audiology. All measurements were performed in a soundproof booth with identical test equipment. Initially, the participants were given a general introduction to the study. Then otoscopy and audiometry were performed, if applicable (see above). The SRD measurements were conducted next, and the HA fittings were prepared in the meantime. Once the SRD measurements had been completed, the HA feedback test was performed. Afterwards, the cOVQ was administered and the paired comparisons were conducted in a balanced order across participants.
Data Preprocessing and Analyses
The preprocessing and analysis of the data are described below. For all analyses, a significance level of .05 was used. Where appropriate, family-wise correction for multiple comparisons based on the Bonferroni–Holm method was applied.
Preferred Processing Delay
The binary responses from the pairwise comparisons were transformed into proportion-preferred scores (Neher et al., 2011; Súsonnudóttir et al., 2024). Briefly, the number of wins for each processing delay was identified and divided by the total number of comparisons, that is, 0.5 ms versus 5 and 10 ms; 5 ms versus 0.5 and 10 ms; and 10 ms versus 0.5 and 5 ms. Since the resultant scores were not normally distributed, non-parametric testing was performed. For this purpose, Friedman's test was used. Post-hoc comparisons were performed using the Wilcoxon signed-rank test.
Perceptual Dimensions of Own Voice: cOVQ
The analysis of the cOVQ scores involved three steps: (1) Clustering of items, (2) identification of clusters associated with own-voice satisfaction, and (3) comparison of 0.5- and 10-ms delays in terms of overall preference.
Clustering of Items
Sections B and C of the cOVQ contained 14 items, and it was assumed that the scores for some of them would be correlated with each other. Furthermore, it was assumed that untrained participants would not necessarily be able to distinguish between similar attributes, such as ‘adenoidal’ (C7) and ‘nasal’ (C8), both of which are related to nasal-cavity resonances. Therefore, the first step of the cOVQ analysis was to group the items in Sections B and C into meaningful clusters. To this end, agglomerative hierarchical clustering was employed with the aim of identifying items suitable for creating composite variables. In the literature, this approach is referred to as “bottom-up clustering” (James et al., 2023).
When performing agglomerative hierarchical clustering, three measures have to be considered: (1) a distance metric, (2) a linkage metric, and (3) the number of identified clusters (Gere, 2023; James et al., 2023). A Euclidean distance metric was applied, as is common practice (Gere, 2023). Ward's method, also referred to as the minimum variance method, was used for the linkage metric, as it creates clusters with the smallest within-cluster variance and is sensitive to outliers (Gao et al., 2023; Vijaya et al., 2019). Following recommendations of James et al. (2023), the number of clusters was determined based on visual inspection of dendrograms obtained for the items from Sections B and C. It was verified that the items belonging to a given cluster were coherent in terms of their meanings.
Next, cluster verification was performed. Since no independently collected dataset was available for this purpose, the original dataset was split into two halves, as suggested by Gere (2023). Verification was performed several times by splitting the dataset in different ways. Overall, only minor deviations were found between the clusters identified based on the entire dataset and those identified based on the various verification clusters. The results based on the entire dataset are therefore reported.
Finally, composite variables were derived based on the identified clusters. The composite variables were obtained by calculating the median score for all items or statements belonging to a given cluster. Labels were then assigned to each cluster, each label describing the corresponding items or statements in a neutral manner.
Identification of Clusters Associated With Own-voice Satisfaction
To identify Section-C items related to own-voice satisfaction, Hengen and colleagues (2018) performed a Spearman correlation analysis for each Section-C item and statement A1 (‘I think my own voice sounds good’). Positive correlations were assumed to reflect attributes contributing to own-voice satisfaction, while negative correlations were assumed to reflect attributes contributing to own-voice dissatisfaction. In the current study, a corresponding correlation analysis was performed to identify clusters associated with own-voice satisfaction.
Comparison of cOVQ Scores for Delays of 0.5 and 10 ms
To investigate if there was a significant difference between the cOVQ scores for delays of 0.5 and 10 ms, a Wilcoxon signed-rank test was performed on the Section-A and -I statements, along with the Section-B and -C clusters. Results from the Spearman correlation analysis were used to determine whether the Section-C clusters contributed to own-voice satisfaction with either 0.5 or 10 ms of delay.
Preference for Short and Long Delay
Using the Wilcoxon signed-rank test, the preference scores for items X1 and X2 were compared to determine whether there was a significant difference between the average ratings for delays of 0.5 and 10 ms.
Spectral Ripple Discrimination
To investigate the predictive power of spectral discrimination abilities with respect to delay preference, two linear regression analyses were performed. In each case, the preference scores for a 0.5 ms delay were treated as the dependent variable, while the SRD thresholds were treated as the independent variable. Normal distribution of the residuals was verified based on residual plots and QQ plots, while outliers were assessed using Cook's distance measure (Field et al., 2013).
The first model, based on all data, did not meet the assumptions of normality due to one datapoint with a Cook's distance value of 1.3. When the Cook's distance equals or exceeds 1, this indicates an extreme outlier (Field et al., 2013). The second model, without that datapoint, had residuals that were free from any clear outliers (all Cook's distance values <1).
Results
Preferred Processing Delay
Figure 3 shows the proportion-preferred scores as a function of processing delay. Friedman's test revealed a significant effect of processing delay [

Boxplots of proportion-preferred scores (ordinate) as a function of processing delay (abscissa). Boxes show the IQRs. Whiskers show minimum and maximum scores. IQRs = Interquartile ranges.
Results of Post-hoc Testing Based on the Wilcoxon Signed-Rank Test Performed on the Proportion-Preferred Scores.

p-values are corrected using the Bonferroni–Holm method.
Perceptual Dimensions of Own Voice: cOVQ
Item Clusters
The agglomerative hierarchical clustering resulted in two and three clusters for Sections B and C, respectively, as evident from the dendrograms in Figure 4. For Section B, the two clusters contained the items: (1) B2 and B4 and (2) B6 and B7. For Section C, the three clusters contained the items: (1) C2 and C3, (2) C6, C7, and C8, and (3) C4, C11, C12, C13, and C21. Based on these clusters, composite variables were calculated, all items being weighted equally. The chosen cluster labels and cOVQ items are listed in Table 3. For better clarity, the clusters were labeled with descriptors capturing the meaning of the individual items as much as possible.

(A) Dendrogram for Section-B items. (B) Dendrogram for Section-C items. The abscissa shows individual cOVQ items. The ordinate shows pairwise distances according to the Euclidean distance metric. Dashed black lines indicate identified clusters. cOVQ = customized Own Voice Qualities.
Clusters Associated With Own-Voice Satisfaction
To identify clusters related to own-voice satisfaction, Spearman correlations between scores for the A1 statement (‘I think my own voice sounds good’) and scores for each of the Section-C clusters (as listed in Table 4) were calculated.
Clusters Identified for Items in Sections B and C.

The first column contains the chosen cluster labels, while the second column contains the cOVQ items belonging to each cluster. cOVQ = customized Own Voice Qualities.
Spearman Correlations Between A1 Statement Scores and Section-C Cluster Scores Related to Overall Own-Voice Satisfaction.

p-values are corrected using the Bonferroni–Holm method.
The Balanced cluster was positively correlated with item A1, suggesting that it is related to greater own-voice satisfaction. The Veiled and Tonal clusters showed negative correlations, implying negative associations with own-voice satisfaction.
Comparison of cOVQ Scores for Delays of 0.5 and 10 ms
Overall Own-voice Satisfaction and Importance of Own Voice (Sections A and I). Figure 5(a) shows boxplots of the scores for Sections A and I from the cOVQ. All assessments were carried out for the two processing delays, 0.5 and 10 ms, except for item I2 (blue), which was completed independently of processing delay. Most participants agreed with this statement, as indicated by a high median score of 11 (IQR: 2.00).
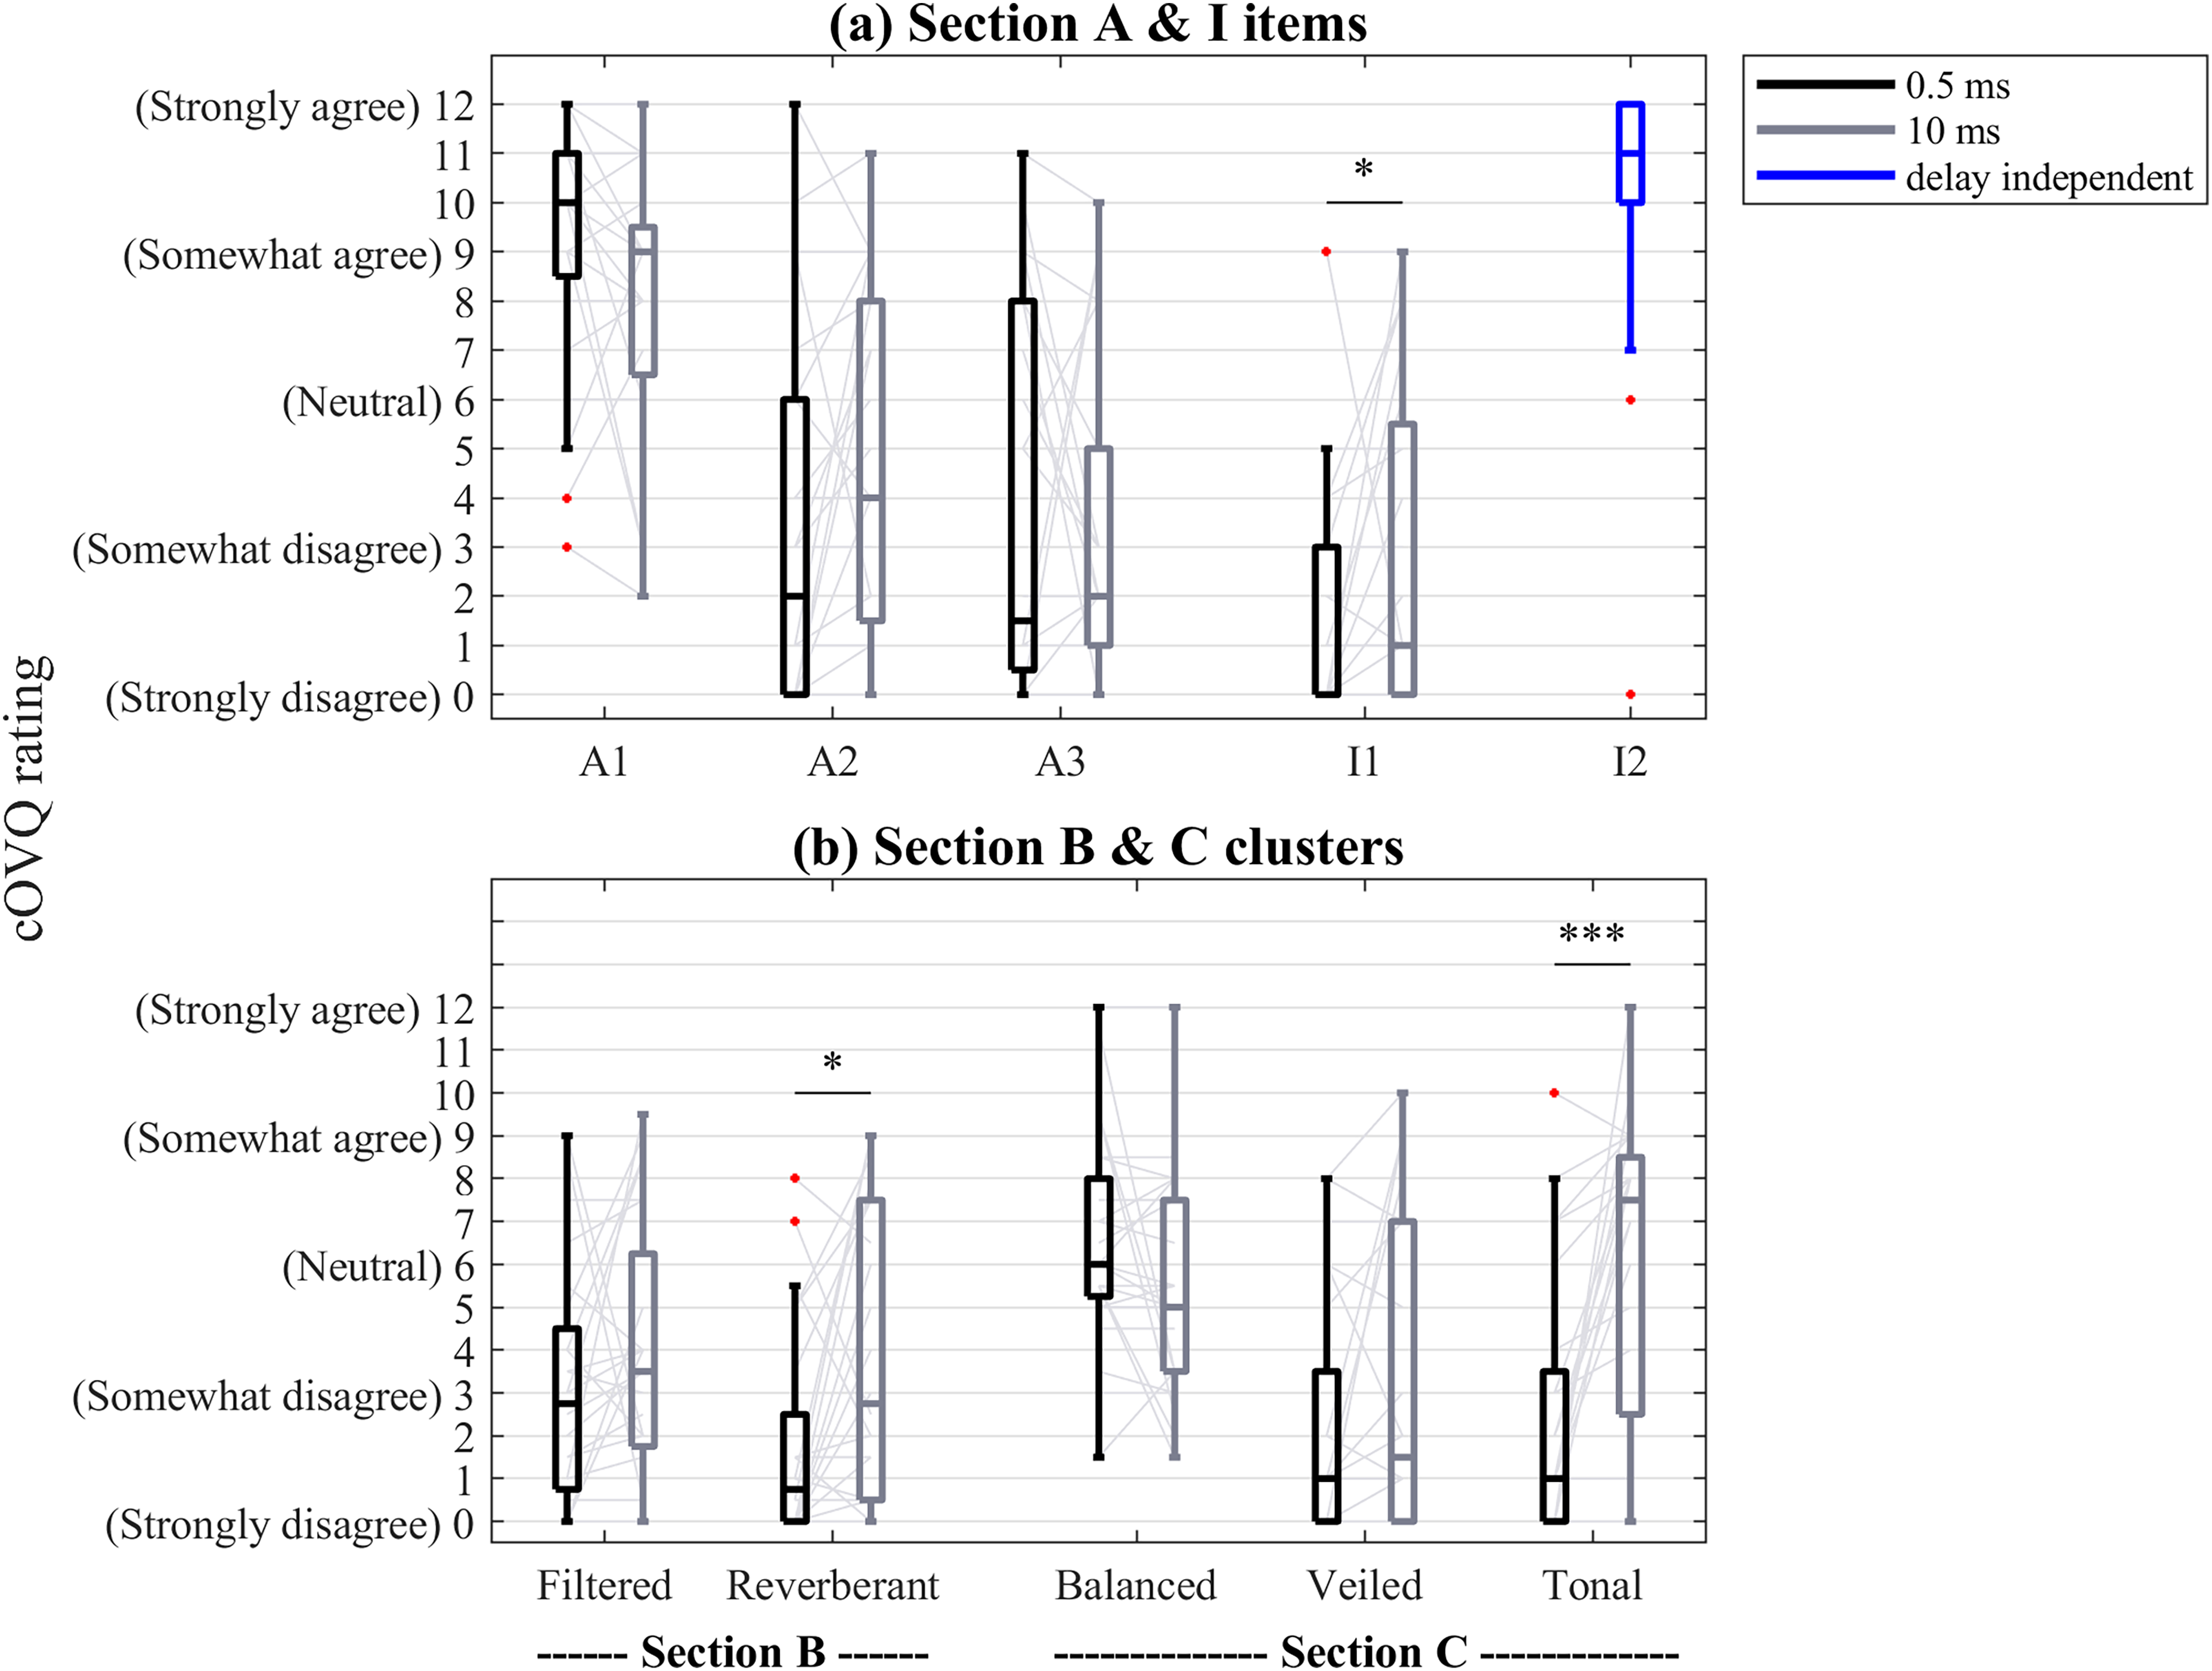
Boxplots of scores for all items and clusters in Section A, I, B, and C. Black boxplots correspond to ratings of the 0.5-ms delay. Gray boxplots correspond to ratings of the 10-ms delay. The blue boxplot shows delay-independent scores. * p < .05, *** p < .001.
Wilcoxon signed-rank tests were carried out on the scores for all Section-A and -I items. The results of the pairwise comparisons, together with the median and interquartile range (IQR) for each condition, are listed in Table 5. Before adjusting for multiple comparisons, a significant difference between the 0.5- and 10-ms delays was found for statements A1, A2, and I1. The ratings for the 0.5- and 10-ms delays did not differ significantly for statement A3. After adjusting for multiple comparisons, only the ratings for the 0.5- and 10-ms delays for statement I1 were significantly different (since this was the only Section-I item, correcting for multiple comparisons was not applicable here).
Results of Wilcoxon Signed-Rank Tests for all cOVQ Sections.

p-values are corrected for multiple comparisons using the Bonferroni–Holm correction. IQR = interquartile range; cOVQ = customized Own Voice Qualities.
Figurative Own-Voice Perception (Section B). Figure 5(b) shows boxplots of the clusters for Section B. Wilcoxon signed-rank tests were carried out on the Section-B clusters. The results are listed in Table 5, together with the median and IQR for each condition. Wilcoxon signed-rank tests showed a significant difference between the 0.5- and 10-ms delays for the Section-B cluster Reverberant. For the Section-B cluster Filtered, no significant differences were found.
Perceptual Own-Voice Clusters (Section C). Figure 5(b) shows boxplots of the perceptual own-voice clusters (Section C). For the Tonal cluster, a Wilcoxon signed-rank test revealed a significant difference between the 0.5- and 10-ms delays.
Preference for Short and Long Delay
Figure 6 shows boxplots of the preference ratings for the 0.5- and 10-ms delays. A Wilcoxon signed-rank test showed a significant difference (W = 229, p < .01) in favor of 0.5 ms (median: 10.00, IQR: 3.00) compared to 10 ms (median: 7.00, IQR: 4.50).

Boxplots of ratings for the two preference-related statements, X1 and X2. ** p < .01.
Spectral Ripple Discrimination
Figure 7 shows a scatterplot of the proportion-preferred scores for the 0.5-ms delay plotted against SRD thresholds, with a single outlier highlighted by the red circle. The regression line was fitted excluding this outlier. The figure shows a negative non-significant trend (

Scatterplot of proportion-preferred scores for the 0.5-ms delay plotted against spectral ripple SRD thresholds. The red circle shows an outlier identified in the regression analysis. The regression line was fitted without that datapoint included. SRD = Spectral ripple discrimination.
Discussion
The current study aimed to investigate the effects of processing delay on own-voice perception for individuals with HI. Specifically, it examined whether one delay would be preferred over another. Furthermore, it explored how perceptual dimensions captured by the cOVQ were influenced by 0.5 and 10 ms of delay. Thirdly, it investigated if spectral discrimination abilities can predict delay preference.
Preferred Processing Delay
To the best of authors’ knowledge, no previous study has investigated the influence of processing delay on own-voice perception using wearable devices with a processing delay as short as 0.5 ms. The results from the pairwise preference judgments indicated that the 0.5- and 5-ms delays were preferred over the 10-ms delay. The results from the two additional (preference-related) cOVQ statements supported this finding, showing a clear preference for the short over the long (0.5 versus 10 ms) processing delay. Broadly speaking, this is consistent with work by Groth and Birkmose (2004), who also observed that a delay of 10 ms was rated as more disturbing than 2 and 4 ms of delay. Bramsløw (2010), however, found no difference between 5 and 10 ms of delay. While the test methods used by Bramsløw (2010) were similar to the ones used here, differences in the HA fittings could explain the discrepant findings. Specifically, Bramsløw (2010) used the same (10-dB flat) IG for all participants, whereas in the current study individual target gains were used. In addition to own voice, Bramsløw (2010) also included other test stimuli. As a result, his participants could have assessed the perceptual effects of processing delay differently compared with the participants tested here. Finally, the results of the current study could have been affected by the compressor in the test devices, unlike in the study by Bramsløw (2010) where linear amplification was used. Nevertheless, potential effects of compression were likely small, since the participants fitted here had mild-to-moderate hearing losses.
Perceptual Dimensions of Own-Voice Perception
In earlier work, the effects of processing delay were investigated in general terms, such as overall preference (Bramsløw, 2010; Lelic et al., 2022; Súsonnudóttir et al., 2024) or disturbance caused (Goehring et al., 2018; Groth & Birkmose, 2004; Stone et al., 2008). Hence, there was a shortage of knowledge about how different own voice-related perceptual dimensions are affected by processing delay. The current study administered the cOVQ and applied agglomerative hierarchical clustering to shed some light on the relevant perceptual dimensions.
cOVQ Scores for Delays of 0.5 and 10 ms
There were significant differences between the cOVQ ratings for the 0.5- and 10-ms delays for the I1 statement, and for the Reverberant and Tonal clusters. In contrast, no differences were found for the A3 statement, nor for the Balanced and Veiled clusters. The A3 statement and the Veiled cluster relate to effects of the nasal cavity and are unlikely to be influenced by processing delay. Instead, they are likely sensitive to changes in the resonances originating in the nasal cavity. Such changes are affected by the bone-conduction path and pathologies in the involved anatomical structures rather than by air-conducted sound, which processing delay can have an effect on.
The Balanced cluster scores were positively correlated with the A1 statement scores. However, no difference was found between the ratings for the 0.5- and 10-ms delays. A possible explanation for the lack of differences could be that gain was not provided below 1 kHz. To recapitulate, it is common to minimize low-frequency gain in open fittings as vent-induced leakage effects can be substantial below 1 kHz.
Predictive Power of Spectral Discrimination Abilities
No correlation between SRD thresholds and preferences for the 0.5-ms delay was found. This contrasts with the findings of Súsonnudóttir et al. that SRD thresholds were associated with delay preference for individuals with HI. While the SRD task was identical across the two studies, there were differences in the way delay preference was assessed. Súsonnudóttir et al. (2024) used three external stimuli (rain on an umbrella, external speech, and a bouncing ping-pong ball), whereas the current study used own voice. As alluded to in the Introduction, a key difference between how external sounds and own voice are perceived is the contribution of the bone-conduction path (e.g., Pörschmann, 2000; Reinfeldt et al., 2010; Stenfelt, 2011). The bone-conduction path transmits sound at a different speed to the cochlea than the air-conduction path (Stone & Moore, 1999). It has been found to dominate perception during phoneme production in the 0.7–1.2 kHz range (Pörschmann, 2000; Reinfeldt et al., 2010). Consequently, for HA users, own-voice perception in this frequency range involves three transmission pathways: The air-conduction path, the HA path, and the bone-conduction path. This frequency range matches the range of the band-pass filtered noise used for the SRD test rather closely. It seems plausible that the SRD thresholds did not predict delay preference, since the SRD test effectively only represents the comb-filtering, which is the result of the air-conduction path and the HA path.
Furthermore, Súsonnudóttir et al.(2024) used a HA simulator, linear (NAL-NL2-based) gain across a broad frequency range, and headphone presentation, whereas the current study used ear-level devices with open domes and non-linear (Widex-based) gain above about 1 kHz. It is possible that, since the current study did not provide gain in the mid-frequency region, the SRD task lacked sensitivity to predict short delay preference. A final factor to consider is the difference in fitting rationales used for the paired-comparison and SRD tasks. Súsonnudóttir and colleagues (2024) used the NAL-NL2 rationale to calculate gains for the paired-comparison task and the SRD task. The current study used the WFR to calculate gains for the paired-comparison task and NAL-NL2 for the SRD task. It is possible that these methodological differences led to SRD scores not being related to individual differences in delay preference. Further research is necessary to disentangle the effects of stimulus type, stimulus bandwidth, and ear acoustics on the predictive power of SRD measurements with respect to delay preference.
Limitations and Outlook
The current study only tested HA fittings with open domes. As the perceptual effects of processing delay, as measured by the cOVQ, are most pronounced with open fittings, the findings of the current study are likely less applicable to more closed fittings. Another limitation is that only perceptual dimensions related to own-voice perception were assessed for 0.5 and 10 ms (but not 5 ms) of delay. Since no difference was found between the preference scores for the 0.5- and 5-ms delays, it is possible that no difference would be observed in the cOVQ scores either. Future work should investigate the perceptual dimensions related to processing delay more thoroughly. Ideally, this work should also consider the effects of prior HA experience. In addition, the current study was conducted in a laboratory setting. Future work should also address the effects of processing delay in real-life listening situations, including conversations with one or several people, passive listening, and perception of music.
Another factor that could have influenced the findings of the current study was the fitting rationale used and the gain provided. The perceptual effects of comb-filtering depend on two factors, that is, the processing delay and the level ratio between the undelayed direct sound and the delayed HA sound. The current study focused exclusively on processing delay. The influence of level differences between the direct sound and HA sound on the perception of comb-filtering was beyond the scope of the current study. Future work should consider the influence of gain (or level differences) in combination with processing delay.
Finally, the prototype HAs used here were underfitted for speech at 65-dB-SPL input level, that is, approximately 5 dB relative to WFR targets at 1 and 2 kHz and approximately 2 dB relative to NAL-NL2 targets at 1 kHz. However, since own voice was used as the test stimulus, insufficient audibility was unlikely an issue since the level of one's own voice measured at the eardrum is significantly higher than that of conversational speech from an external talker.
Conclusions
For own-voice perception, 0.5 ms of processing delay was preferred over 10 ms of processing delay. Furthermore, the 0.5-ms delay resulted in better ratings of own-voice sound quality and tonality perception relative to the 10-ms delay. Individual differences in delay preference could not be explained based on differences in spectral discrimination abilities. Overall, the current study offers some clinical guidance in terms of how to handle patient complaints related to own-voice sound quality, where HAs with short processing delay could improve aided outcomes.
Supplemental Material
sj-docx-1-tia-10.1177_23312165261435260 - Supplemental material for Own-Voice Perception with Different Processing Delays in Open-Fit Hearing Aids
Supplemental material, sj-docx-1-tia-10.1177_23312165261435260 for Own-Voice Perception with Different Processing Delays in Open-Fit Hearing Aids by Borgný Súsonnudóttir, Lars D. Mosgaard, Georg Stiefenhofer, Pamela E. Souza and Tobias Neher in Trends in Hearing
Supplemental Material
sj-docx-2-tia-10.1177_23312165261435260 - Supplemental material for Own-Voice Perception with Different Processing Delays in Open-Fit Hearing Aids
Supplemental material, sj-docx-2-tia-10.1177_23312165261435260 for Own-Voice Perception with Different Processing Delays in Open-Fit Hearing Aids by Borgný Súsonnudóttir, Lars D. Mosgaard, Georg Stiefenhofer, Pamela E. Souza and Tobias Neher in Trends in Hearing
Footnotes
Acknowledgments
The authors thank Emmely Kristensen (University of Southern Denmark) for her help with recruiting and testing participants. They also thank Anne Roslyng-Jensen (University of Southern Denmark) and Eline Borch Petersen (ORCA Labs) for their help with planning the study.
Funding
The authors disclosed receipt of the following financial support for the research, authorship, and/or publication of this article: This work was supported by the Innovationsfonden, WS Audiology A/S (grant number 0153-00223B).
Declaration of Conflicting Interests
The authors declared no potential conflicts of interest with respect to the research, authorship, and/or publication of this article.
Supplemental Material
Supplemental material for this article is available online.