
Abstract
In open-fit digital hearing aids (HAs), the processing delay influences comb-filter effects that arise from the interaction of the processed HA sound with the unprocessed direct sound. The current study investigated potential relations between preferred processing delay, spectral and temporal processing abilities, and self-reported listening habits. Ten listeners with normal hearing and 20 listeners with mild-to-moderate sensorineural hearing impairments participated. Using a HA simulator, delay preference was assessed with a paired-comparison task, three types of stimuli, and five processing delays (0, 0.5, 2, 5, and 10 ms). Spectral processing was assessed with a spectral ripple discrimination (SRD) task. Temporal processing was assessed with a gap detection task. Self-reported listening habits were assessed using a shortened version of the ‘sound preference and hearing habits’ questionnaire. A linear mixed-effects model showed a strong effect of processing delay on preference scores (p < .001, η2 = 0.30). Post-hoc comparisons revealed no differences between either the two shortest delays or the three longer delays (all p > .05) but a clear difference between the two sets of delays (p < .001). A multiple linear regression analysis showed SRD to be a significant predictor of delay preference (p < .01, η2 = 0.29), with good spectral processing abilities being associated with a preference for short processing delay. Overall, these results indicate that assessing spectral processing abilities can guide the prescription of open-fit HAs.
Introduction
According to the World Health Organization (WHO), 20% of the global population have a hearing impairment (HI), which is often mild in degree (WHO, 2021). Hearing aids (HAs) are the most common type of treatment for HI (Dillon, 2012). However, only 20%–40% of those who could benefit from a HA own one (Jorgensen & Novak, 2020; WHO, 2021). Moreover, as many as one-third of all HA owners may not use their devices (Dillon, 2012). Potential reasons for HA non-use relate to perceived value and comfort, including ineffectiveness in noise, poor sound quality, and unsuitability for certain types of HI (McCormack & Fortnum, 2013), with sound quality being one of the most influential factors (Picou, 2020).
In general, open-fit HAs, which are typically prescribed in case of rather mild HI, provide a more natural and comfortable listening experience than closed-fit devices (Winkler et al., 2016). Nevertheless, sound quality issues can arise with open-fit HAs. That is, poor sound quality can occur when the delayed, HA-processed sound interacts with the undelayed, direct sound inside the ear canal, causing ripples and notches in the frequency spectrum—a comb filter (e.g., Bramsløw, 2010; Stone et al., 2008). An increase in the delay of the HA-processed sound leads to more closely spaced ripples and notches, while a shorter delay leads to more widely spaced comb-filter patterns.
Typically, modern HAs are designed to have processing delays up to 10 ms (Goehring et al., 2018). Up to this limit, spectral (as opposed to temporal) effects related to sound coloration dominate the perception of processing delay (Bramsløw, 2010). Recently, Stiefenhofer (2022) investigated sound coloration effects arising from different processing delays in individuals with normal hearing (NH) and HI. Results showed that individuals with (near-)normal hearing thresholds below 1.5 kHz could discriminate sound coloration due to delays of 1 ms or shorter, whereas individuals with elevated low-frequency hearing thresholds showed poorer discrimination abilities.
For long (>15 ms) delays, temporal effects, such as the perception of echoes, dominate the perception of processing delay (e.g., Bramsløw, 2010; Stone & Moore, 1999). In a review of the influence of different sounds on echo thresholds, Litovsky et al. (1999) found that brief sounds (e.g., clicks or brief noise bursts) result in low thresholds (5–10 ms), while speech results in noticeably higher thresholds (30–50 ms).
Using either computer simulations or real HAs, several studies have investigated the effects of processing delay with vented or open fittings. Agnew and Thornton (2000) measured detection thresholds associated with noticeable and objectionable delays for NH listeners with own voice as test stimulus. Their results showed that delays of 3–5 ms were noticeable, while delays longer than 10 ms were deemed objectionable.
Groth and Søndergaard (2004) investigated the effects of processing delay (2, 4, and 10 ms) with three types of stimuli: own voice, running speech, and music. For the assessments, a 7-point rating scale of perceived disturbance was used. NH listeners rated 2 and 4 ms of delay as less disturbing than 10 ms. Listeners with mild HI gave comparable ratings to the three tested delays, an exception being the own-voice condition for which 10 ms was rated as more disturbing than 2 and 4 ms.
Using a computer simulation, Stone and colleagues (2008) investigated perceived disturbance associated with several frequency-independent delays and gain settings in NH listeners. Delays of 1, 3, 7, and 15 ms and gains ranging from 0 to 20 dB were tested. A speech stimulus was used for all measurements. As the delay increased, so did the disturbance ratings. More gain led to less disturbance as the comb-filter effects became less pronounced.
The three studies summarized above all employed rating scales for assessing the perceptual effects of processing delay. Focusing on delay preference, Bramsløw (2010) asked listeners with NH and mild HI to perform pairwise comparisons and to select the sound they liked best. Four types of stimuli (waves on a beach, rain, speech, and own voice) and three delays (5, 7, and 10 ms) were included. Overall, no differences in preference were observed between the three delays, even though differences were noticed by most participants when asked during a training session.
Also using a paired-comparison task, Lelic et al. (2022) investigated preferred processing delay for individuals with NH and HI. A HA simulator was used to implement delays of 0.5, 2, 5, and 10 ms. The NH group showed a clear preference for the shortest delay. For the HI group as a whole, no effects of processing delay were found. However, individuals with (near-)normal hearing thresholds below 2 kHz showed a preference pattern similar to that of the NH group. That is, they preferred 0.5 ms over 2, 5, and 10 ms of delay. Moreover, a negative correlation was found between pure-tone average hearing loss calculated across 0.5, 1, and 2 kHz (‘PTA3’) and preference for the 0.5-ms delay (r = −.54, p = .01).
To summarize, individuals with NH prefer short processing delays, whereas individuals with HI are less disturbed by longer delays. However, individuals with HI but good low-frequency hearing thresholds seem to prefer short processing delays. In general, previous research has focused on determining the upper limit for when processing delay-related effects become disturbing rather than on the lower limit for when processing delay-related effects become imperceivable and thus favorable.
The present study investigated individual factors that may be related to preferred processing delay in open-fit HAs. More specifically, its purpose was to investigate if basic spectral and temporal processing abilities as well as self-reported listening habits can predict individual differences in preferred delay. As mentioned above, both spectral and temporal effects can play a role for the perception of processing delay, with spectral effects (comb-filtering) dominating in the case of shorter delays and temporal effects (echo perception) dominating in the case of longer delays. While Lelic et al. (2022) found that delay preference could be partially explained by PTA3, a substantial amount of the variance remained unexplained (see above). Here, spectral and temporal processing abilities were assessed to test if they were more effective at predicting delay preference. Furthermore, because preference is a subjective percept that may be governed by specific listening habits, a self-report measure was included to assess such habits as well.
To investigate delay preference, a HA simulator, five processing delays (0, 0.5, 2, 5, and 10 ms), three types of stimuli (rain on umbrella, bouncing ping-pong ball, and male speech), and two participant groups (NH and HI) were used. Spectral processing abilities were assessed using a spectral ripple discrimination task (SRD) to possibly link the ability to discriminate between different comb-filter patterns to delay preference. Temporal processing abilities were assessed using a gap detection task (GDT) to possibly link the ability to detect short time gaps to delay preference. Self-reported listening habits were assessed using a shortened version of an established questionnaire for assessing sound preference and listening habits.
The following hypotheses were tested:
Participants with good spectral processing abilities will show a preference for short processing delays in case of more continuous stimuli (rain on umbrella, speech); Participants with good temporal processing abilities will show a preference for short processing delays in case of more transient stimuli (bouncing ping-pong ball, certain speech consonants and onsets); Participants who self-report finding sound quality important will prefer short processing delays.
Methods
The current study was evaluated by the Regional Committees on Health Research Ethics for Southern Denmark (case no. 20212000-06) and the Regional Committees on Health Research Ethics for the Capital Region of Denmark (case no. H-18056647). In both cases, full ethical approval was deemed unnecessary. A waiver was therefore granted, as is common practice in such cases. The participants received written and oral instructions about the aims of the current study and then signed an informed consent form. For their participation, they received a monetary reimbursement.
Participants
Thirty native Danish speakers participated. Most of them were recruited from the Odense municipality area, mainly by word of mouth and from the patient population at the Department of Audiology, Odense University Hospital, Odense, Denmark. Two participants were recruited from the participant database at WS Audiology, Lynge, Denmark. Audiometric testing was conducted if no audiogram was available or if the newest audiogram on record was older than six months.
The sample size was chosen based on similar studies (Bramsløw, 2010; Groth & Søndergaard, 2004; Lelic et al., 2022; Stone et al., 2008) rather than on a power analysis, as estimates of measurement uncertainty were unavailable for the measures and test conditions used here.
HI Group
Twenty individuals with sensorineural HI (10 females) aged 51–76 years (M = 65 years) participated. Fourteen of them were HA users. All had a mild-to-moderate HI, with a pure-tone average hearing loss across 0.5, 1, 2, and 4 kHz (‘PTA4’) in the range of 19–52 dB HL (M = 34 dB HL). There was no statistical difference between mean right- and left-ear PTA4s (p = .83). Mean audiometric thresholds are displayed in Figure 1.
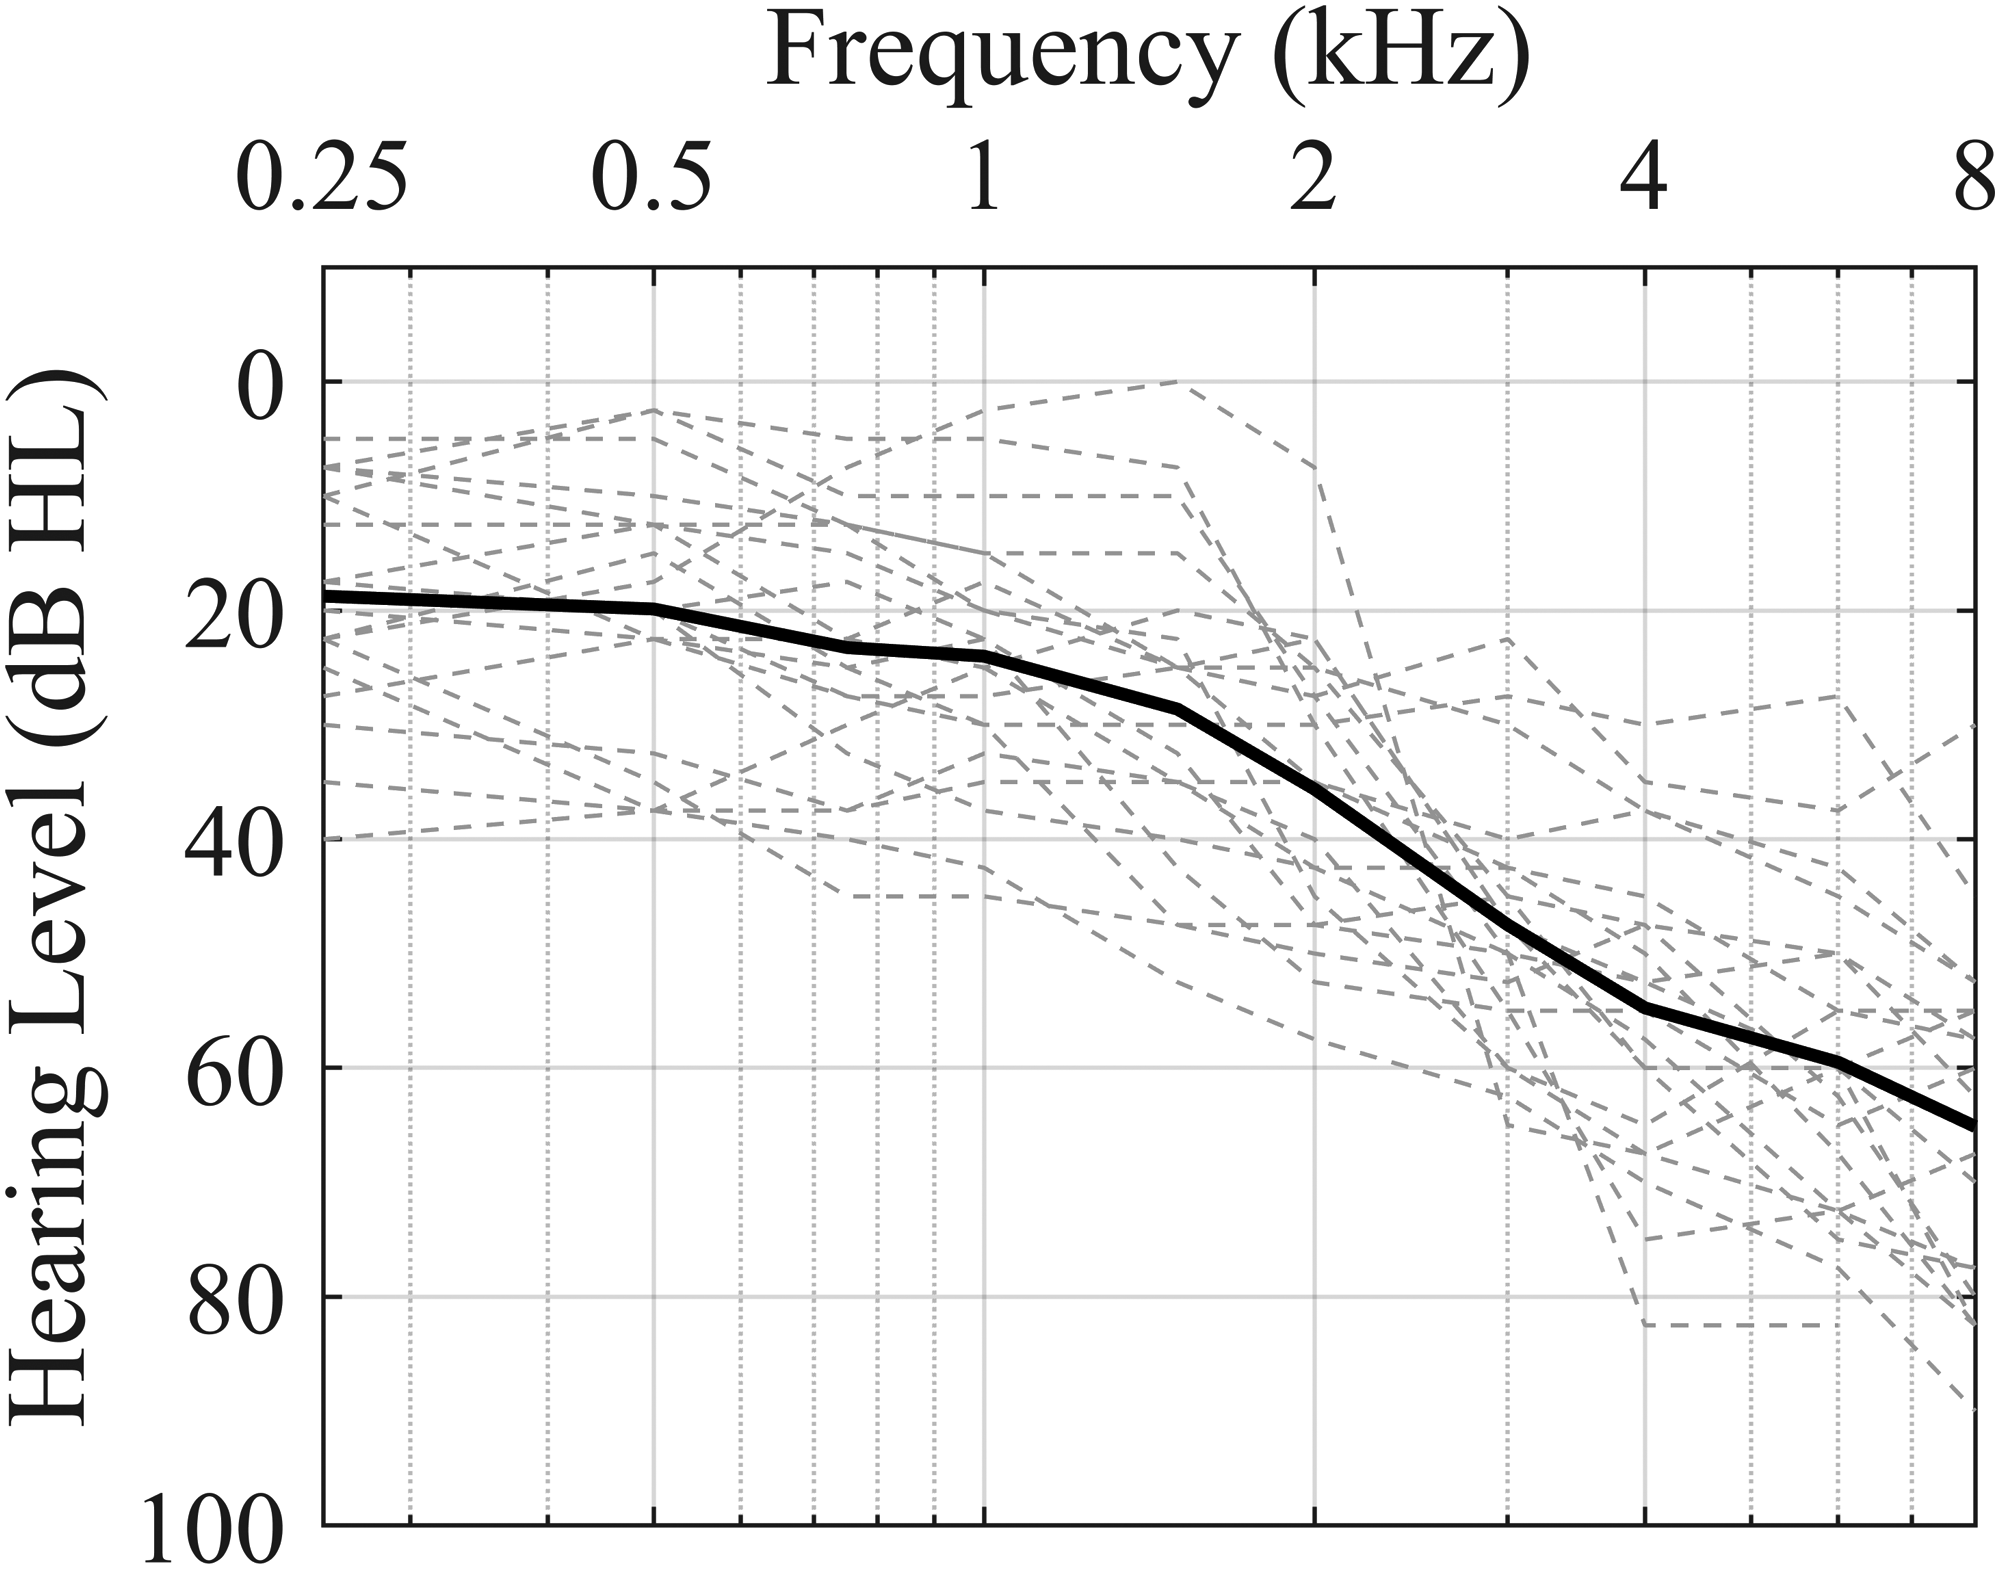
Individual (dashed lines) and mean (thick line) air-conduction thresholds for the HI participants.
NH Group
Ten participants with NH (four females) aged 26–55 years (M = 42 years) served as reference group. Except for a single pure-tone hearing threshold of 30 dB HL at 6 kHz, all participants had thresholds ≤20 dB HL at the standard audiometric frequencies between 0.25 and 8 kHz.
Preference Judgements
A paired-comparison task was used to investigate preference for processing delay (e.g., Bramsløw, 2010; Kowalewski et al. 2020; Lelic et al., 2022; Neher, 2014). On a given trial, the participants were presented with two stimuli and asked to select the one they preferred in terms of perceived sound quality. The paired-comparison task was performed using the SenseLabOnlineTM software developed by FORCE Technology. When switching between a given pair of stimuli, crossfading with a 0.4-s duration was applied.
Stimuli
Three stimuli were used:
Rain on an umbrella (chosen for its broadband frequency spectrum and relatively continuous temporal characteristics); Male speech (chosen for its daily-life relevance); Bouncing ping-pong ball (chosen for its transient temporal characteristics).
The stimuli had a length of 30 s each and were played back in a loop until the participants either indicated their preference or paused playback.
Signal Processing
A HA simulator (Stiefenhofer, 2022) with a sampling rate of 33.1 kHz was used to generate the stimuli for the paired comparisons. This simulator is based on impulse response (IR) measurements made with real open-fit HAs and can accurately simulate real-ear aided gain on an acoustic mannikin. It consists of two signal paths, which are simulated using the IRs of the HA-processed sound (
Each of the three stimuli was filtered separately with
Five delays were tested: 0, 0.5, 2, 5, and 10 ms. The stimuli for the four latter delays were generated with the simulator as used by Stiefenhofer (2022) and Lelic et al. (2022). The tested delays were almost constant across frequency (standard deviation of <0.1 ms measured in one-third octave bands between 500 Hz and 8 kHz).
To generate stimuli with the 0-ms delay, the simulator was extended. A 512-tap minimum-phase FIR filter (
All stimuli were simulated to come from the frontal direction. Prior to presenting them binaurally via free-field equalized Sennheiser HDA200 headphones, they were filtered with a 128-tap minimum-phase FIR filter with the inverse frequency response of
Hearing Loss Compensation and Presentation Level
To compensate for the elevated hearing thresholds of the HI group, individual linear amplification was provided up to 8 kHz. Linear amplification was chosen, as the HA simulator did not allow for amplitude compression to be applied. Ear-specific IGs corresponding to the NAL-NL2 rationale (Keidser et al., 2011) for a 65-dB-SPL speech input signal were used for that purpose (Figure 2). For the NH group, IGs calculated for the N2 standard audiogram of Bisgaard et al. (2010) were applied. The N2 standard audiogram was chosen since it was also used by Lelic and colleagues (2022) to test NH participants. To avoid uncomfortable presentation levels for the NH group, the overall presentation level was lowered to 65 dB SPL on the output side of the HA simulator.

Insertion gains for left (white) and right (grey) ears of the HI group. The black solid line shows insertion gains calculated for the N2 standard audiogram used for the NH participants (prior to adjusting the overall output level to 65 dB SPL).
Procedure
For each of the three stimuli, pairwise comparisons of the five processing delays were conducted, resulting in 30 comparisons. Each pairwise combination was presented three times, resulting in 90 comparisons. The compared stimuli differed only in processing delay, and the listeners were instructed to select the stimulus with the best overall sound quality. No definition of sound quality was provided to avoid biasing the participants in any way. They were instructed to randomly select one stimulus if they could not hear a difference or did not have a preference. The listeners could listen to the stimuli as long as necessary. The order of the delay conditions and stimuli was randomized across participants.
Psychoacoustic Measurements
Spectral Ripple Discrimination (SRD)
To assess the listeners’ spectral processing abilities, a spectral ripple discrimination (SRD) task was employed (Neher et al., 2011; Supin, 1994). This task introduces spectral ripples with a certain density and depth into a noise signal. In the reference signal, the created ripples are constant throughout the duration of the signal. In the target signal, the ripples are inverted (or flipped) at a given rate, as illustrated in Figure 3.

Example of an SRD target stimulus with a ripple spacing of 300 Hz. The stimulus alternates between the black solid and grey dashed lines every 0.25 s.
Stimulus Generation
On a given trial, white noise was generated in Matlab version R2018b (The MathWorks Inc., Natick, Massachusetts) using the randn() function with a sampling rate of 48 kHz and a duration of 1.5 s. For the generation of the reference signal, the noise was delayed by Δt and then added to an undelayed version of itself, thereby creating a comb-filter pattern with two adjacent ripples or notches spaced apart by 1/Δt Hz. The target signal was created in the same manner, except that prior to adding the delayed noise to the undelayed noise, the delayed noise was multiplied by a step function that alternated between +1 and −1 every 0.25 s. This resulted in the target signal alternating between the reference signal and its inverted version at a 4-Hz rate (i.e., every 0.25 s). The reference and the target signals were bandpass-filtered with a 256-tap FIR filter implemented using the fir2() function in Matlab with a lower cut-off frequency of approx. 400 Hz and a higher cut-off frequency of approximately 1300 Hz (for further details, see the Supplementary materials). This frequency range was chosen because comb-filtering generally is most perceivable in that range (Stiefenhofer, 2022). The high-frequency slope (∼36 dB/octave) was steeper than the low-frequency slope (∼12 dB/octave), effectively limiting the contribution of spectral ripples at higher frequencies. Finally, the reference and target signals were processed with 5-ms Hanning window ramps. Stimulus presentation was via free-field equalized Sennheiser HDA200 headphones.
Procedure
SRD was assessed using a three-alternative forced choice (3-AFC) procedure with a 1-up 2-down tracking rule, converging at the 70.7%-point of the psychometric function (Levitt, 1971). The interstimulus duration was 250 ms, while the pre- and post-stimulus duration was 100 ms. The tracking variable was the ripple spacing, realized by manipulating Δt. Starting values of 150 Hz (Δt = 6.7 ms) for the NH group and 225 Hz (Δt = 4.4 ms) for the HI group were used. The initial step size was set to 50 Hz (Δt = 20 ms), which was halved upon every lower reversal until the minimum step size (12.5 Hz; Δt = 80 ms) was reached. The smallest possible ripple spacing was 10 Hz (Δt = 100 ms). Measurements continued until six reversals with the minimum step size had occurred, and thresholds were calculated as the median of the ripple spacing at those reversals (Hansen, 2019). Three SRD thresholds were measured per ear. Additional measurements were performed if the standard error (SE) across repetitions was larger than twice the minimum step size (25 Hz; Δt = 40 ms). For the statistical analyses, the average of all individual measurements with a SE <25 Hz was used. A nominal presentation level of 65 dB SPL was used. For the HI participants, ear-specific NAL-NL2 IGs at 65-dB-SPL input level were applied.
The listeners were instructed to identify the interval that was different from the other two. A graphical user interface (GUI) was used for that purpose, with the stimuli visually highlighted during each trial. Visual feedback regarding response accuracy was provided.
Prior to the actual measurements, training was provided. The training was a shorter version of the actual measurements, with fewer reversals and a larger minimum step size. The listeners completed two training runs on a randomly selected ear and one training run on their other ear.
Gap Detection Task (GDT)
To assess temporal processing abilities, a temporal gap detection task (GDT) (e.g., Eddins et al., 1992; Moore & Glasberg, 1988) was employed. In this task, a silent gap is introduced into a continuous noise signal, which the listener is asked to detect.
Stimulus Generation
On a given trial, white noise was generated in Matlab using the randn() function with a sampling rate of 48 kHz and a duration of 500 ms. For the generation of the reference signal, the noise was ramped with 2-ms Hanning window flanks and then bandpass-filtered with the same FIR filter as used for the SRD stimuli. The target signal was generated based on the same noise signal as used for the reference signal. A silent gap was inserted into the middle of that signal (i.e., centered at 250 ms), after which the target signal was bandpass-filtered. Lastly, the reference and target signals were equalized in terms of their root-mean-square levels. Stimulus presentation was via free-field equalized Sennheiser HDA200 headphones.
Procedure
Again, a 3-AFC procedure with a 1-up 2-down tracking rule was used. The interstimulus duration was 500 ms, the pre-stimulus duration was 500 ms, and the post-stimulus duration was 300 ms. The initial gap size was 20 ms for the NH group and 50 ms for the HI group. For the NH group, the initial step size was 10 ms, while for the HI group 20 ms were used. For both groups, the minimum step size was 1 ms. The measurement phase lasted until six reversals had occurred, and the threshold was calculated as the median of the gap size at those reversals. Again, the nominal presentation level was 65 dB SPL, with ear-specific NAL-NL2 IGs for a 65-dB-SPL input level added for the HI group. Three GDT thresholds were measured per participant. Additional measurements were performed if the SE across repetitions exceeded 2 ms. The same GUI and training procedure used for the SRD measurements were employed.
Self-Reported Listening Habits
Sound Preference and Hearing Habits Questionnaire
The ‘sound preference and hearing habits’ questionnaire (SP-HHQ) was developed by Meis et al. (2018). To the authors’ knowledge, the SP-HHQ is the only available questionnaire assessing the importance of sound quality independent of HA usage (unlike, e.g., the Speech, Spatial, and Qualities of Hearing Scale; Gatehouse & Noble, 2004). This was important for the current study, as not all participants used HAs on a daily basis.
The SP-HHQ was developed in German and consists of 23 items, which can be reduced into seven underlying factors: (1) Annoyance/distraction by background noise, (2) Importance of sound quality, (3) Noise sensitivity, (4) Avoidance of unpredictable sounds, (5) Openness towards loud/new sounds, (6) Preference for warm sounds, and (7) Details of environmental sounds/music. For all items, a 5-point rating scale ranging from “does not apply at all” to “applies fully” is used. In their article, Meis et al. (2018) highlighted three factors as potential predictors for sound quality assessments: factor 2 (F2; importance of sound quality), factor 3 (F3; noise sensitivity), and factor 6 (F6; preference for warm sounds). For this reason, these factors and their corresponding items were used in the present study, requiring shortening of the questionnaire.
Translation
The questionnaire items belonging to factors F2, F3, and F6 were translated into Danish. The translation was performed independently by three native German speakers (including two of the authors) who were all proficient in Danish. Following the translation, the translators met to discuss the three individual translations and agreed on a final Danish translation. The translations were verified by three native Danish speakers (including the first author). An English translation, provided by Meis et al. (2018), is listed in Table 1. The original German version and the translated Danish version are provided in the Appendix.
English Translations of Included SP-HHQ Items According to Meis et al. (2018).

General Procedure
The participants attended two visits. The first visit included a general introduction to the study, written informed consent, audiometric testing (if applicable), one of the psychoacoustic measures (i.e., SRD or GDT), and completion of the shortened questionnaire. On average, the first visit lasted for 1.5 h. The second visit included the other psychoacoustic measure (i.e., GDT or SRD) and the pairwise preference judgments. On average, the second visit lasted for 2.5 h. The order of the psychoacoustic measures was balanced across the participants. The preference judgments were performed at the second visit, as the audiometric thresholds of the participants were needed for stimulus generation with the HA simulator.
Statistical Analyses
The statistical analyses involved a two-step process: (1) variable preparation and (2) multiple linear regression analyses. For all statistical tests, a significance level of 0.05 was used with Bonferroni correction for multiple comparisons, where necessary.
Step 1: Variable Preparation
The purpose of the variable preparation was three-fold: (1) to convert the preference judgments into proportion-preferred scores, (2) to identify independent variables from the paired-comparison task that had a significant effect on the preference scores, and (3) to reduce the number of variables from the psychoacoustic and self-report measures.
Conversion into Proportion-Preferred Scores
For each processing delay and stimulus type, the occurrence of one delay being favored over another was counted. The number of wins was converted into a score ranging from 0 to 1 by dividing it by the total number of comparisons (e.g., Neher, 2014). This score can be interpreted as the proportion with which one delay is preferred over all other delays. If, for example, a given delay is consistently preferred over all other delays, this will yield a maximum score of 0.4. In an ideal winner-loser matrix, option A is preferred over all remaining options (i.e., options B, C, D, and E). The sum of A winning over B, C, D, and E is 4. To calculate the proportion of how many times option A was the winner, the sum is divided by the total number of comparisons (i.e., 10), yielding a maximum score of 0.4. Across delays, these scores add up to 1.
Identification of Significant Predictors
The obtained preferences scores were analyzed using a linear mixed-effects (LME) model. Its purpose was to test which independent variables had a significant effect on the preference scores. The independent variables (i.e., fixed effects) were as follows: (1) stimulus type, (2) processing delay, and (3) hearing status (NH versus HI). The independent variables were included as fixed effects, while the participants were included as random effects. The independent variables were entered as main effects, and interaction terms between all variables were also included. The LME analysis was conducted in R using the lmer() function from the lmerTest package (Kuznetsova et al., 2017). The tested model was simplified using the step() function, which removes effects from the model that exceed the significance level (0.05). Post-hoc pairwise comparisons were performed using the emmeans() function from the emmeans package (Lenth et al., 2023). Normal distribution of the residuals was confirmed with a QQ-plot and histogram.
Reduction of Variables from Psychoacoustic and Self-Report Measures
The SRD and GDT measurements were performed monaurally. To reduce the number of variables in the dataset, paired t-tests were performed to assess if the left- and right-ear thresholds were comparable and could therefore be averaged before inclusion in the analyses.
The self-reported listening habit data were processed in two steps:
Factor calculation, as described by Meis et al. (2018). The shortened SP-HHQ consisted of seven items, which were reduced into three factor scores (F2, F3, and F6). F2 was the mean of the scores for items 1 and 2, F3 the mean of the scores for items 3, 4, and 5, and F6 the mean of the scores for items 6 and 7. Principal component analysis (PCA), as done by Wu et al. (2022), to extract the most dominant source of variance. Principal component 1 (PC1) was extracted and chosen as the variable representing most of the variance captured by F2, F3, and F6.
Step 2: Multiple Linear Regression
To investigate the effects of spectral and temporal processing abilities and self-reported listening habits on preferred processing delay, a multiple linear regression analysis was performed. The preference scores were treated as dependent variable and SRD, GDT, and PC1 as independent variables. Because of the relatively small sample size (N = 29), no interaction terms were included to avoid overfitting (Hair et al., 2019).
The first regression model (based on the data from both participant groups) was followed up with another model based on the data from the HI group only (N = 19). The purpose of this second model was to check if the results from the first model would change when the data from the NH group are removed. In the second model, only SRD and GDT were included as predictors to avoid overfitting.
Finally, to follow up on the correlation found by Lelic et al. (2022) between PTA3 (i.e., the frequency region where comb-filtering typically is most pronounced) and preference for short processing delay (see above), a third model (N = 19) was tested with SRD and PTA3 as independent variables.
The regression analyses were performed in R using the core Stats package with the lm() function and the drop1() function for model simplification (R Core Team, 2010). The drop() function is used in linear regression models to identify non-significant terms. These terms are removed manually step-by-step until the model only contains significant terms. Normal distribution of the residuals was confirmed based on QQ-plots and histograms. Absence of multicollinearity was verified based on inflation factor analysis.
Results
Preference Scores
Figure 4 shows the results from the preference judgments, converted into proportion-preferred scores.

Proportion-preferred scores as a function of processing delay for rain (left panel), speech (middle panel), and ping-pong ball (right panel). Error bars show ±1 standard error. Data from the NH group are shown with filled diamonds. Data from the HI group are shown with unfilled squares.
The LME analysis showed a significant effect of processing delay on the preference scores, F(4, 150) = 15.3, p < .001, η2 = 0.30, corresponding to a large effect size. The interaction between stimulus type, hearing status, and processing delay was not significant (p = .058).
Based on the results from the LME analysis, the preference scores were collapsed across participant group and stimulus type. The results of the corresponding post-hoc comparisons are shown in Figure 5. There were no differences between the two shortest delays (0 and 0.5 ms; hereafter referred to as ‘Short Delay’), nor between the three longer delays (2, 5, and 10 ms; hereafter referred to as ‘Longer Delay’). However, a highly significant difference between Short Delay and Longer Delay was found.
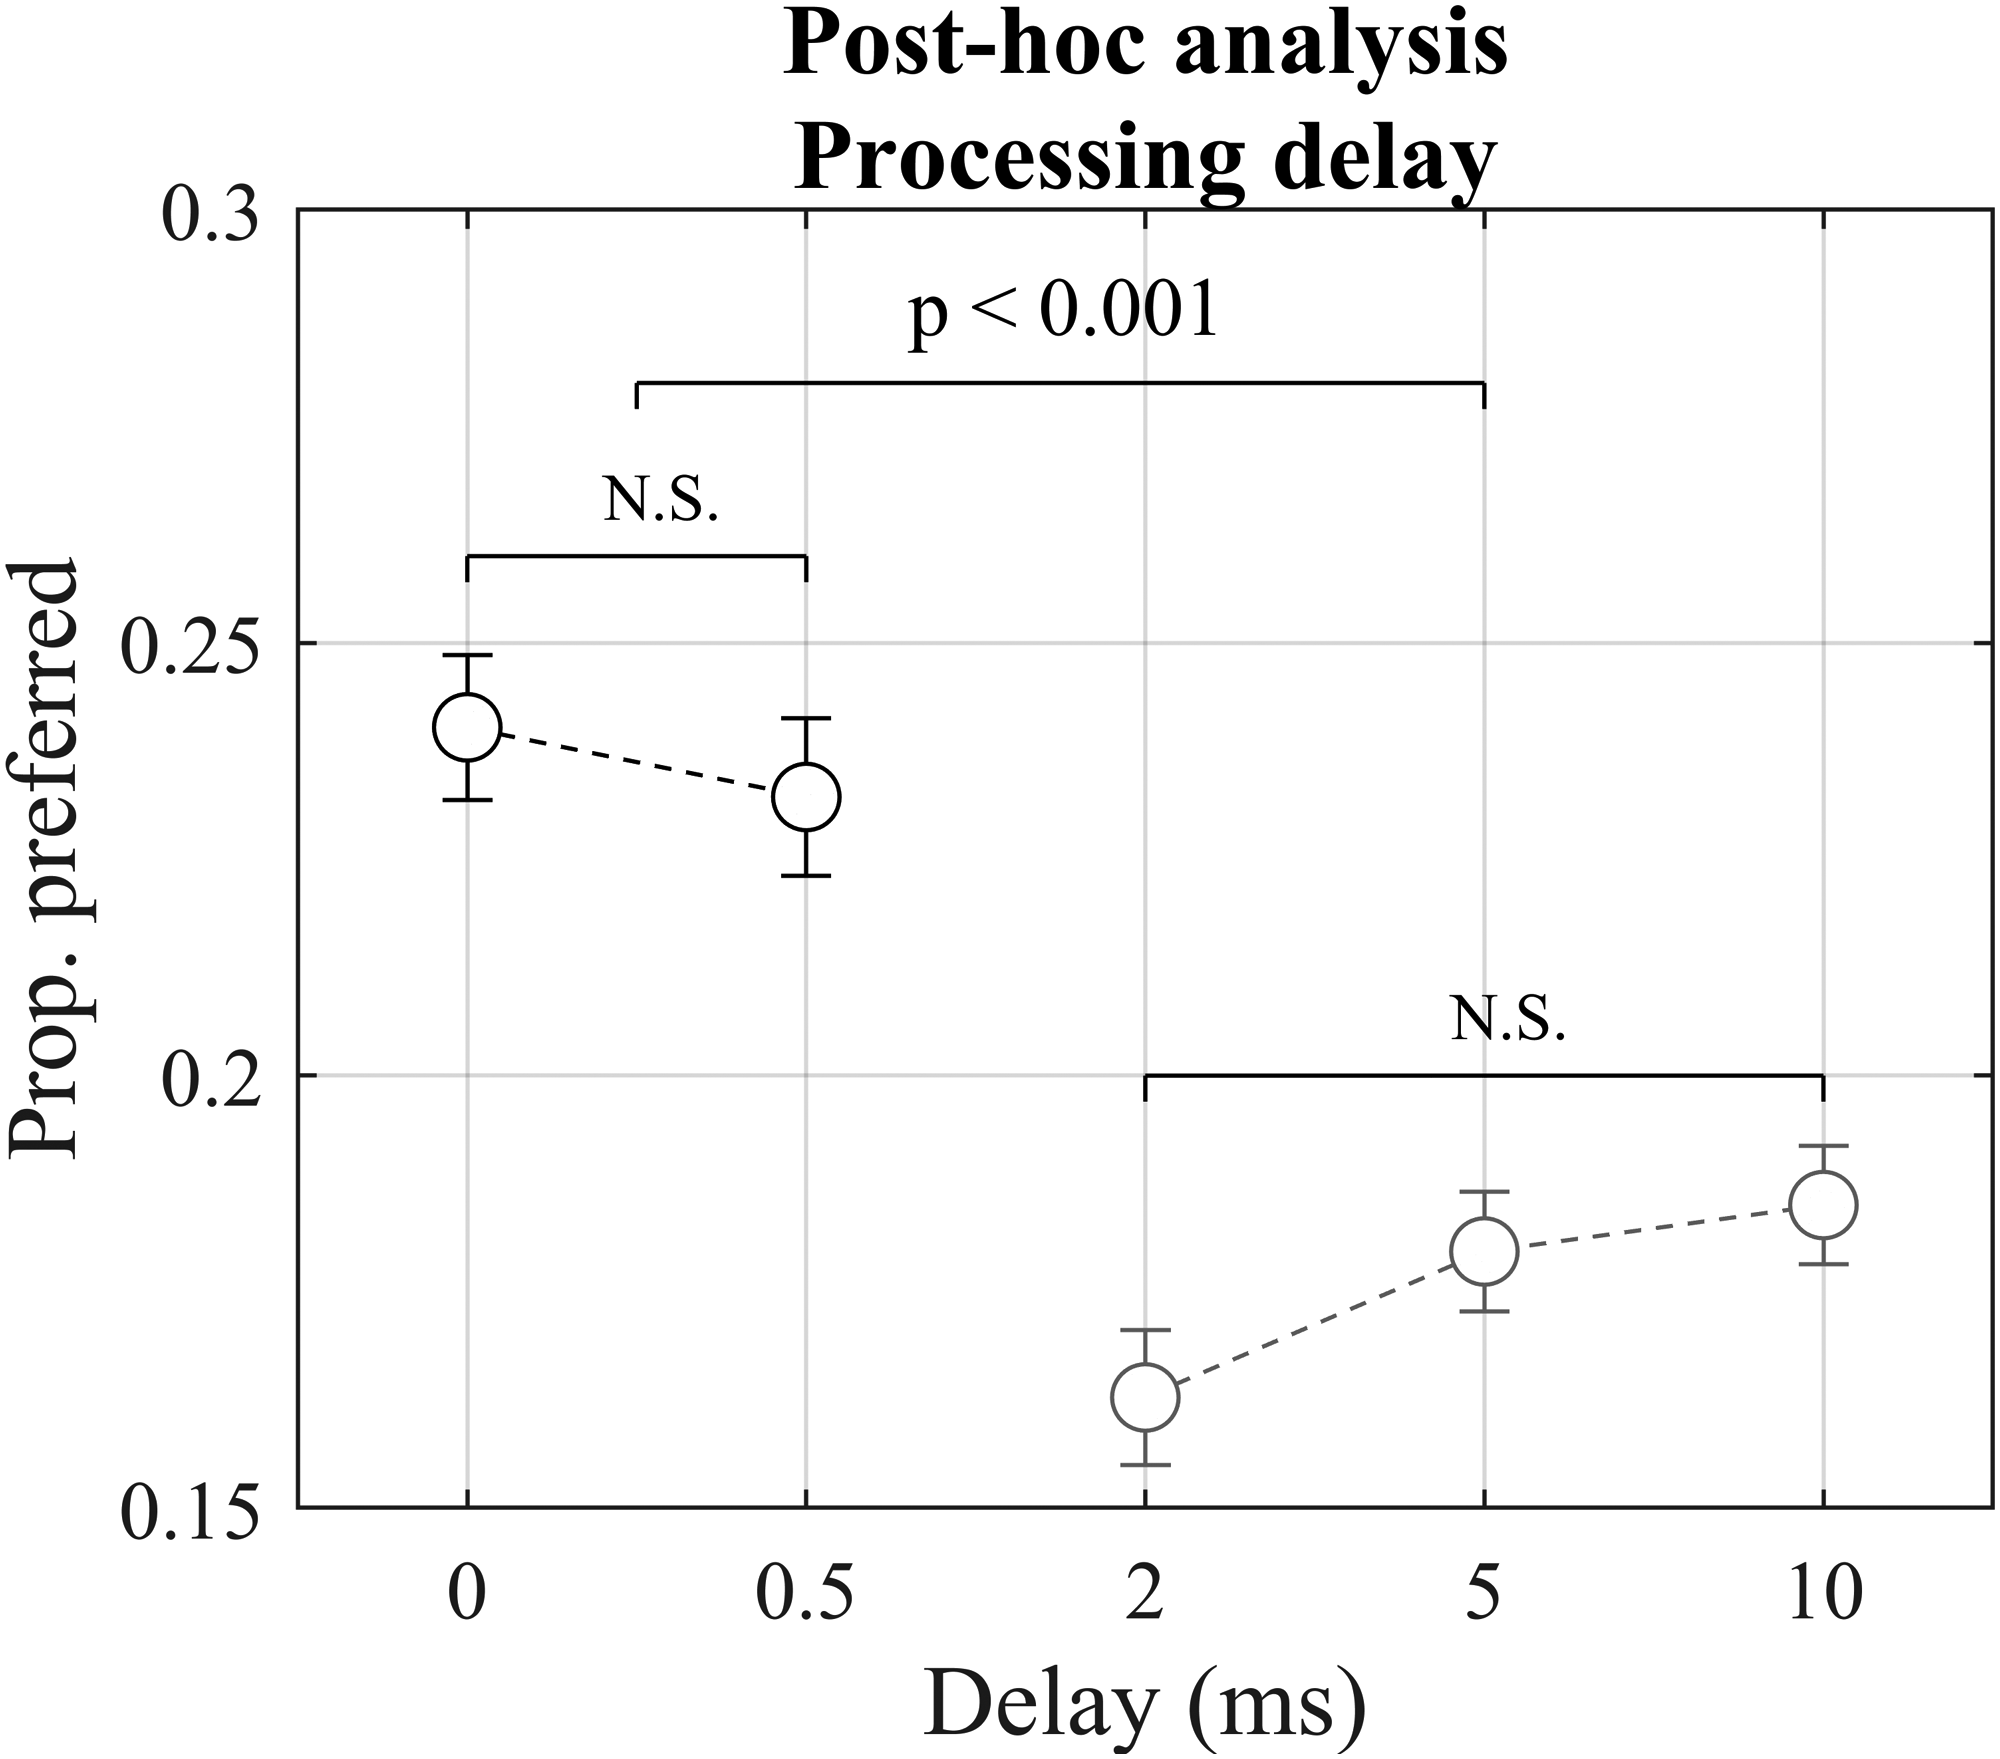
Results from post-hoc analysis conducted on the proportion-preferred scores. Data are collapsed across participant group and stimulus type. N.S. = Not significant.
Following these results, proportion-preferred scores were calculated for Short Delay (0 and 0.5 ms combined) and Longer Delay (2, 5, and 10 ms combined). The total number of comparisons per stimulus and repetition was therefore reduced to six (instead of the original 10). This showed that Short Delay was preferred 62% of the time, whereas Longer Delay was preferred 38% of the time.
Psychoacoustic Measures
SRD
The SRD thresholds of the NH participants ranged from 43.3 to 75 Hz on the left ear and from 41.3 to 66.7 Hz on the right ear. A paired t-test showed no statistical difference between right-ear thresholds (M = 54.4 Hz, SD = 9.4 Hz) and left-ear thresholds (M = 58.5 Hz, SD = 11.4 Hz) [t(9) = 2.0, p = .07].
The SRD thresholds of the HI participants ranged from 51.3 to 160.4 Hz on the left ear and from 56.3 to 256.3 Hz on the right ear. There was one participant who showed a substantially higher threshold for one ear (256.3 Hz) compared to all other participants. According to Supin (1994), there should be at least four spectral ripples per stimulus to avoid confounding effects of amplitude-based cues in the target stimulus. Given an effective stimulus bandwidth of ∼900 Hz in the present study (Figure 3), this corresponds to a maximum ripple spacing of approximately 225 Hz. Based on these grounds, the participant with the poor right-ear SRD threshold was excluded from all further analyses. A paired t-test conducted on the remaining data showed no difference between right-ear thresholds (M = 86.3 Hz, SD = 26.0 Hz) and left-ear thresholds (M = 85.3 Hz, SD = 23.8 Hz) [t(18) = −0.2, p = .85]. The right- and left-ear SRD thresholds were therefore averaged (Figure 6a). No correlations between SRD, PTA4, and age were found (Table 2).
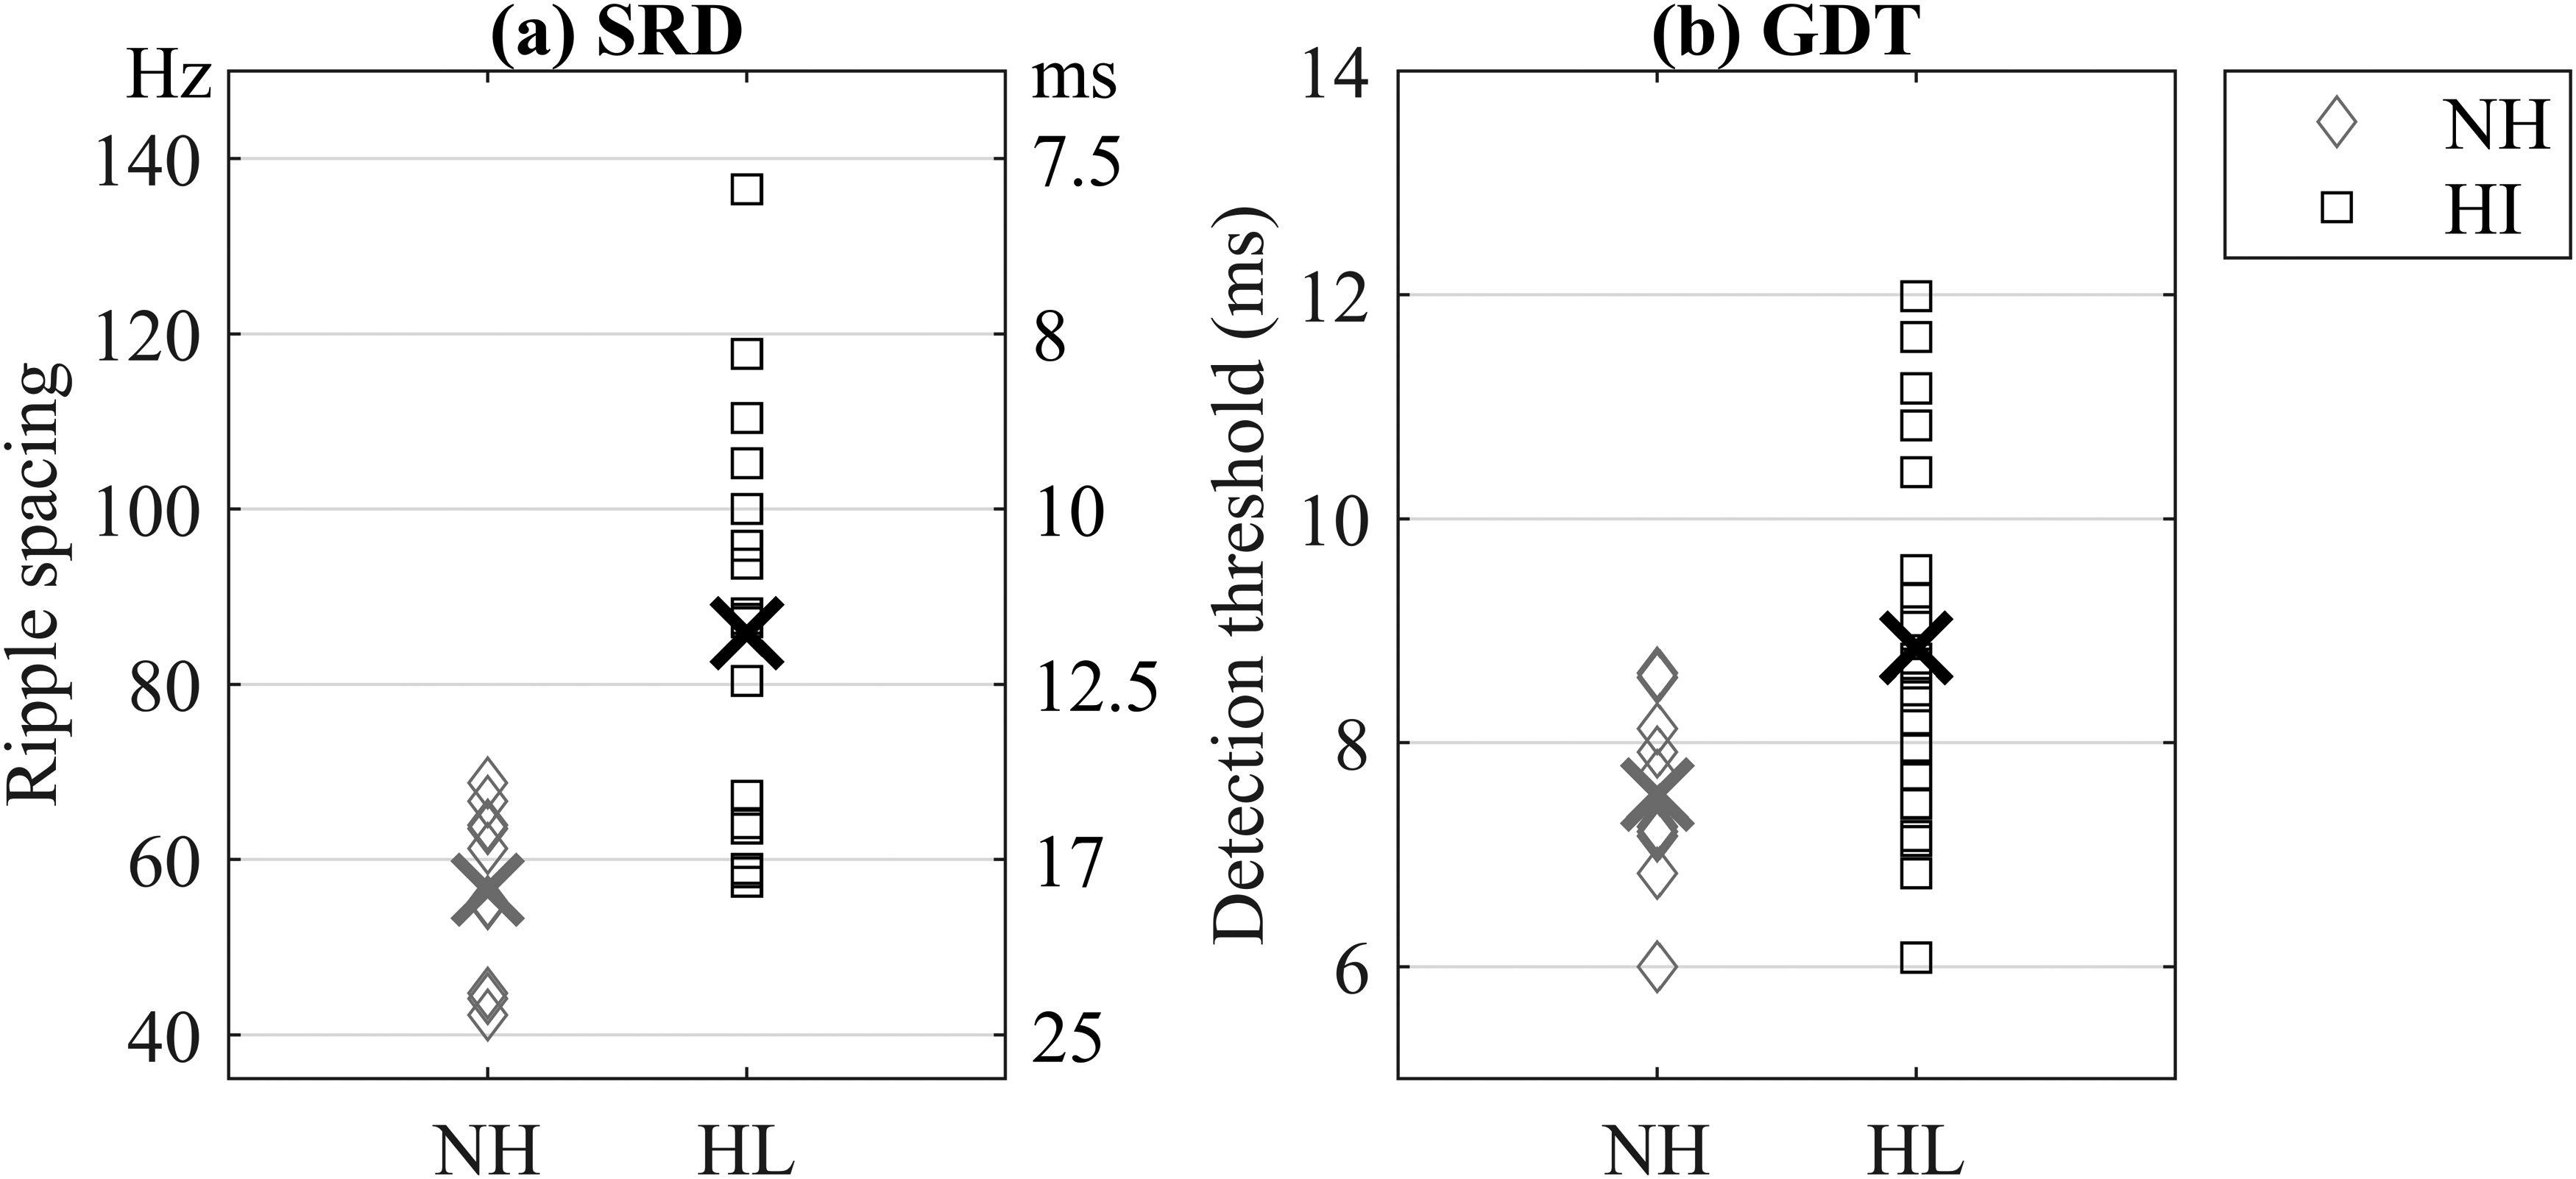
(a) SRD thresholds averaged across left and right ears. The left and right ordinate show results in Hz and ms, respectively. (b) GDT thresholds in ms averaged across left and right ears. NH = unfilled diamonds. HI = unfilled squares. Group means are shown by the X-symbols.
Pearson's Correlation Coefficients (with p-values) for SRD, GDT, PTA4, and Age.

GDT
The GDT thresholds for the NH participants ranged from 5.8 to 9.4 ms on the left ear and from 6.3 to 9 ms on the right ear. A paired t-test showed no difference between right-ear GDT thresholds (M = 7.6 ms, SD = 1.1 ms) and left-ear GDT thresholds (M = 7.5 ms, SD = 0.9 ms) for the NH group [t(9) = −0.2, p = .83].
The thresholds of the HI participants ranged from 6.2 to 13.1 ms on the left ear and from 6.0 to 12.1 ms on the right ear. Again, no difference across ears was observed (right ear: M = 9.1 ms, SD = 2.1 ms; left ear: M = 8.5 ms, SD = 1.6 ms) [t(18) = −1.8, p = .09]. The right- and left-ear GDT thresholds were therefore averaged (Figure 6b). No correlations between GDT, PTA4, and age were found, and neither was there a correlation between GDT and SRD (Table 2).
Self-Reported Listening Habits
The F2, F3, and F6 factor scores are shown in boxplots in Figure 7a. Figure 7b shows the results from the PCA performed on these scores. PC1 explained almost half of the variance in the SP-HHQ data (49.4%), with F2 and F3 loading negatively onto it. Principal component 2 (PC2) accounted for approximately a third of the variance (33.4%), with F6 loading negatively onto it.

(a) Boxplots of scores from the shortened SP-HHQ for the HI (white) and NH (grey) groups. (b) Results from the PCA performed on the F2, F3, and F6 scores. Individual data are shown with unfilled circles. Factor loadings are shown by the black arrows.
Multiple Linear Regression
The first regression model showed a significant negative relation between SRD and the preference scores (β = −0.003, p < .01, η2 = 0.30), corresponding to a large effect size. Neither GDT (p = .46) nor PC1 (p = .67) were found to be significant predictors. The R2-value of the full model was 0.32; with only SRD included, it decreased slightly to 0.29. Figure 8a shows a scatter plot of the proportion-preferred scores for Short Delay as a function of SRD threshold with all participants (N = 29) included.

Scatter plots of proportion-preferred scores for short delay as a function of SRD threshold for (a) all participants (N = 29) and (b) the participants with HI only (N = 19).
The second regression model based on the data from the participants with HI and with SRD and GDT as predictors included essentially confirmed the results from the first model (SRD: β = −0.002, p < .02, η2 = 0.29; GDT: p = .64, η2 = 0.01), with a large effect size observed for SRD. The R2-value of the full model was .30; with only SRD included, it decreased slightly to .29. Figure 8b shows a scatter plot of the proportion-preferred scores for Short Delay as a function of SRD threshold (N = 19).
The third regression model with SRD and PTA3 as predictors confirmed the negative association between SRD and the preference scores found above (β = −.002, p < .04, η2 = 0.34), corresponding to a large effect size. For PTA3, a similar pattern was observed but the relation was not significant (β = −0.004, p = .057, η2 = 0.21).
Discussion
So far, very few studies have investigated perceptual predictors of processing delay. To address this gap, the current study investigated the predictive power of measures of spectral processing abilities (SRD), temporal processing abilities (GDT), and self-reported listening habits (the shortened SP-HHQ, represented by PC1). Additionally, the current study compared the predictive power of PTA3 and SRD in relation to preference for short processing delay. Participants with NH and HI were tested. A HA simulator was used to generate the stimuli for the preference judgments.
Predictive Power of SRD, GDT, and Shortened SP-HHQ
The first regression analysis conducted on the entire dataset revealed a large effect of SRD (β = −0.003, p < .01, η2 = 0.30) but no effects of GDT (p = .46, η2 = 0.03) or PC1 (p = .67, η2 < 0.01). The second regression analysis performed on the data from the HI group with SRD and GDT as predictors gave comparable results (SRD: β = −0.002, p < .02, η2 = 0.29; GDT: p = .64, η2 = 0.01). Overall, these results lend support to the first hypothesis but not to the second and third one (see Introduction).
SRD
The current study was the first one to examine the relationship between spectral processing abilities and preferred processing delay, which is why its findings cannot be compared directly to earlier work. However, measures of spectral processing abilities have been linked to speech perception before. Davies-Venn et al. (2015) found that an SRD-like measure was significantly correlated with speech intelligibility in quiet and with auditory filter bandwidth at 500 Hz. Recently, Zaar et al. (2023) found spectro-temporal modulation (STM) sensitivity to be an effective predictor of speech intelligibility in noise.
Measures reflecting spectral resolution have also been linked to the perceptual effects of processing delay before. To recap, Stiefenhofer (2022) investigated the relation between processing delay and coloration-pitch discrimination. He found that individuals with (near-)normal hearing thresholds below 1.5 kHz could discriminate sound coloration due to delays of 1 ms or shorter, whereas individuals with elevated hearing thresholds below 1.5 kHz could not. In a follow-up study, Lelic et al. (2022) found preference for short processing delay to be correlated with low-frequency hearing thresholds (PTA3), with better thresholds (smaller PTA3) being associated with a stronger preference.
Previous research has linked elevated hearing thresholds to broadened auditory filters and thus poorer spectral resolution (e.g., Dubno & Dirks, 1989; Plack, 2018). Overall, the results summarized above imply that spectral processing abilities are important for speech perception in general and for the perception of processing delay-related effects more specifically. Furthermore, they imply that the SRD measure used here can capture the effects of interest. As such, it promises to be a useful tool for profiling HA candidates in terms of their sensitivity to sound quality degradations caused by processing delay.
GDT
The lack of effects of temporal processing abilities on delay preference could have been due to the chosen experimental measure (gap detection) and stimulus (bouncing ping-pong ball). Temporal effects, such as the perception of echoes, depend strongly on the test stimuli, with transient stimuli such as clicks giving the lowest thresholds (5–10 ms) (Litovsky et al., 1999). In the current study, it was hypothesized that good temporal processing abilities, as assessed with GDT, would be related to preference for short processing delay in case of the ping-pong stimulus. Since no significant effect of stimulus type was found, it was not possible to explore this potential relationship further. However, this does not rule out the existence of such a relationship. It is possible that GDT was not a sensitive measure and that other alternatives, such as echo thresholds, might be predictive.
The bouncing ping-pong ball was chosen because it is a realistic stimulus with transient signal characteristics. This was meant to allow for temporal effects in the perception of processing delay to emerge. As there was a small amount of reverberation in the original recording, it is possible that the ping-pong stimulus was not suited for this goal. Reverberation tends to smear out transient signal characteristics, which could be why no effects were found.
Shortened SP-HHQ
A potential reason for the lack of effects of self-reported listening habits could be that the chosen questionnaire items were not sensitive to the effects at hand. Previous work that attempted to relate self-reported listening habits as assessed with the SP-HHQ to preference for noise reduction processing also failed to find such a link (Neher et al., 2016). Another reason could be the way in which the data were analyzed. For reasons of statistical rigor, the number of variables from the SP-HHQ had to be reduced before the regression analysis. To that end, a PCA was run on the data combined from both participant groups. If this analysis had been carried separately for the two groups, different patterns might have emerged. Follow-up research with a larger sample size should ideally investigate this possibility.
Predictive Power of PTA3 versus SRD
To recap, Lelic et al. (2022) found smaller PTA3 to be associated with a stronger preference for 0.5 ms of delay. The third regression model compared PTA3 and SRD in terms of their ability to predict delay preference, with only SRD being significant (p < .04, η2 = 0.34). As mentioned above, elevated hearing thresholds have been linked to poorer spectral resolution. Overall, the results obtained here suggest that spectral processing abilities (rather than low-frequency hearing thresholds per se) drove the correlation found by Lelic et al. (2022).
Lower Limit for Perception of Processing Delay
The current study also shed some light on when processing delay-related effects become imperceivable. In contrast to earlier similar studies (Bramsløw, 2010; Lelic et al., 2022), an ideal ‘delay’ of 0 ms was included here. No statistical difference between preference for 0 and 0.5 ms of delay was found, suggesting that a delay in the 0.5-ms range will, on average, lead to imperceivable spectral degradations due to comb-filtering.
Limitations
In the current study, a HA simulator with linear amplification and stimulus-independent gains (or frequency shaping) was used. Arguably, the chosen (NAL-NL2) gains were suited for the speech stimulus, but less so for the rain and ping-pong stimuli. It is therefore possible that non-linear amplification and different frequency shaping would lead to other preference patterns.
Furthermore, the NH group was tested with gains prescribed for the N2 standard audiogram. In this manner, the current study followed the approach of Lelic and colleagues (2022) and allowed results to be compared. Because the N2 standard audiogram corresponds to a mild hearing loss, it can be argued that the gains were unrealistic. However, if 0-dB insertion gain had been used for the NH group, this would have led to exaggerated comb-filtering relative to the HI group. That is why this option was not pursued here.
The sample size used here was rather small (but comparable to those used in related studies; see Introduction). This could be why no group differences were found. However, there was a trend for an interaction between participant group, stimulus type, and processing delay (see Figure 4 and LME results). This could indicate that group differences might emerge if more participants were to be tested.
Outlook
The current study compared PTA3 and SRD in terms of their ability to predict preferred processing delay. Because the latter measure was more effective, an SRD-like task could be a beneficial tool for determining candidature for HAs with short processing delays. As sound quality complaints are common among HA users, this might circumvent some of the adverse effects experienced by HA users and in this way increase uptake and usage.
The HA simulator used in the current study imitates HA technology used in commercial HAs to achieve short processing delays (“PureSound”; Townend & Balling, 2020). Arguably, it therefore provides a good approximation to such devices. A key limitation, however, is that it does not allow own-voice conditions to be tested. Because own-voice perception is critical for HA satisfaction (e.g., Hengen et al., 2020; Kochkin, 2000; Laugesen et al., 2011), follow-up research with wearable, real-time-capable test devices is warranted.
Supplemental Material
sj-docx-1-tia-10.1177_23312165241298613 - Supplemental material for Individual Differences Underlying Preference for Processing Delay in Open-Fit Hearing Aids
Supplemental material, sj-docx-1-tia-10.1177_23312165241298613 for Individual Differences Underlying Preference for Processing Delay in Open-Fit Hearing Aids by Borgný Súsonnudóttir, Borys Kowalewski, Georg Stiefenhofer and Tobias Neher in Trends in Hearing
Supplemental Material
sj-tif-2-tia-10.1177_23312165241298613 - Supplemental material for Individual Differences Underlying Preference for Processing Delay in Open-Fit Hearing Aids
Supplemental material, sj-tif-2-tia-10.1177_23312165241298613 for Individual Differences Underlying Preference for Processing Delay in Open-Fit Hearing Aids by Borgný Súsonnudóttir, Borys Kowalewski, Georg Stiefenhofer and Tobias Neher in Trends in Hearing
Footnotes
Acknowledgments
The authors thank Anne Roslyng-Jensen and Lamis Abdalla (University of Southern Denmark) for help with the data collection, Ole Hau (WS Audiology) for input and technical assistance, and the Department of Audiology at Odense University Hospital for help with participant recruitment. Furthermore, they thank two anonymous reviewers for their useful input to earlier versions of this article.
Declaration of Conflicting Interests
The authors declared no potential conflicts of interest with respect to the research, authorship, and/or publication of this article.
Funding
The authors disclosed receipt of the following financial support for the research, authorship, and/or publication of this article: This work was supported by the Innovation Fund Denmark (grant number 0153-00223B) and WS Audiology A/S.
Data Availability Statement
The data analyzed in this manuscript are available from the corresponding author upon reasonable request.
Supplemental Material
Supplemental material for this paper is available online.
References
Supplementary Material
Please find the following supplemental material available below.
For Open Access articles published under a Creative Commons License, all supplemental material carries the same license as the article it is associated with.
For non-Open Access articles published, all supplemental material carries a non-exclusive license, and permission requests for re-use of supplemental material or any part of supplemental material shall be sent directly to the copyright owner as specified in the copyright notice associated with the article.