
Abstract
The purpose of this study was to evaluate the effect of sound quality on ratings of mood (esteem-related affect, vigor, and fatigue), listening-related fatigue, and perceived hearing-related experiences (speech intelligibility, perceived disability, participation, concentration). Thirty adults (51–80 years old) with bilateral hearing loss and at least six months of hearing aid experience participated in this crossover study. They adjusted hearing aids based on sound quality in a laboratory setting, creating a preferred program (good sound quality) and a non-preferred program (tolerable sound quality). After a cooling-off period, they wore each hearing aid program (counterbalanced) home for approximately one week each. During the home trial, they provided ratings of hearing aid sound quality, mood, and hearing-related experiences daily. After each home trial, they rated their listening-related fatigue retrospectively. Sound quality ratings were significantly related to hearing-related experiences and mood ratings during the home trial. Nineteen of the participants preferred their “good” program during the home trial, while the remaining 11 preferred the “tolerable” program. For the participants whose program preference was consistent between the lab and home experiences, listening-related fatigue and mood were significantly better during the week with the “good” program. These results highlight the importance of sound quality for listening-related fatigue and mood for adult hearing aid users.
Introduction
Adults with permanent hearing loss are at an increased risk of reduced well-being in both mental (Jayakody et al., 2022; Kramer et al., 2002; Singh et al., 2023; Tambs, 2004) and physical (Gao et al., 2020; Martinez-Amezcua et al., 2021) domains. Reduced mental and physical well-being might be partially attributable to moods. In this context, mood refers to a combination of transient affective states that persist for a long time without distinct specific causes; moods are generally less intense than acute emotional responses to specific events (Beedie et al., 2005; McNair et al., 1992; Mitchell, 2021; Morris, 2012). Moods serve as mediators between life events and well-being (Majauskiene et al., 2025), ultimately guiding behavior (Morris, 2012; Robinson, 2000) through multi-directional relationships between behavior, cognition, sociability, and health (Cohen & Rodriguez, 1995). That is, life events and circumstances can affect well-being, but one's interpretation of the events (through current mood) also colors the response to the events, ultimately affecting well-being (Kriegel, 2025; Thayer, 1989).
Factors Affecting Mood
Because of the critical role mood plays in general well-being and health (Robinson, 2000; Thayer, 1989), it is important to understand factors that affect mood. Positive and negative moods are often described to be relatively independent dimensions, with different patterns of neural activity (Carver & Scheier, 1990; Kim & Hamann, 2007) and different influences of personality traits (Baker et al., 1992; Gross & John, 2003; Zheng et al., 2016). Therefore, it is important to study both positive and negative moods. The focus in this study was on two positive moods (esteem-related affect and vigor) and one negative mood (fatigue).
Esteem-related affect is related to how people attribute success and failures; when they attribute their successes to their own competence, they feel more pleased and more confident, feel self-efficacious, and anticipate they can be successful in the future (McCarrey, 1984). Words associated with esteem-related affect include confidence, competence, satisfaction, and pride (Grove & Prapavessis, 1992; McNair et al., 1992). Another positive mood, vigor, is related to feeling energized physically and mentally, and also to pleasantness or contentment (Shirom, 2011). Adjectives describing vigor include lively, active, energetic, full of pep, and vigorous (Grove & Prapavessis, 1992; McNair et al., 1992). Among other things, vigor can be increased by meaningful social interactions (Shraga & Shirom, 2009) and decreased by social isolation (Peterson et al., 2021).
Fatigue, a negative mood state, is a feeling of weariness, tiredness, or lack of energy (Bess & Hornsby, 2014; O’Connor, 2004; Tiesinga et al., 1996). Although related to vigor conceptually, fatigue is often independent from vigor, rather than being on the opposite side of vigor in a bipolar construct (Heuchert & McNair, 2012; Stein et al., 1998). Adjectives used to describe fatigue include worn out, exhausted, weary, and bushed (Grove & Prapavessis, 1992; McNair et al., 1992). High levels of fatigue have been related to hunger (Ackermans et al., 2022), dehydration (Zhang et al., 2019), and chronic illness (Curt, 2000; Evans & Wickstrom, 1999; Flechtner & Bottomley, 2003).
A more specific form of fatigue has been described recently, namely listening-related fatigue. Listening-related fatigue is also a mood state, but is caused by sustained levels of high listening effort (Davis et al., 2021). Factors that affect listening-related fatigue are those that affect listening effort (e.g., background noise, reverberation; Pichora-Fuller et al., 2016). Listening-related fatigue is also mediated by exogenous and endogenous factors, such as the importance of listening and the reward for listening success (Boksem & Tops, 2008; Davis et al., 2021; Hockey, 1997). Like general mood, listening-related fatigue has been linked to overall well-being (Holman et al., 2021c).
Mood and Hearing
There is limited evidence about the relationship between mood and hearing loss. Some evidence suggests that people with hearing loss might report similar moods in general as their peers with normal hearing (Preminger & Meeks, 2010). When focusing on individual moods, most of the evidence is specific to fatigue. A review of literature did not identify any studies of esteem-related affect in adults with hearing loss.
The evidence linking hearing loss to general (rather than listening-related) mental fatigue is somewhat mixed (Holman et al., 2021a). There does seem to be an increased risk of general fatigue for adults with hearing loss compared to their peers with normal hearing (Alhanbali et al., 2017; Hornsby & Kipp, 2016), especially among people who are employed (Hétu et al., 1988; Kramer et al., 2006). However, others have reported the effects of hearing loss are larger for vigor than for fatigue (Hornsby & Kipp, 2016). For listening-related fatigue, the extant literature is more consistent, showing that hearing loss increases the risk of listening-related fatigue (Davis et al., 2021; Hornsby et al., 2024; McGarrigle et al., 2021). Given the importance of listening and listening effort to listening-related fatigue (Blümer et al., 2024; Hornsby, 2013), this is not surprising.
More likely than audiometric hearing loss, it appears that people with more perceived hearing-related difficulties are more likely to report more negative mood states (Hornsby & Kipp, 2016; Preminger & Meeks, 2010). The relationship between perceived hearing difficulty and mood is somewhat intuitive. Hearing loss limits communication ability and thus social participation (Fellinger et al., 2007; Jayakody et al., 2022; Mick et al., 2014), which in turn reduces the chances for positive moods (Brink & Stones, 2007). In addition, when social participation does occur for adults with hearing loss, it often involves effortful listening (Alhanbali et al., 2017), which could result in increased negative mood, namely fatigue (Brewster et al., 2021), and especially listening-related fatigue (e.g., Davis et al., 2021). Therefore, sustained increases in effortful listening might increase general fatigue as well as listening-related fatigue.
Hearing Aids and Mood
Because hearing aids improve communication (Boi et al., 2012) and support social participation, it would also be expected that they improve mood (Brink & Stones, 2007), especially positive moods like esteem-related affect and vigor (Clark & Watson, 1988). Consistent with this hypothesis, some studies have found that hearing aids can moderate the relationship between hearing loss and mental or physical wellbeing (Bigelow et al., 2020) and can improve overall well-being (Boi et al., 2012; Gao et al., 2020; Tsimpida et al., 2022).
However, studies linking hearing aids and mood are limited in the extant literature. Available evidence linking hearing aids and mood has primarily focused on fatigue or vigor (Holman et al., 2021a), rather than esteem-related affect. Consistent with expectations regarding the relationship between listening effort and listening-related fatigue, hearing aids have been shown to reduce listening-related fatigue in the laboratory (Blümer et al., 2024; Hornsby, 2013) and in the field (Holman et al., 2021b). However, the effects of hearing aids for reducing fatigue in daily activities have not been reported to be universally positive by adult hearing aid users (e.g., Davis et al., 2021).
Sound Quality
One potential explanation for the mixed benefits of hearing aids for mood could be variability in perceived sound quality across hearing aid users. It is clear that hearing aid sound quality is an important contributor to outcomes such as use, benefit, and satisfaction (Bannon et al., 2023; Picou, 2022; Wong et al., 2003). What is less clear is how sound quality might affect mood or listening-related fatigue. It is possible that hearing aid users would report better mood when using hearing aid gain settings that optimize sound quality, as compared to when using settings that are simply tolerable.
Indirect support for this hypothesis comes from other fields. For example, people in an office space report better mood if they prefer the quality of light in the space (Basishvili et al., 2019; Borisuit et al., 2015) or when the temperature and humidity are comfortable (Bergefurt et al., 2022). Similarly, comfortable clothing can improve mood (Kang et al., 2013; Moody et al., 2010). Combined, these findings suggest that high-quality sensory experiences, particularly comfort, can affect mood. Although hearing aid sound quality is more complex than simple comfort, encompassing dimensions such as loudness, fullness, and sharpness (Davies-Venn et al., 2007; Gabrielsson et al., 1988), it is possible that the sensory experience of listening to hearing aids with good sound quality could improve mood.
However, optimizing sound quality at a group level without distorting the hearing aid sound quality in a way that is clinically unrealistic is difficult, or even impossible, due to considerable inter-individual variability in sound quality preferences (Dreschler et al., 2008; Keidser, 1996; Keidser et al., 2005; Nelson et al., 2018). Because predicting individual variability in preferences for deviation away from prescriptive targets is difficult (Mackersie et al., 2020; Perry et al., 2019; Søgaard Jensen et al., 2019), allowing individuals to adjust their own preferred frequency responses might be valuable. With the proliferation of smartphone-based applications for hearing aids (e.g., Picou, 2022), modern hearing aid patients could easily be provided with the opportunity to adjust their hearing aids to optimize sound quality.
Purpose
The purpose of this study was to evaluate the effect of sound quality on ratings of mood (esteem-related affect, vigor, and fatigue), listening-related fatigue, and perceived hearing-related experiences (speech intelligibility, perceived disability, participation, concentration). To manipulate sound quality, participants self-adjusted their hearing aid gain to create two settings: one that optimized sound quality (Good Program) and one that had sound quality that was noticeably worse than the Good Program, but that they would be willing to wear for about a week (Tolerable Program). They then wore the hearing aids home for a week in each setting (blinded to the program). During each week, they answered questions at the end of each day about mood (esteem-related affect, vigor, fatigue) and hearing-related experiences (speech intelligibility, perceived hearing disability, ability to participate, and need to concentrate while listening). They also rated the degree to which their days were typical and the sound quality of their hearing aids that day. After each trial period, they reported in retrospect their listening-related fatigue.
The role of sound quality was evaluated in two ways: (1) by examining the relationship between sound quality ratings and ratings of mood at the end of the day during a field trial and (2) by examining the differences in mood when participants were wearing the Good and Tolerable programs. Based on the connection between social participation and mood, and the relationship between sensory experiences and mood in office spaces, it was expected that participants would report better mood (especially daily ratings but also retrospective ratings of listening-related fatigue) when wearing hearing aids with optimized sound quality, compared to when they were wearing hearing aids with a merely tolerable sound quality. It was also expected that ratings of sound quality would be positively correlated with ratings of mood.
Materials and Methods
Participants
Potential participants were recruited via a local audiology clinic from January through August 2024. Based on a review of medical records, adults (aged 50–85 years) were invited to participate if they exhibited bilateral sensorineural hearing loss and had worn hearing aids for more than 6 months. They were eligible to participate if they, based on self-report, had no neurogenic or cognitive disorders, were not taking psychotropic medication (e.g., anti-depressants), and were fluent in English. In addition, adults were targeted for participation if they reported that hearing aid sound quality was important to them. This criterion was included to focus on participants who would be most likely to be sensitive to differences in sound quality between programs for this initial investigation of the connection between sound quality and mood. Required sample size was estimated to be 25 participants, based on an a priori power analysis of pilot data, assuming moderate effect size and power of 0.80. Considering possible attrition, target enrollment was set to be 30 participants.
Thirty-four adults agreed to be in the study and were seen for their first study visit. Four of those participants did not complete the study, one because they changed their mind about study participation before starting study procedures and three because they did not pass the auditory identification task that was required for study participation (described below). The remaining 30 adults (51–80 years, median = 74 years, SD = 6.22) completed the study. Their audiometric thresholds are displayed in Figure 1. Table 1 displays a summary of the selected demographics and suspected etiologies, in addition to a summary of their stated reasons why sound quality is important. The full set of reasons participants reported sound quality being important are listed in Supplemental Digital Content 1. Compensation for study participation was provided. Study procedures were approved by the local Institutional Review Board.

Pure-tone, air-conduction audiometric thresholds for the left (left panel) and right (right panel) ears of study participants (in color). Mean thresholds across study participants in each ear are indicated by solid black lines.
Demographic Characteristics of Study Participants Combined, in Addition to Separated by Group (Consistent, Inconsistent).

Note: Statistical tests were conducted to compare participants in the consistent and inconsistent groups (not compared to the overall group).
Significant differences between consistent and inconsistent participants were assessed with Wilcoxon rank sum test, Pearson's Chi-squared test, or Fisher's exact test, depending on the data structure.
Mean (SD) range.
Range; n (%).
Hearing Aid Fitting
Research hearing aids (Widex Moment receiver-in-the-canal, behind-the-ear) were fitted to participants in the laboratory. Participants were fitted with ‘M’ receivers and non-custom eartips that were consistent with their own hearing aid coupling. The research hearing aids were programed to have outputs matching prescriptive targets (National Acoustics Laboratories—Non-linear version 2 [NAL-NL2]; Keidser et al., 2012) for each ear of each participant. Fittings were verified using probe-microphone measures and recorded speech (i.e., carrot passage of the Audioscan Verifit 2). The mean absolute deviation from prescriptive target across ears and participants was less than 5 dB through 6000 Hz (standard deviations < 4.5 dB). At 8000 Hz, the mean absolute deviation from target was 5.9 dB (standard deviation = 4.8 dB), which was considered acceptable because many clinically fit hearing aids are under-fit at 8000 Hz (e.g., Dao et al., 2021). The default parameters were used for advanced features in both programs, leaving noise reduction active, directional microphones automatic and adaptive, and feedback reduction active.
Preferred Program Adjustment
After being fit to prescriptive targets, participants adjusted the hearing aid gain settings of the research hearing aids under controlled laboratory conditions using a smartphone app (MOMENT v 1.6) installed on a research smartphone (Apple iPhone Xr). The smartphone application included three sliders that could be controlled by the participants. The three sliders controlled three frequency bands (Bass 0.1–0.7 kHz; Mid: 0.6–3.6 kHz; Treble: 2.2–10 kHz) and allowed for adjustments of up to 12 dB up and down for the Bass band and 12 dB down to 6 dB up for the Mid and Treble bands. Participants were instructed to create two programs, and the experimenter demonstrated the adjustment of the sliders in the application. Specifically, their first instruction was: We are asking you to adjust your hearing aids in a way that best suits you. You will listen to different kinds of sounds and adjust the sound using these three bars on the app [demonstrate the app]. Your job is to set the hearing aids to make the sound quality the best overall. Even though you are listening to different kinds of sounds, you should set the hearing aids so they have the best sound quality for as many of the sounds as possible.
Then, the experimenter played a variety of sounds, one type at a time, in a loop, providing the participant an opportunity to adjust the hearing aids for a variety of sound types. Participants were instructed to find a single set of slider settings that worked for all the sounds. The sound types were: English speech (5 passages spoken by a female talker from the Connected Speech Test; Cox et al., 1987; Cox et al., 1988), non-English speech (the same short passage of descriptive Danish text spoken by two males and two females), classical music (solo flute and orchestra, orchestral chamber music, and mixed choir), non-classical music (instrumental jazz, jazz with female vocal, instrumental pop, rock music with male vocal, and samba music), animal sounds (sounds #107, 113, 120, 132, 151 from the International Affective Digitized Sounds; Bradley & Lang, 2007) and laughter (sounds #220, 221, 226, 230 from the International Affective Digitized Sounds). Each type of sound (e.g., English speech) was concatenated with spaces between sound files removed; all sounds were normalized for root mean square (rms) level within and across sound types using sound editing software (Adobe Audition v. 24.0).
After participants listened to all sound types, repeated listening as necessary, and were satisfied with the adjustment of the hearing aids, the settings were saved as a custom program, hereafter referred to as “Good Program.” Participants were then instructed to follow the same procedures, but instead of optimizing sound quality, they were instructed to “Create a sound quality that you find noticeably worse than your optimal settings, but still a sound that you would be willing to wear for about a week.” Once the participant was certain of those settings, they were saved as a second custom program, “Tolerable Program.”
After creating the two programs, they walked with the experimenter out of the laboratory to the hospital cafeteria. The walking trip involved an elevator ride, crossing a skybridge, and several long, reverberant hallways. Throughout the trip, the experimenter and participant conversed. The experimenter switched between the Good and Tolerable programs using the smartphone app. The purpose of the excursion was to ensure that the participant was content with their programs, would be willing to wear each for about a week, and could hear the difference between the programs.
Program Identification Task
To ensure that participants could hear the difference between the Good and Tolerable Programs, they completed a blinded program identification task. The experimenter played one sentence from the Connected Speech Test, switched the program, and played a second sentence from the Connected Speech Test. The participant's task was to indicate which of the two sentences was played through the Good Program. The task was completed 4 more times. The order of programs was randomized so that the Good Program was presented first about half of the time. Participants were required to correctly identify the Good Program in four of five trials to continue study participation. Four out of five correct was chosen because it requires a small number of comparisons, allows a criterion that is strict enough to occur by chance less than 5% of the time, and tolerates a single misidentification. If a participant did not pass the identification test, they repeated the program setting task and the excursion to create new Good and Tolerable programs. They then repeated the identification task. If they still did not pass the identification test, they were withdrawn from the study. Three participants (described above) ultimately did not pass the identification task and were withdrawn from the study.
Field Questionnaires
Questionnaires were completed via link in Research Electronic Data Capture (REDCap), a secure, web-based application for data capture (Harris et al., 2019; Harris et al., 2009). Participants were instructed to answer questions about sound quality, day typicality, hearing-related experiences, and mood at the end of each day during the two field trials (details below). After the hearing and mood questions, participants were also provided a free response text box with the prompt “do you have any comments about your hearing experiences today?”
Sound Quality
To evaluate sound quality during the home trial, participants were asked, “How would you rate the sound quality of the hearing aids in the situations that you have been in today?” Possible scores ranged from 0 to 10, with verbal anchors displayed along a line at the extremes (poor, excellent) and in the middle (acceptable). The number was not displayed for the participant, only recorded for data analysis.
Day Typicality
It is possible that not wearing hearing aids or having an atypical day could affect the interpretation of the effects of hearing aid sound quality on mood on a given day. Therefore, participants were asked to report both hearing aid use and day typicality. Specifically, they were asked to report “approximately how many hours” they wore the study hearing aids that day by typing in a numeric value. They were also asked “How typical has your day been for you today?” with anchors on the extremes of “very unusual” to “very typical” along a number line. The scores ranged from 0 (unusual) to 10 (typical), although participants did not see the numerical values.
Hearing-Related Experiences
A bespoke set of questions was used to evaluate perceived hearing-related experiences. The response options for these questions were based on those of the Speech Spatial and Qualities (SSQ; Gatehouse & Noble, 2004) questionnaire. Inspiration for the questions was drawn from different sources (SSQ for question 4, IOI-HA Cox and Alexander (2002) for question 2). Possible responses on all questions ranged from 0 to 10, where 10 would be the most favorable rating, and 0 would be the least favorable rating. Verbal anchors were equally spaced above sliders for participant responses. As with the other questions, the number was not visible to the participants. The specific questions (and verbal anchors) were:
Speech intelligibility. How would you rate your ability to understand speech today? (poor, acceptable, excellent) Perceived disability. With the hearing aids, how much have your hearing difficulties affected the things you have done today? (very much affected, affected not at all). Participation. How satisfied are you with your ability to participate in daily life today? (not at all satisfied, very satisfied) Concentration. To what extent did you have to concentrate very much when listening to someone or something today? (lots of concentration needed, little concentration needed)
Mood (Esteem-Related Affect, Fatigue, Vigor)
The Profile of Mood States (POMS; McNair et al., 1992) in the abbreviated version of Grove and Prapavessis (1992) was used to evaluate mood, using the subscales of esteem-related affect, fatigue, and vigor. The abbreviated version of the POMS includes a list of adjectives for each subscale and respondents are asked to rate the extent to which they identify with each adjective. For each adjective, listed below, response options are “not at all,” “a little,” “moderately,” “quite a lot,” and “extremely.” Categorical responses were assigned a score of 0 (not at all) to 4 (extremely); adjectives in italic typeface were reverse scored, so higher scores indicate more positive mood across all adjectives. Total scores in each subscale were summed, with possible scores ranging from 0 to 20 and higher scores indicating more positive mood. Adjectives were presented in a random order.
Esteem subscale: Confident, competent, satisfied, ashamed, proud. Fatigue subscale: Worn out, fatigued, exhausted, weary, bushed. Vigor subscale: Lively, active, energetic, full of pep, vigorous.
Laboratory Measures
Sentence Recognition in Noise
Before the start of the field trials, participants completed the Quick Speech in Noise test (QuickSIN; Killion et al., 2001) in the sound field of an audiometric sound booth. Specifically, speech was presented at 70 dB HL from a loudspeaker (Tannoy Precision 6). Testing was conducted according to the test instructions. The signal-to-noise ratio (SNR) where the participant understood 50% of the speech was calculated and then was converted to SNR Loss, according to the QuickSIN manual. Participants were tested in three conditions, the prescriptive fitting and with both customized programs (Good Program and Tolerable Program). Linear mixed-effects analysis revealed no differences in QuickSIN SNR Loss scores between these three conditions (F[1, 25] = 0.23, p = .633); the mean QuickSIN SNR Loss was 5.6 dB (SD = 3.22, range 1–12.5) and differences between conditions were small (<0.5 dB).
Semi-Structured Interview
After each field trial, the experimenter conducted a semi-structured interview with each participant in the laboratory. Notes about participants’ responses were entered into a spreadsheet (Microsoft Excel). The specific questions asked were:
What was the sound quality like listening with the hearing aids this week? Were there any situations where the sound quality was enjoyable? Were there any situations where the sound quality was not enjoyable? Did you experience any difficulties with the hearing aids? Is there anything else we should know about your field trial? Did you notice a difference between your experiences in the two field trials? (asked only after the second field trial)
Listening-Related Fatigue
Listening-related fatigue was evaluated retrospectively in the laboratory by asking participants to complete a questionnaire after each field trial, reflecting on their previous week while they used study hearing aids in the Good and Tolerable programs. Specifically, each time they completed the Brief Version of the Vanderbilt Fatigue Scale for Adults (VFS-A-10; Hornsby et al., 2023), which includes 10 items; each item is a statement related to a symptom of fatigue (e.g., “I feel worn out from everyday listening”). Respondents are asked to report the frequency with which they experienced with the symptom for the last week, with response options of “never/almost never,” “rarely,” “sometimes,” “often,” and “almost always/always.” Categorical responses are assigned a score from 0 (never/almost never) to 4 (almost always/always). Total scores are calculated by summing responses to 10 items. Possible scores range from 0 to 40, with higher scores indicating more frequent listening-related fatigue over the last week.
Procedures
The study included four laboratory visits (summarized in Table 2). During the first laboratory visit, participants provided informed consent, underwent audiometric testing, and hearing aid fitting. Following the hearing aid fitting, participants adjusted the hearing aid gain to create the two programs, one with a sound quality they liked (Good Program) and one with a tolerable, but worse sound quality (Tolerable Program). To continue participation, they successfully identified their preferred program in the blinded identification task. Gain adjustments and program identification were conducted in a sound-attenuating test booth. Sounds were controlled using custom programing (Neurobehavioral Systems Presentation, v 23.0) on a computer (Dell). They were routed from the computer to an audiometer for level control (Madsen Orbiter 922) to an amplifier (Russound Crown DPA 6.12) and finally a loudspeaker (Bowers and Wilkins 685 S2) located 1.25 m directly in front of the participant. Sounds were presented at a mean level of 60 dBA and were calibrated prior to testing using a steady-state noise (created with Adobe Audition v24) that had the same long-term average spectral shape as the concatenated sound files.
Outline of Study Procedures.

Then, participants went home for a “cooling-off” period (approximately one week), where they did not participate in any study procedures. This period was included to weaken the positive or negative expectations participants might have of programs that they had just created. During that time, the experimenter programed a set of hearing aids with either the Good or the Tolerable Program (randomized across participants), based on the app settings saved during the program adjustment task.
When participants returned for the second laboratory visit, they were given the research hearing aids programed to either the Good or Tolerable Program. They were blind to the program and were not told that they were wearing the programs that they had created before the cooling-off period. Also, during this laboratory visit, they were given instructions on completing the daily questionnaires. During both field trials, via daily on-line survey, they answered the sound quality, day typicality, hearing-related experiences, and mood questions, and provided general comments about their hearing experiences, all considering that day with the research hearing aids. They returned to the laboratory for a third visit, completed the listening-related fatigue questionnaire and participated in a semi-structured interview, both while considering in retrospect the previous week with the first program. They then completed a second field trial with the other hearing aid program (Tolerable or Good). During the final laboratory visit, they completed the listening-related fatigue questionnaire about their week wearing the second program, participated in the semi-structured interview, and returned the research hearing aids at the conclusion of the study.
Data Analysis
To ensure that the Good Program was the preferred program and the Tolerable Program was the non-preferred program, comments provided during the semi-structured interview after each field trial were examined. Comments indicating a clear preference for one program (e.g., “This program is so much better than last week”) were interpreted as evidence of program preference. Based on this, participants were assigned to one of two groups. The “Consistent” group had comments about the hearing aids in the week with the Good Program that were consistent with their laboratory preferences (i.e., they commented that the sound quality with the Good Program was good). Recall that participants were blinded to the program during the field trial. The “Inconsistent” group had comments about hearing aids during the week with the Good Program that suggested they preferred the sound quality of the Tolerable Program. If a participant did not provide comments that clearly identified a preferred program, they were assigned to the “Consistent” group. The evaluation of the qualitative feedback was completed by consensus of two authors who were blinded to the other study outcomes at the time of comment review and evaluation.
For each questionnaire (hearing-related experiences, mood, listening-related fatigue), scores were analyzed using linear mixed effects modeling. Random-effects structures were determined by starting with the maximum structure and with participant slopes by within-participant factors; the maximum structure that converged was maintained, consistent with the suggestions by (Meteyard & Davies, 2020). The fixed effects in the final model were determined in stepwise fashion, with potential variables added one at a time, maintaining only variables that were statistically significant. The variables were tested going from the least to most relevant to the research questions (based on team consensus), in the following order:
Subscale (esteem, fatigue, vigor) Age (in years) Pure-tone average thresholds (across ears for 0.5, 1, 2 and 4 kHz) Absolute mean program change in the app (averaged across bass, mid, and treble sliders) Real-ear aided response (REAR; mean in both ears from 500 to 4,000 Hz) Study trial period (first or second) Degree to which the day was typical (typicality rating from the day) QuickSIN SNR Loss (measured with each program) Sound quality rating (rating from the day) Program (Good, Tolerable) Consistency (whether a participant's lab and field trial preferences were consistent)
Interactions between Program and Consistency or Subscale were allowed and were entered into the models after main effects in isolation. Continuous variables were centered and scaled prior to inclusion in regression models. Analysis of the hearing-related experience ratings was completed similarly, without the subscale factor. Analysis of the listening-related fatigue scores was also completed similarly, but without the subscale factor and without the factors related to daily reports (i.e., day typicality, sound quality rating). Prior to analysis, data were excluded if a participant indicated they wore the hearing aids for 0 h that day or if only partial surveys were completed (e.g., they did not finish rating all mood adjectives). The stepwise processes are detailed in the supplemental materials, while the main text presents only the final models.
All analyses and visualizations were conducted using the R language for statistical computing (R Core Team, 2023). Models were constructed using the lmer function of the
Results
Hearing Aid Fitting and Preferred Program
Preferred Programs
Supplemental Digital Content 2 displays a summary of the subjective comments from the semi-structured interview after the field trials with the Good Program and the Tolerable Program for all 30 participants, in addition to the interpretation of which program was determined to be preferred by the researchers. Four participants ultimately did not indicate a program preference based on the two weeks of home trials. Eleven participants changed their preference, providing qualitative feedback that indicated that they preferred the Tolerable Program in real life. That is, during the end-of-study interview, they expressed a clear preference for the program that was originally set to be their non-preferred program (Tolerable Program). These 11 participants are labeled as having “Inconsistent” preferences because their laboratory setting and field trial comments were in conflict. The remaining 19 participants are labeled as having “Consistent” preferences because they defined a Good Program in the laboratory and did not indicate a change of opinion during the blinded field trial experience. Table 1 displays the characteristics of the participants with consistent versus inconsistent preferences. As displayed in the table, the two groups are similar to each other demographically. The only statistically significant difference is related to education level; most of the participants with a consistent preference had a college education and the education levels were more diverse among the participants with inconsistent preferences.
Hearing Aid Output
Figure 2 displays the measured REAR values for participants with consistent preferences (left panel) and inconsistent preferences (right panel) for the Good and Tolerable programs, in addition to the program fit to NAL-NL2. Analysis of the REAR using linear mixed-effects modeling with random levels for program by participant and fixed factors of program (Good, Tolerable), consistency (Consistent, Inconsistent), and frequency (500–4,000 Hz as a categorical variable) revealed a significant main effect of frequency (F[6, 1134] = 443.72, p < .0001) and Program (F[2, 28] = 12.29, p = .0001), in addition to a significant Program by Frequency interaction (F[12, 1134] = 3.06, p = .0003). Follow-up analyses revealed no differences in hearing aid output for 500 and 750 Hz. However, for frequencies from 1,000 to 4,000 Hz, hearing aid output was higher for the Good than the Tolerable program (3–5 dB differences, p < .01), but the Good and the NAL-NL2 programs had similar hearing aid outputs (0.5 to 2 dB difference, p > .15). None of the interactions with Consistency were statistically significant (all p > .180).

Mean measured hearing aid output (real ear aided response in dB SPL) for the hearing aids fit to National Acoustics Laboratories—Non-linear version 2 (NAL-NL2) prescriptive targets, in addition to participant-adjusted good and tolerable programs. Error bars indicate standard deviations. The Tolerable program had statistically significantly less output at 1,000–4,000 Hz compared to the Good and the NAL-NL2 programs, which were statistically similar to each other.
These results indicate that, during the laboratory experience, participants on average adjusted the hearing aid gain to be similar to the NAL-NL2 prescription setting for their Good program and significantly less than the NAL-NL2 prescription when setting a Tolerable program (at least from 1,000 to 4,000 Hz). This was similar for participants who had consistent and inconsistent preferences between the laboratory and home trial experiences. Supplemental Digital Content 3 displays the measured hearing aid output in all three programs for individual participants in both groups (consistent and inconsistent preferences).
Field Questionnaires
Two surveys completed during the field trial were excluded because participants indicated they wore the hearing aids for 0 h that day (70-year-old female in the Tolerable Program, 80-year-old female in the Good Program). In addition, 14 surveys were initiated, but the participants did not finish the mood ratings. These surveys were not included in any subsequent analyses. After these exclusions, the median number of surveys provided by participants was 7 (range 4–12) in the Good program and 7 (range 3–13) in the Tolerable program, consistent with the approximately week-long field trial with each program (some participants had longer or shorter field trials due to scheduling demands).
Hearing-Related Experiences
Preliminary analysis using Spearman correlations between scores on the four hearing-related questions revealed that the responses to these questions were highly correlated; all coefficients were larger than 0.7 and were statistically significant (p < .00001), as evaluated using the
The final model of hearing-related ratings is displayed in Table 3. The results reveal that degree of hearing loss (in pure-tone average), ratings of typicality, and ratings of sound quality were all significantly related to ratings of hearing-related experiences. As displayed in Figure 3, ratings of hearing were higher (better) for participants with lesser degrees of hearing loss, on days that were more typical, and on days when sound quality was rated higher. Interestingly, neither program nor participant consistency was a significant explainer of variability (see Supplemental Digital Content 4 for model construction details).
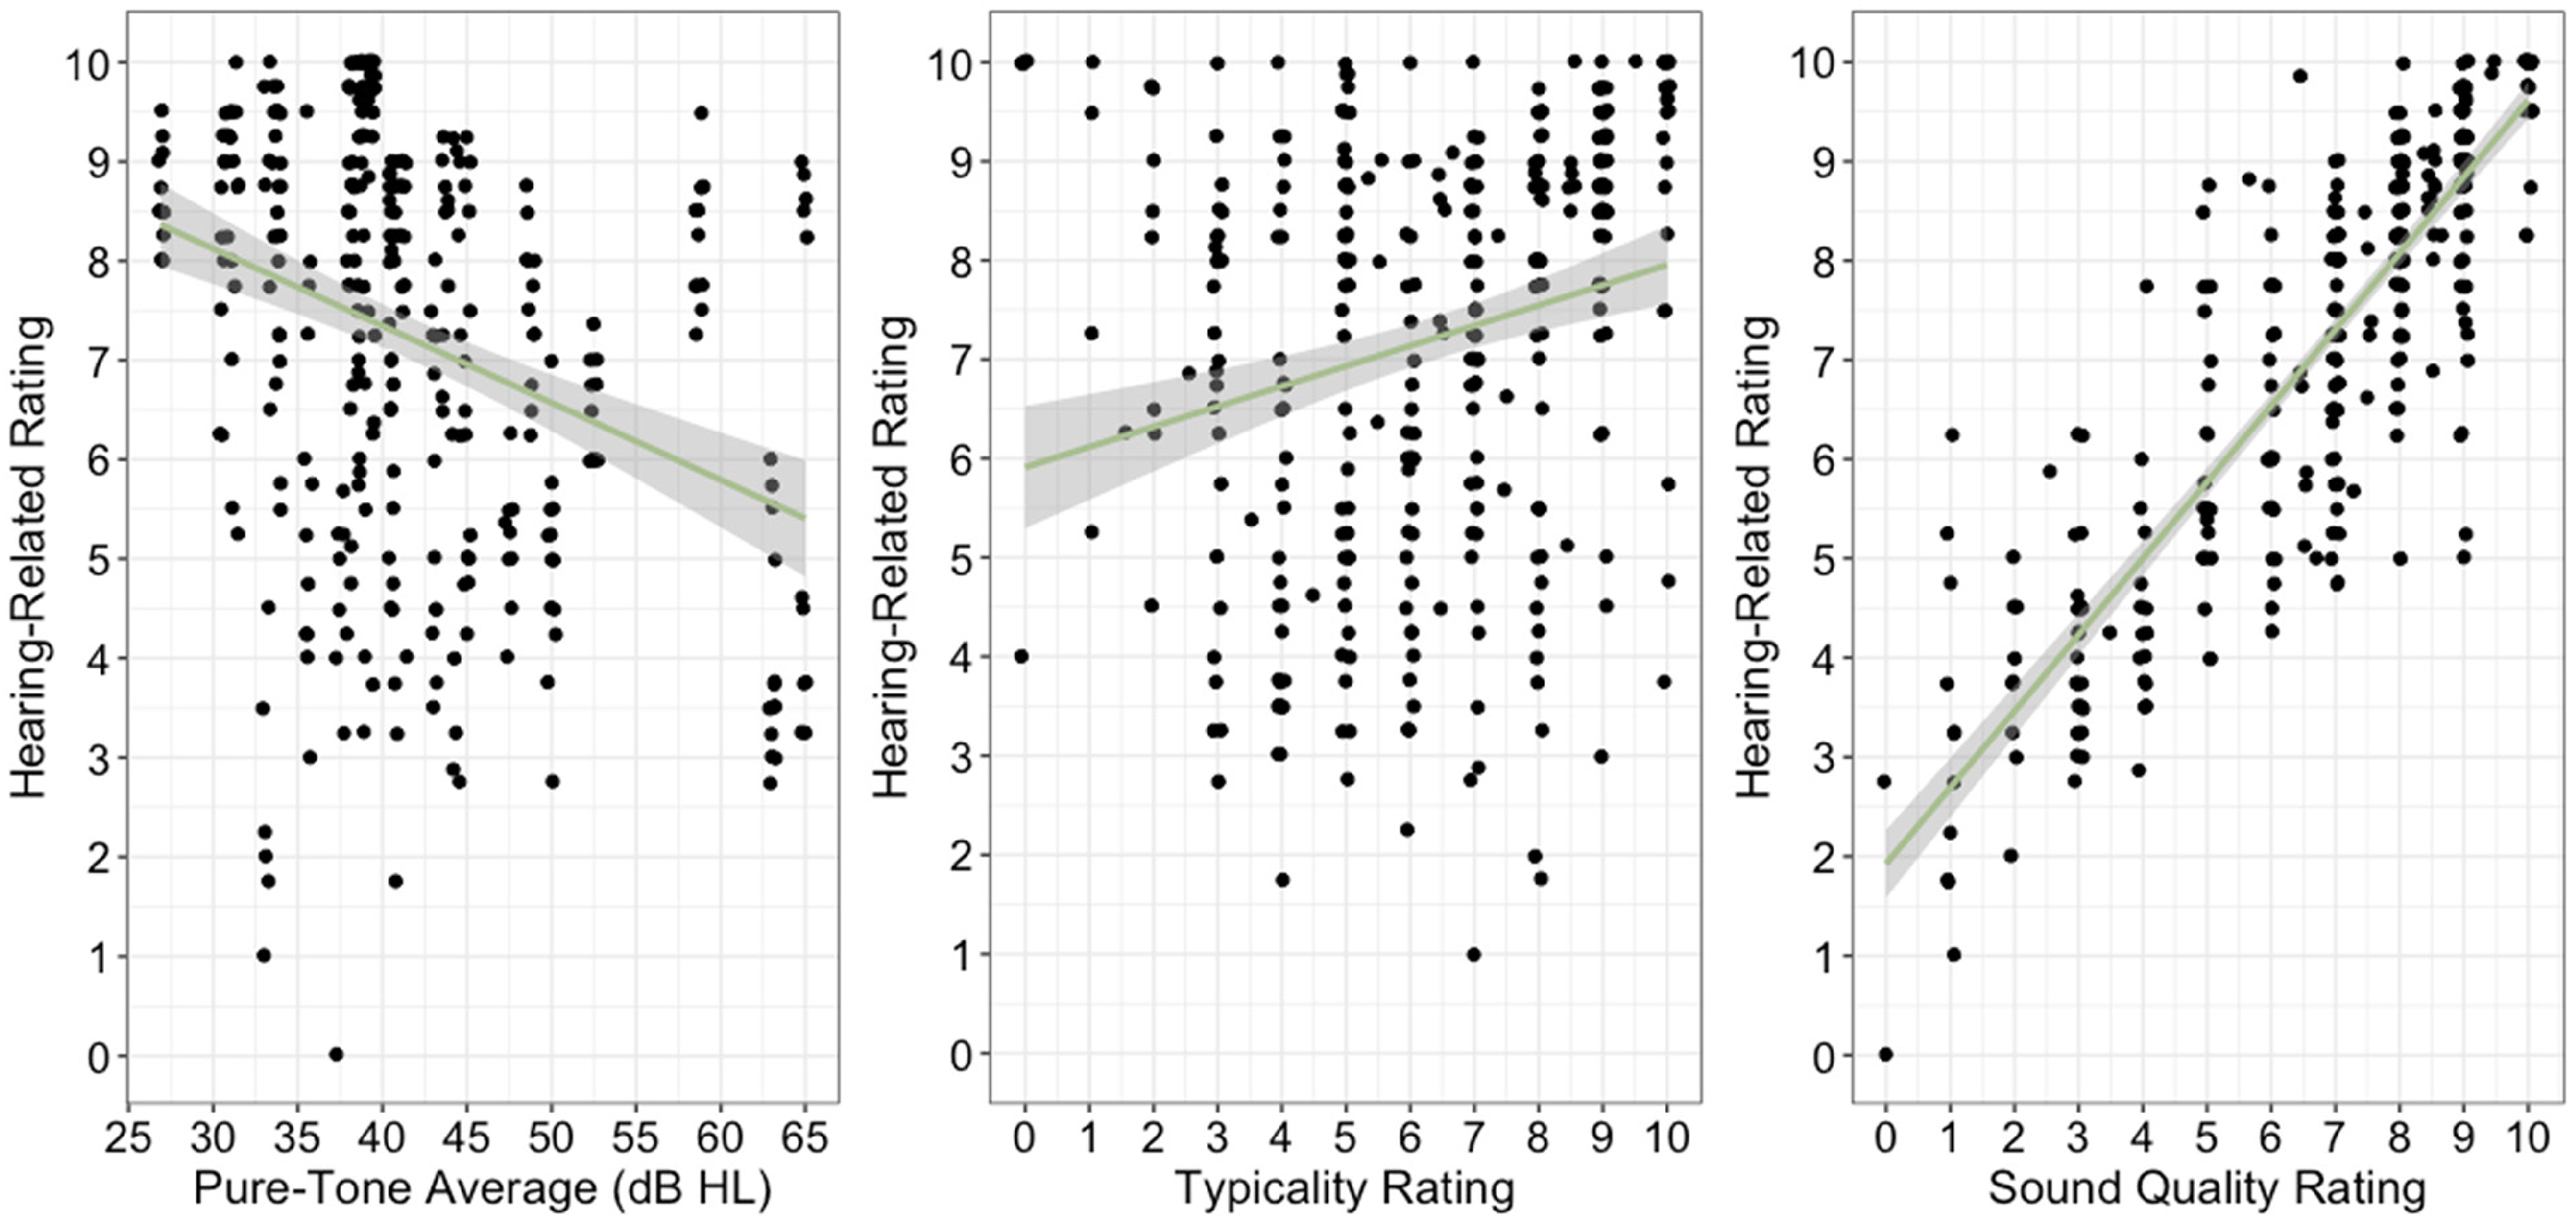
Mean hearing-related scores as a function of four-frequency pure-tone average (in dB HL; left panel), ratings of typicality (middle panel), and sound quality rating (right panel).
Final Model of Ratings of Hearing-Related Ability.

Note: See Supplemental Digital Content 4 for details about model construction. Key: p-values for fixed effects calculated using Satterthwaites approximations. Confidence Intervals have been calculated using the Wald method. CI = confidence interval; SE = standard error; St Coefficient = standardized coefficient; df = degrees of freedom.
Model equation: Rating of hearing ∼ (0 + program|participant) + scale(mean.four.pta) + scale(typical rating) + scale(sound quality rating).
Daily Mood
Mood survey subscale construction was verified using internal reliability evaluation (Cronbach's a) with the
The final model of ratings of mood is displayed in Table 4; the model construction details are provided in Supplemental Digital Content 5. In brief, the results indicate that ratings of mood depended on the subscale, ratings of typicality, ratings of sound quality, and the interaction between Program and Consistency. Follow-up analysis revealed that ratings of fatigue (M = 16.4, SE = 0.51, 95% CI: 15.33 to 17.4) were higher than ratings of esteem-related affect (M = 14.1, SE = 0.57, 95% CI: 12.9 to 15.2; t = 5.63, p < .0001) or ratings of vigor (M = 10.1, E = 0.81, 95% CI: 8.49 to 11.8; t = 9.26, p < .0001). Ratings of esteem-related affect were also higher than were ratings of vigor (t = 5.36, p < .0001). Because of the reverse scoring of the fatigue scale, these results indicate that ratings of mood were better in the fatigue subscale than the esteem-related affect or vigor subscales. The results also indicated an effect of typicality (scaled estimate = 0.22, SE = 0.07), indicating that ratings of mood were higher on days that participants rated as more typical.
Final Model of Ratings of Mood.

Note: See Supplemental Digital Content 5 for details about model construction. Key: p-values for fixed effects calculated using Satterthwaites approximations. Confidence Intervals have been calculated using the Wald method. CI = confidence interval; SE = standard error; St Coefficient = standardized coefficient; df = degrees of freedom.
Model equation: mood rating ∼ (0 + program|participant) + (0 + subscale|participant) + subscale + scale(typical) + scale(sound quality) + program*consistency.
Crucially, the results support the relationship between sound quality and mood in two ways. First, ratings of mood were significantly related to ratings of sound quality (scaled estimate = 0.54, SE = 0.09), as displayed in Figure 4, with higher ratings of mood when sound quality was rated highly. Second, ratings of mood were better when participants were using the Good Program during the home trial, although this was only true for participants whose preferences were consistent between the laboratory and the field trial (see Figure 5). Specifically, follow-up analyses of the significant program by consistency interaction revealed that ratings of mood were higher in the Good program (estimated marginal mean = 14.3, SE = 0.68, 95% CI: 12.9 to 15.6) than in the Tolerable program (estimated marginal mean = 13.3, SE = 0.66, 95% CI: 12.0 to 14.7; t = 3.57, p = .001) for participants with consistent preferences only. For participants with inconsistent preferences, ratings of mood were not significantly different between the Good (estimated marginal mean = 13.0, SE = 0.88, 95% CI: 11.3 to 14.8) and Tolerable programs (estimated marginal mean = 13.5, SE = 0.85, 95% CI: 11.7 to 15.2; t = 1.13, p = .267).
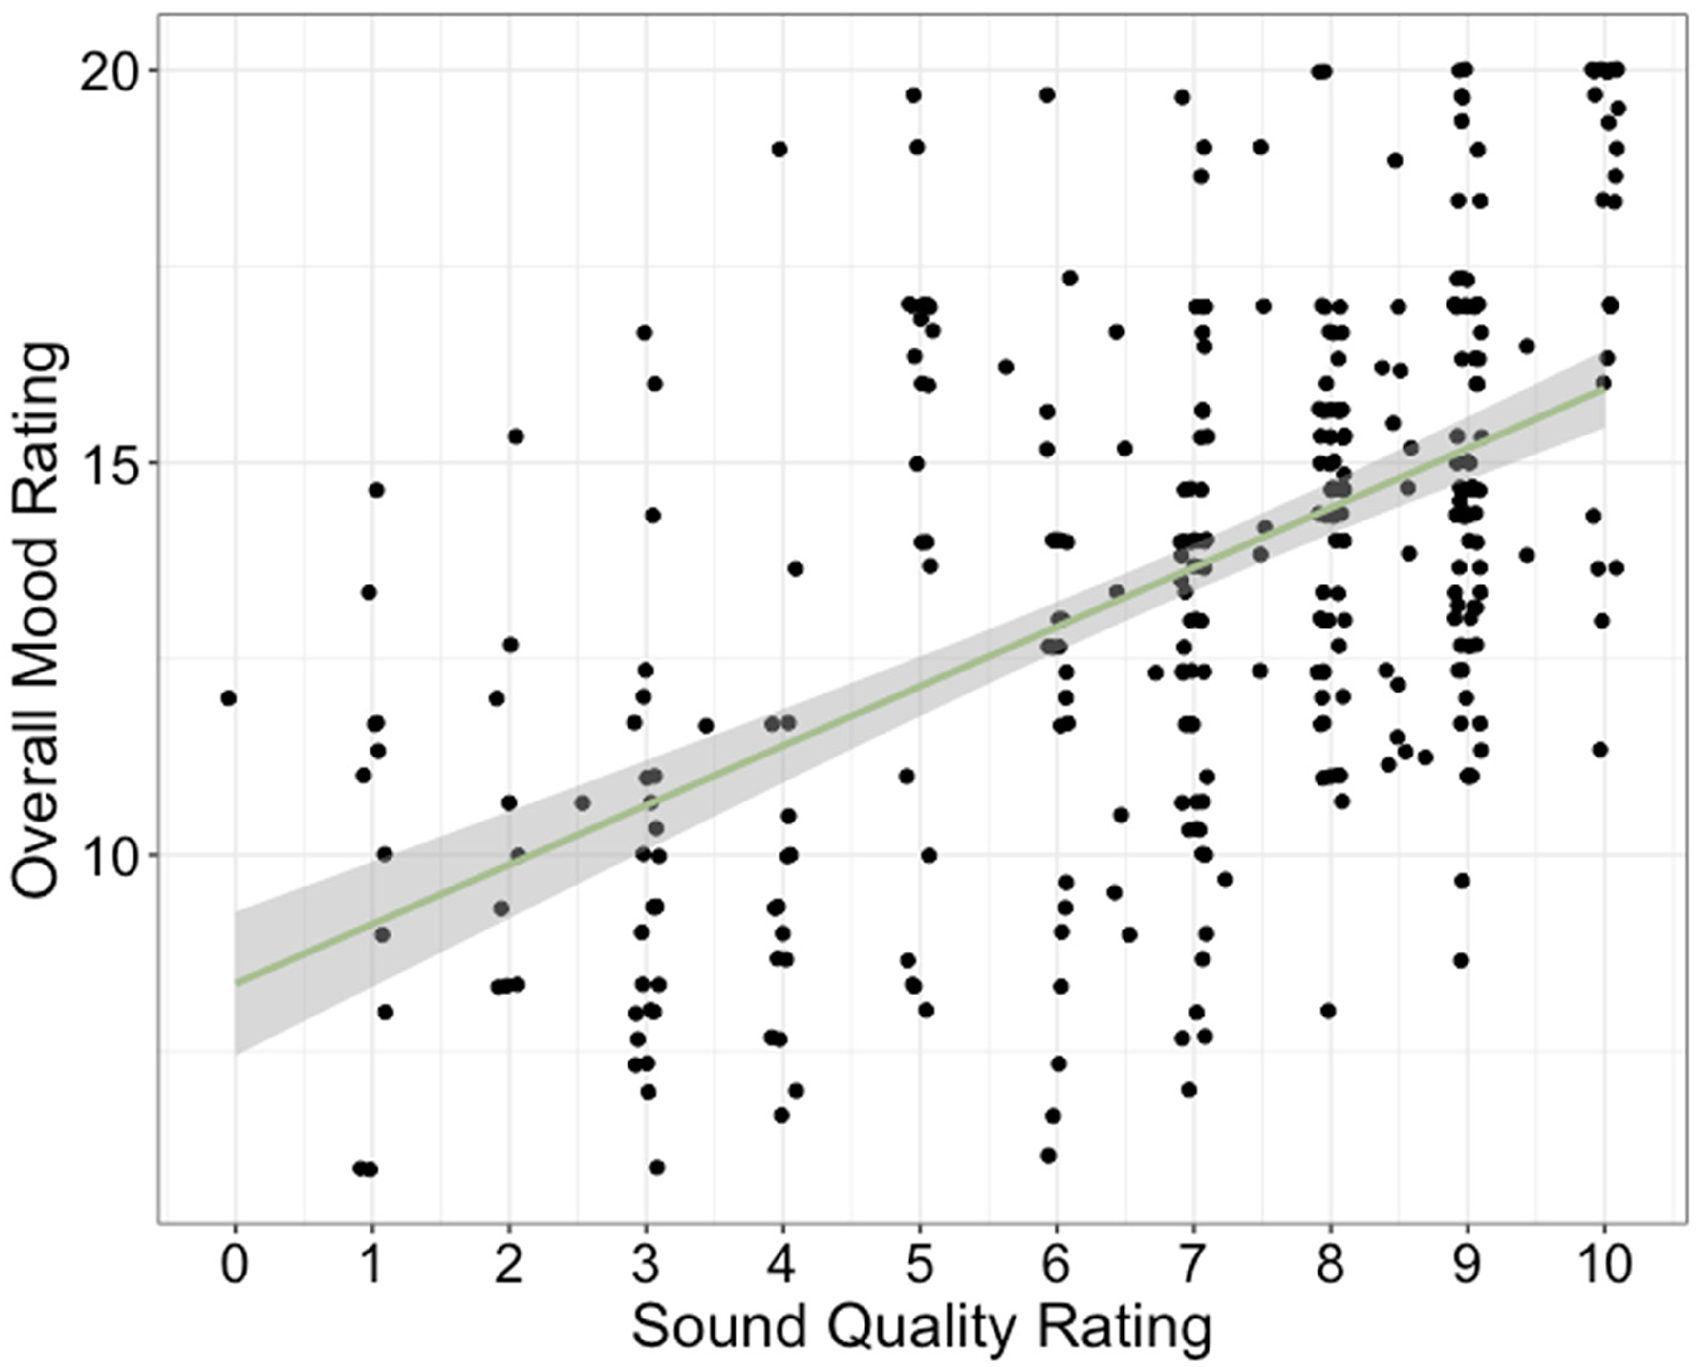
Ratings of mood as a function of ratings of sound quality. Data points represent individual participants on individual days during the two field trials. Line indicates best-fitting, simple regression line.
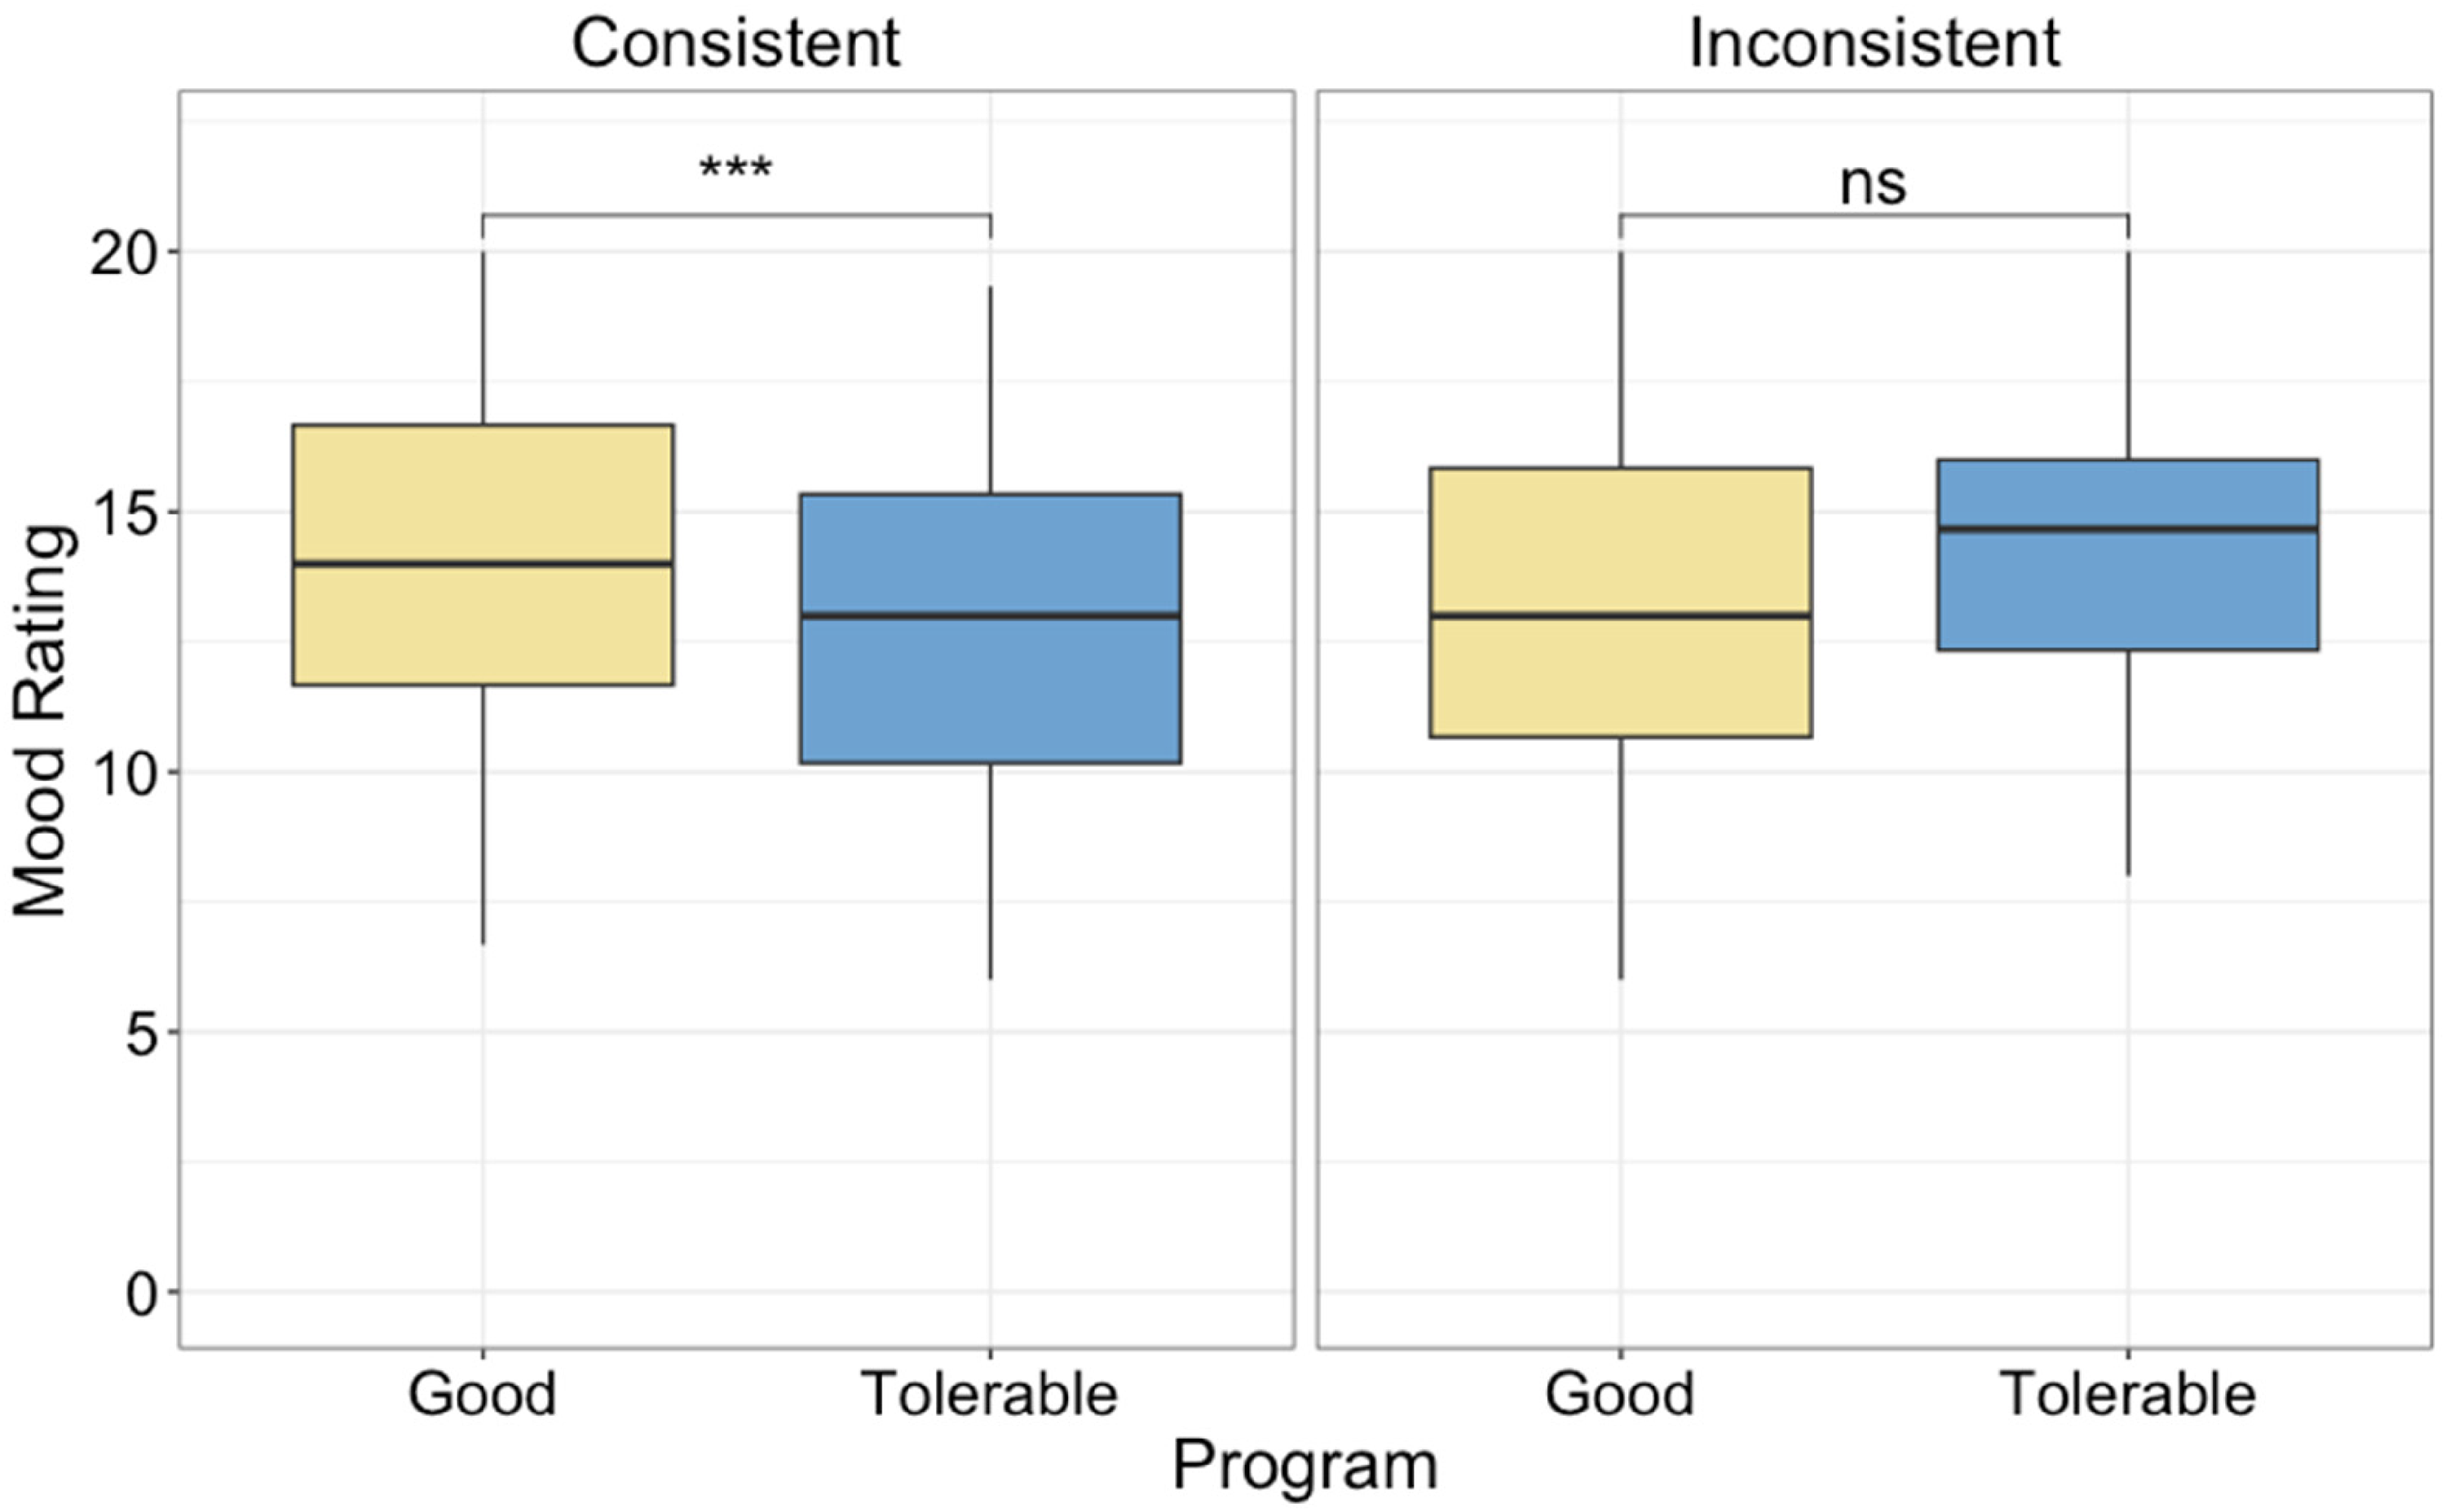
Ratings of mood, averaged across subscale, in each program for participants with consistent and inconsistent preferences between lab and home (left and right panels, respectively). Significant differences are indicated by asterisks. Note: *** indicates p < .001, ns indicates not statistically significant.
Listening-Related Fatigue
Data from one participant (an 80-year-old male) in the Tolerable program was missing due to a technical error. Analysis results of the remaining retrospective ratings of listening-related fatigue are displayed in Table 5 (model development is detailed in Supplemental Digital Content 6). In brief, the Program by Consistency interaction was significant, as displayed in Figure 6. Follow-up analyses of the interaction revealed that ratings of fatigue were lower (better) following a week in the Good Program (estimated marginal mean = 7.58, SE = 1.50, 95% CI: 4.59 to 10.6) than the Tolerable Program (estimated marginal mean = 11.63, SE = 1.50, 95% CI: 8.64 to 14.6; t = 2.23, p = .033) for participants with consistent preferences. However, fatigue was not significantly different for the participants with inconsistent preferences. Instead, there was a trend for ratings of fatigue to be higher (worse) following a week in the Good Program (estimated marginal mean = 11.64, SE = 1.97, 95% CI: 7.70 to 15.6) than the Tolerable Program (estimated marginal mean = 6.99, SE = 2.06, 95% CI: 2.87 to 11.1; t = 1.88, p = .069) for people with inconsistent preferences. These data demonstrate that the Good Program reduced listening-related fatigue by approximately 4 points (on a 40-point scale) for participants who preferred their Good program during the home trial (i.e., had consistent preferences). For participants with inconsistent preferences, the differences did not reach statistical significance, but they tended to demonstrate less fatigue in the Tolerable Program (the one they preferred at home).

Long-term listening-related fatigue measured after each field trial for participants whose hearing aid preferences were consistent (left panel) and inconsistent (right panel) between the laboratory and home trials. Note: * indicates significance at p < .05, ns indicates not statistically significant difference between programs.
Final Model of Ratings of Listening-Related Fatigue.

Note: See Supplemental Digital Content 6 for details about model construction. Key: p-values for fixed effects calculated using Satterthwaites approximations. Confidence Intervals have been calculated using the Wald method. CI = confidence interval; SE = standard error; St Coefficient = standardized coefficient; df = degrees of freedom.
Model equation: rating of hearing ∼ (0 + program|participant) + scale(mean.four.pta) + scale(typical rating) + scale(sound quality rating).
Discussion
The purpose of this study was to evaluate the effect of hearing aid sound quality on ratings of mood (esteem-related affect, vigor, and fatigue), listening-related fatigue, and hearing-related experiences (speech intelligibility, perceived disability, participation, concentration). The role of sound quality was evaluated in two ways: (1) by examining the relationship between daily sound quality ratings and ratings of mood and hearing-related experiences during a field trial and (2) by directly manipulating sound quality in hearing aid settings. To manipulate sound quality, participants self-adjusted their hearing aid gain to create settings that optimized sound quality (Good Program) or had a tolerable sound quality (Tolerable Program) and then wore the hearing aids home for a week in each setting (blinded to the program). The results of the study demonstrated that at the end of each day during the approximately week-long field trial, ratings of sound quality were significantly positively correlated with mood (esteem, vigor, and fatigue) and hearing-related experiences. In addition, ratings of mood daily and also listening-related fatigue were better when participants used the Good Program, but only for participants who preferred their Good Program during the home trial (i.e., laboratory and field trial preferences were consistent). There were no such benefits of hearing aid settings for participants who did not prefer the Good Program during the field trial (i.e., they had inconsistent perceptions of the Good Program at home and in the laboratory). Combined, the study demonstrates the potential for good hearing aid sound quality to improve ratings of mood, hearing-related experiences, and listening-related fatigue.
Optimizing Sound Quality
Interestingly, the task of defining “good” hearing aid sound quality was not straightforward for all study participants. The original intention was to create Good and Tolerable programs in the laboratory and to use only those assignments in the analysis of ratings of mood, hearing-related experiences, and listening-related fatigue. However, inspection of the qualitative feedback provided by participants (see Supplemental Digital Content 2) revealed that approximately one-third of participants (11 of 30) did not prefer their own laboratory-set “good” programs when they were at home. Therefore, the conclusion that hearing aid sound quality affects mood is supported by the data, but it is not clear if there were different gain settings that would be even better in terms of sound quality, given participants’ inconsistency in sound quality preferences. The somewhat unreliable nature of participant hearing aid setting preferences for these 11 participants is surprising, given the reported stability and reliability of user-adjusted preferences noted in the literature (Dreschler et al., 2008; Gößwein et al., 2023; Keidser et al., 2005; Moore et al., 2005; Nelson et al., 2018).
The results also indicate an effect of the program for the consistent participants over and above the effect of sound quality ratings, with both variables (sound quality ratings and program) being significantly related to mood ratings. The reasons for this are difficult to pinpoint, but it might be that the sound quality ratings do not capture the full sound quality experience of the programs. The fact that there was no effect of the program on ratings of hearing-related experiences indicates that the program effect on mood ratings is not likely to be driven by those hearing-related experiences.
Further studies are required to streamline the process of optimizing sound quality for participants, and to explore the unreliableness of the preferences observed in this study. Importantly, the good and the tolerable programs in the current study were not predictable based on a pattern of deviation from the prescriptive fitting (see Figure 2) or on obvious participant demographics (see Table 1). Therefore, no specific gain configuration could have been recommended for all participants. Instead, the participants benefited from the experiences at home in that the preference for the Tolerable program did not become obvious until the participants had used the laboratory-programed hearing aids in their home environments.
Hearing-Related Experiences
The results of the current study demonstrate that ratings of hearing-related experiences (speech intelligibility, perceived disability, participation, and concentration) did not differ by hearing aid (Good Program mean = 7.4, Tolerable Program mean = 7.1, both on a scale of 0 to 10). This finding is consistent with other evidence from the current study demonstrating the two hearing aid programs resulted in similar speech intelligibility performance (QuickSIN score differences < 0.5 dB). Instead, ratings of hearing-related experiences were related to day typicality, degree of hearing loss, and ratings of sound quality. Participants rated their hearing experiences as better on days that were more typical and on days when they felt their hearing aids had better sound quality. In addition, participants with more significant hearing loss had lower hearing experience ratings, consistent with previous work demonstrating the importance of hearing acuity on perceived hearing abilities (e.g., Fitzgerald et al., 2024). The results of the current study suggest that sound quality and day typicality are additional potentially important variables that could also explain daily perceived hearing experiences in the real world. However, the questions used in the current study were bespoke, so additional work is warranted to replicate the findings. Importantly, the findings also suggest that the program sound quality manipulation did not affect hearing abilities (subjective or behavioral) and thus any differences between programs on ratings of mood are distinct from hearing experiences.
Listening-Related Fatigue
Ratings of retrospective listening-related fatigue were lower (better) with the Good than the Tolerable Program, but only for the 19 participants with consistent preferences. The 11 participants with inconsistent preferences did not have significantly different ratings of listening-related fatigue in the Good and Tolerable Programs. The finding that a majority of participants (63%, n = 19 of 30) were able to adjust the sound quality of their hearing aid gain settings in a manner that reduced listening-related fatigue is remarkable. Previous evidence has been somewhat mixed for the benefits of hearing aids for reducing listening-related fatigue (Davis et al., 2021; Holman et al., 2021b). Therefore, it is somewhat surprising that rather subtle changes in gain can be beneficial for listening-related fatigue. Indeed, the benefits noted in this study (∼4 points on a 40-point scale; 10 percentage point change) comparing Good and Tolerable Programs within a group of established hearing aid users are strikingly similar to the hearing aid benefits (unaided versus aided) for listening-related fatigue (0.47 points on a 4-point scale; 10 percentage point change) reported in first-time hearing aid users by Holman et al. (2021b). This suggests that finding the best sound quality for a patient could be as beneficial as providing hearing aids in general (relative to unaided listening).
Interestingly, the participants with inconsistent preferences did not demonstrate a similar benefit of the Good Program, which stands to reason given their change in preference. Instead, there was a trend for their fatigue to be lower (better) in the Tolerable program (∼5-point difference that did not reach statistical significance; p = .07). It is not clear what caused them to prefer the alternative program. Given the similar subjective and behavioral measures of hearing performance, it seems unlikely that differences in speech intelligibility between the Good and Tolerable programs could have affected their listening-related fatigue. Instead, it could be that they were more fatigued during that week for reasons not captured in this study, which resulted in them not preferring the program they were using that week.
It is also possible that the gain they set in the laboratory was ultimately not appropriate for them at home. That is, even though the average hearing aid response in the Good Program was similar to output prescribed by NAL-NL2 prescriptive fitting formula (on average as displayed in Figure 2 and for individual participants as displayed in Supplemental Digital Content 3), it is possible that this is not the optimal gain configuration for these 11 participants. As a result, the sound quality was actually not good for them at home, which negatively affected their listening-related fatigue over the course of the week. This explanation would be consistent with other work demonstrating that preferred hearing aid gain for some participants can be quite different from NAL-NL2 prescriptions and predicting preferences based on individual participant factors can be difficult (Perry et al., 2019). The reasons for the inconsistent preferences (between home and the laboratory), in addition to the direction of the relationship between hearing aid preference and listening-related fatigue, warrant further investigation.
Mood
Participants’ consistency of hearing aid setting preferences between the laboratory and home trials was also influential in the ratings of mood at the end of each day. Mood (described here as a combination of esteem-related affect, vigor, and fatigue) was better for participants in the Good program than in the Tolerable program, but only for those participants with consistent preferences. For those with inconsistent preferences, the trend was towards ratings of mood being better with their Tolerable program—as we would expect given the change in preference—but the difference between programs was not statistically significant for this group. As with listening-related fatigue, it is not clear if the gain adjustments were not appropriate for them at home or if their mood was lower during the week with the Good program, which resulted in them not preferring that program. The role of self-adjusted gain to optimize sound quality and the direct effect on ratings of mood therefore needs further investigation.
What is clear is that ratings of mood were significantly related to ratings of sound quality, even though the program adjustments were not successful for all participants. This relationship is a more direct finding linking sound quality to ratings of mood. Of course, the correlation does not indicate causality. It is plausible that ratings of sound quality could affect mood, but it remains possible that mood could affect ratings of sound quality. However, the finding that most participants in a blinded home trial, had better ratings of mood in their self-adjusted Good Program strengthens the possibility that sound quality improved mood.
Previously, Holman et al. (2021b) reported hearing aid benefits for listening-related fatigue, but not the mood-state of general fatigue, in first-time hearing aid users. The current study demonstrates that sound quality is important to both listening-related fatigue (via the VFS-10-A) and also general fatigue (via the POMS). It is possible differences between this study and the study of Holman and colleagues are attributable to methodological differences. For example, the current study included daily ratings of fatigue, whereas Holman and colleagues collected retrospective ratings of fatigue after 3 months of hearing aid use. In addition, given the importance of sound quality in the current study, it is possible the benefits of hearing aids reported by Holman and colleagues would also be evident for general fatigue, if they included a sound quality individualization procedure, rather than relying on fitting to prescriptive targets for all participants.
It is also the case that Holman et al. (2021b) did find hearing aid benefits for vigor, even in the absence of benefits for general fatigue. In the current study, benefits were evident for both fatigue and vigor, in addition to esteem-related affect. Because of the limited data available in the literature for esteem-related affect and hearing loss or hearing aids, it is difficult to compare the effects in the current study to previous work investigating positive aspects of mood. However, the current results clearly support the importance of sound quality for mood.
Limitations and Future Directions
An important limitation of the current study is that the data offer little in the way of mechanistic explanations. It could be that sound quality is important for mood from a sensory perspective. There is a relationship between positive sensory experiences and mood, where mood can be improved with pleasant sensory experiences with light (Basishvili et al., 2019; Borisuit et al., 2015), temperature and humidity (Bergefurt et al., 2022), and even clothing on the body (Kang et al., 2013; Moody et al., 2010). It might be expected then that, in the current study, positive sensory experiences in sound quality improved mood.
It is also possible that improved hearing-related experiences (speech intelligibility, perceived disability, participation, concentration) resulted in improved mood by way of increased social participation. Social activities play a critical role in mood (Brandstätter, 1983; Liu et al., 2019; Peterson et al., 2021) Holman et al. (2021b) reported hearing aids improved both social participation and vigor. Therefore, it could be the improved sound quality improved perceived hearing experiences, which encouraged social participation, and improved mood. However, the current study did not include an evaluation of social participation, so it is not clear if sound quality also affected social activities. Moreover, the minor gain differences between the programs makes it unlikely that the preferred program would markedly improve the objective ability to participate, although the subjectively better experiences may support social participation. Future work is warranted to explore mechanistic explanations for the relationship between sound quality and mood.
Another potential study limitation is that participants were recruited specifically if they reported sound quality was important to them. For most participants, sound quality was important for communicating with others. However, it is not clear how the results of this study would generalize to a less discerning population of adult hearing aid users, some of whom might not judge sound quality to be important. Indeed, three of the participants in the current study were excluded because they could not hear the difference between their preferred and non-preferred programs in a blinded laboratory task. It is not clear if the individualization process would be helpful for improving sound quality and mood for all hearing aid users. However, the fact that participants indicate that sound quality is important for broad and functional reasons of communication (see Supplemental Digital Content 1) indicates that the results may also generalize beyond this subset of the population.
Conclusions
Moods are transient affective states without distinct specific causes. They play an important role in general well-being, coloring the interpretation of life's events. The results of this study demonstrate that hearing aid sound quality was significantly and positively correlated with ratings of mood during a home trial. In addition, the difference between Good and Tolerable hearing aid programs significantly influenced mood at the end of the day for participants who did not change their preference during the home trial. Good hearing aid sound quality also resulted in lower listening-related fatigue. On average, the Good sound quality program was similar to existing validated prescriptive output targets; the Tolerable sound quality program had lower output, although the differences between the tolerable and good programs were generally small (3–5 dB across 1,000–4,000 Hz). These small differences in gain had no statistically significant effect on subjective hearing experience ratings or on behavioral measures of speech-in-noise understanding. Therefore, the benefits of good sound quality for mood and listening-related fatigue are likely not driven by hearing performance. However, approximately one-third of participants did not prefer during the home trial the hearing aid program with lab-set good sound quality. They also did not demonstrate benefits of sound quality program on mood or retrospective listening-related fatigue. Future work is warranted to investigate how to optimize hearing aid fittings to maximize sound quality at home for all patients, such as ensuring patients have the opportunity to modify their hearing aid sound quality at home (e.g., with an app) if they discover their settings are not optimal. This optimization process is important, and potentially worthwhile clinically, because good sound quality was related to a range of important, real-life benefits including better perceived hearing experiences (speech intelligibility, perceived disability, participation, concentration), reduced listening-related fatigue, and improved mood (esteem-related affect, vigor, and fatigue).
Supplemental Material
sj-docx-1-tia-10.1177_23312165261431922 - Supplemental material for Optimizing Sound Quality Improves Hearing Aid Users’ Moods and Listening-Related Fatigue
Supplemental material, sj-docx-1-tia-10.1177_23312165261431922 for Optimizing Sound Quality Improves Hearing Aid Users’ Moods and Listening-Related Fatigue by Erin M. Picou, Laura W. Balling, Taylor Dalzell, Kjersten Branscome and Eric Branda in Trends in Hearing
Supplemental Material
sj-docx-2-tia-10.1177_23312165261431922 - Supplemental material for Optimizing Sound Quality Improves Hearing Aid Users’ Moods and Listening-Related Fatigue
Supplemental material, sj-docx-2-tia-10.1177_23312165261431922 for Optimizing Sound Quality Improves Hearing Aid Users’ Moods and Listening-Related Fatigue by Erin M. Picou, Laura W. Balling, Taylor Dalzell, Kjersten Branscome and Eric Branda in Trends in Hearing
Supplemental Material
sj-docx-3-tia-10.1177_23312165261431922 - Supplemental material for Optimizing Sound Quality Improves Hearing Aid Users’ Moods and Listening-Related Fatigue
Supplemental material, sj-docx-3-tia-10.1177_23312165261431922 for Optimizing Sound Quality Improves Hearing Aid Users’ Moods and Listening-Related Fatigue by Erin M. Picou, Laura W. Balling, Taylor Dalzell, Kjersten Branscome and Eric Branda in Trends in Hearing
Supplemental Material
sj-docx-4-tia-10.1177_23312165261431922 - Supplemental material for Optimizing Sound Quality Improves Hearing Aid Users’ Moods and Listening-Related Fatigue
Supplemental material, sj-docx-4-tia-10.1177_23312165261431922 for Optimizing Sound Quality Improves Hearing Aid Users’ Moods and Listening-Related Fatigue by Erin M. Picou, Laura W. Balling, Taylor Dalzell, Kjersten Branscome and Eric Branda in Trends in Hearing
Supplemental Material
sj-xlsx-5-tia-10.1177_23312165261431922 - Supplemental material for Optimizing Sound Quality Improves Hearing Aid Users’ Moods and Listening-Related Fatigue
Supplemental material, sj-xlsx-5-tia-10.1177_23312165261431922 for Optimizing Sound Quality Improves Hearing Aid Users’ Moods and Listening-Related Fatigue by Erin M. Picou, Laura W. Balling, Taylor Dalzell, Kjersten Branscome and Eric Branda in Trends in Hearing
Supplemental Material
sj-xlsx-6-tia-10.1177_23312165261431922 - Supplemental material for Optimizing Sound Quality Improves Hearing Aid Users’ Moods and Listening-Related Fatigue
Supplemental material, sj-xlsx-6-tia-10.1177_23312165261431922 for Optimizing Sound Quality Improves Hearing Aid Users’ Moods and Listening-Related Fatigue by Erin M. Picou, Laura W. Balling, Taylor Dalzell, Kjersten Branscome and Eric Branda in Trends in Hearing
Footnotes
Authors’ Note
Portions of this project were presented at the annual scientific and technical conference of the American Auditory Society (2025, Scottsdale, AZ) and the American Academy of Audiology (2025, New Orleans, LA). Eric Branda is also affiliated with the WS Audiology, Iselin, New Jersey.
Ethical Approval
Study procedures were conducted with approval from Vanderbilt University Medical Center's Institutional Review Board (#230390)
Consent to Participate
Participants provided informed written consent.
Consent for Publication
Not applicable.
Funding
The authors disclosed receipt of the following financial support for the research, authorship, and/or publication of this article: This work was supported by WS Audiology. Support for RedCap was from The Vanderbilt Institute for Clinical and Translational Research (VICTR), which is funded by the National Center for Advancing Translational Sciences (NCATS) Clinical Translational Science Award (CTSA) Program, Award Number 5UL1TR002243-03. The content is solely the responsibility of the authors and does not necessarily represent the official views of the NIH.
Declaration of Conflicting Interests
The authors declared the following potential conflicts of interest with respect to the research, authorship, and/or publication of this article: LWB and EB are employed by WS Audiology.
Supplemental Material
Supplemental material for this article is available online.