
Abstract
Frequency lowering technologies offer an alternative amplification solution for severe to profound high frequency hearing losses. While frequency lowering technologies may improve audibility of high frequency sounds, the very nature of this processing can affect the perceived sound quality. This article reports the results from two studies that investigated the impact of a nonlinear frequency compression (NFC) algorithm on perceived sound quality. In the first study, the cutoff frequency and compression ratio parameters of the NFC algorithm were varied, and their effect on the speech quality was measured subjectively with 12 normal hearing adults, 12 normal hearing children, 13 hearing impaired adults, and 9 hearing impaired children. In the second study, 12 normal hearing and 8 hearing impaired adult listeners rated the quality of speech in quiet, speech in noise, and music after processing with a different set of NFC parameters. Results showed that the cutoff frequency parameter had more impact on sound quality ratings than the compression ratio, and that the hearing impaired adults were more tolerant to increased frequency compression than normal hearing adults. No statistically significant differences were found in the sound quality ratings of speech-in-noise and music stimuli processed through various NFC settings by hearing impaired listeners. These findings suggest that there may be an acceptable range of NFC settings for hearing impaired individuals where sound quality is not adversely affected. These results may assist an Audiologist in clinical NFC hearing aid fittings for achieving a balance between high frequency audibility and sound quality.
Hearing aids have recently begun offering frequency lowering as an option within the suite of signal processing types that may be activated and adjusted by the clinician. Frequency lowering moves high frequency energy to lower frequency regions. Simpson (2009) reviews the historical background, concepts and technical details, and experimental evaluations with frequency lowering hearing instruments. A common rationale for the use of frequency lowering is to overcome the limits of either the bandwidth of the device or the functional bandwidth of the ear, by lowering high frequency energy to a region that is more likely to provide and/or benefit from audible sound. Commercially available types of frequency lowering signal processing include frequency transposition (Widex), nonlinear frequency compression (Phonak), and frequency translation (Starkey). These processors are commercially labelled as Audibility Extender, SoundRecover, and SpectralIQ, respectively. In this article, we investigate the effects of one of these processors (nonlinear frequency compression) on perceived sound quality of speech, speech in noise, and music in normal hearing (NH) and hearing impaired listeners (HI).
In nonlinear frequency compression (NFC), the entire frequency axis is divided into two regions, and only those frequencies that fall above the cutoff frequency (CF) are compressed (Simpson, Hersbach, & McDermott, 2005). The input/output frequency relationship is described by Equation 1,

where Fin is the input frequency, Fout is the output frequency, and CR is the compression ratio. Using the two channel NFC device, Simpson et al. (2005) conducted speech recognition experiments in quiet with 17 adults with mostly moderate-to-severe hearing losses. A significant increase in the speech recognition performance was observed for 8 of the 17 participants with the NFC device. A follow-up study repeated the experiment with listeners with steeply sloping audiograms (Simpson, Hersbach, & McDermott, 2006). In this study, no significant benefit in performance was demonstrated in group mean scores between the NFC and the conventional hearing aid. Other studies have investigated the effects of a similar processor in both adults and children (Bohnert, Nyffeler, & Keilmann, 2010; Glista et al., 2009; Wolfe et al., 2010, 2011). Benefits measured across these studies vary with the type of outcome measure, age group, and hearing loss configuration. Specifically, Glista et al. (2009), found stronger candidacy for NFC for children, when compared to adults, and an increase in potential benefits as high frequency hearing threshold levels increased. Wolfe et al. (2011) report aided nonsense syllable speech recognition thresholds in quiet and speech recognition in noise as being significantly better after 6 months of NFC use. In a recent study, Glista, Scollie, and Sulkers (2012) evaluated individual acclimatization trends in older children, illustrating individual variation in acclimatization patterns to NFC, both in magnitude and time course of acclimatization (Glista et al., 2012). In summary, NFC appears to carry significant potential for benefit at least for hearing aid users who receive restricted audibility and/or benefit without frequency lowering.
While the central focus of the literature on the efficacy of frequency lowering technologies has been on speech recognition, there is also a need to investigate impacts on perceived sound quality. Previous studies have noted adverse sound quality effects. Sakamoto and colleagues reported that a substantial number of the adult participants in their study described frequency-compressed signals as “noisy,” “reverberant,” and “strange” (Sakamoto, Goto, Tateno, & Kaga, 2000). Simpson et al. (2006) stated that 6 out of the 7 participants preferred the sound quality of the conventional hearing aid to that of the frequency compression device. Glista et al. (2009) reported fine tuning of the NFC parameters was required to reduce “perceived slurring.” Bohnert et al. (2010) stated that most participants reported unnaturalness of fricatives, and 3 out of 11 participants preferred the quality of conventional amplification. The only study without report of adverse sound quality outcomes (Wolfe et al., 2010) tested children with moderate to moderately severe hearing losses, which were less severe than the losses of participants in most of the other studies. It is therefore possible that the milder settings of frequency compression used by Wolfe et al. (2010) produced a higher sound quality. It is also possible that the children included in this study were less likely to report or less likely to notice any sound quality degradation produced by the processing, as this was not the focus of the study.
Electroacoustic analysis of frequency-compressed speech may provide some insight into the above-noted effects on sound quality. Figure 1 illustrates the effect of frequency compression on speech. Panel “a” shows the spectrogram of the original, unprocessed speech sample. Panels “b to d” show the spectrograms when processed through a nonlinear frequency compression device with a CR of 2:1 and CFs of 4000, 3000, and 2000 Hz respectively. As the CF is lowered, a broad high frequency input band is output as a narrower band. While this process may improve the audibility of previously unheard high frequency sounds, it clearly disrupts the spectral relationships and formant variations in the high frequency regions, with potential concomitant impact on sound quality. Put differently, the stronger the frequency compression setting, the more likely that sound quality will be affected.

Narrowband spectrograms of a speech stimulus “Would you please give us the facts? She arrived home early that night” spoken by a female talker that was processed through different frequency compression settings.
In summary, NFC can deliver high frequency speech energy at a lower frequency. For some listeners and tasks, this type of processing has been shown to provide benefit in both adult and child listeners. The improvement in speech sound detection and/or recognition due to this processing may also be accompanied by perceived degradation in sound quality for some listeners. Currently, there are no data in the literature illustrating the extent to which sound quality is impacted by choosing different frequency compression parameters. Previous research suggests that children may more readily benefit from NFC when compared to adult listeners (Glista et al., 2009). For this reason, and because little data exist on children’s ratings of sound quality, it is also important to consider whether sound quality perception varies by age group. We address these issues through two studies that investigate the following research questions:
Research Question 1: How do the ratings of speech quality change as a function of variations to CF and CR in the NFC device?
Research Question 2: Is there any difference in the perception of the quality of frequency-compressed speech between groups of adults and children with NH and aided HI?
Research Question 3: Do quality ratings of frequency-compressed speech by NH and HI listeners change in the presence of noise? and
Research Question 4: Do frequency compression parameters affect the sound quality of music samples as perceived by NH and HI listeners?
Study 1
Materials and Method
Participants
A total of 46 listeners in four groups participated in the first study. The NH listeners were subdivided into two groups by age: 12 adults (ages 21-27 yrs, M = 24 yrs) and 12 children (ages 8-18 yrs, M = 12 yrs). The HI experimental group consisted of 13 adults (ages 50-81 yrs, M = 69 yrs) and 9 children (ages 8-17 yrs, M = 12 yrs). The NH listeners were recruited from the student pool at the University of Western Ontario, and passed a hearing screening at 20 dB HL from 250 through 6000 Hz. The HI listeners were recruited through the in-house clinic and through clinicians external to the university. All of the listeners were also participants in the previously reported studies of frequency compression (Glista et al., 2009), with the exception of two children who were too young to complete the sound quality rating task. All listeners completed the present study prior to real world experience with the frequency compression algorithm. Table I displays the air conduction thresholds for all the HI adult and child participants of this study.
Audiograms of HI Adults and Childrens Who Participated in Study No. 1.

Note. Values indicate hearing acuity in dB HL. Values of 120 dB HL indicate a threshold at or above the audiometer’s limit and DNT indicates a hearing threshold that was not tested.
The hearing devices used in this study included modified Phonak Savia digital BTE hearing aids that allowed NFC signal processing to be activated and adjusted using prototype fitting software. The HI listeners were fitted with individually derived targets using the Desired Sensation Level (DSL) v5.0 method (Bagatto et al., 2005; Scollie et al., 2005). Hearing aid verification was completed using the Audioscan Verifit for speech inputs ranging from 55 to 75 and a swept pure-tone signal at 90 dB SPL. In addition, adjustments were made to fittings to accommodate user preference prior to commencing testing. Final fittings approximated targets to within 5 dB between 250 and 4000 Hz for participants with better-ear, high frequency pure tone average (PTA) values of up to 77 dB HL for the adults and 87 dB HL for the children. Each fitting was checked to ensure that no feedback was generated when worn.
Sound quality rating procedures and stimuli
The speech quality ratings were obtained using the Multiple Stimulus Hidden Reference and Anchors (MUSHRA) paradigm (ITU-R, 2003) using custom software. Figure 2 shows a screenshot of the MUSHRA software. In the MUSHRA paradigm, the experimenter selects a reference stimulus, a range of experimental stimuli, and several anchor stimuli. The reference stimulus is typically unprocessed and provides the listener with an example of high-quality speech. The reference signal is represented in the labeled button on the top left (refer to Figure 2) and is also included within one of the randomized “test stimuli” buttons during testing. The anchor stimuli are typically processed using poor-quality or distorted processing to provide the listener with examples of poor quality speech. The anchor stimuli were randomized within the “test stimuli” buttons. The presence of these hidden anchors and references serve as exemplars of the end points on this scale, allowing the listeners to orient themselves quickly to the rating task, which supports rating in a consistent and reliable manner. The remaining “test stimuli” buttons are randomly allocated to experimental stimuli.

Screenshot of the MUSHRA software used to gather the quality ratings of frequency-compressed speech stimuli.
Stimuli were sentence pairs chosen from the IEEE Harvard sentences and recorded through hearing aids to generate the reference, anchor, and experimental stimuli: (a) “The ramp led up to the wide highway. Beat the dust from the rug onto the lawn.” spoken by a male talker; (b) “Raise the sail and steer the ship northward. The cone costs five cents on Mondays.” spoken by a different male talker; (c) “They could laugh although they were sad. Farmers came in to thresh the oat crop.” spoken by a female talker; and (d) “Would you please give us the facts? He arrived home every other night.” spoken by a different female talker. Hearing aid recordings were made within an anechoic test chamber (B&K 4232) using a 2cc coupler and pressure microphone (B&K 4192). Stimuli were routed to the test chamber’s loudspeaker via a digital to analog converter (USB Pre), a programmable attenuator (TDT PA5) and a power amplifier (Carver PM420) using a 65 dB SPL presentation level. The aided signal at the coupler microphone was preamplified (B&K Nexus) and digitized (USBPre) for storage as a WAV file.
The reference stimulus was recorded with the hearing aid with the NFC option disabled. Two anchor stimuli were created, one added peak clipping to the reference stimulus at 25% of maximum signal amplitude, and the other low pass filtered the reference stimulus at 2000 Hz. The remaining experimental stimuli were recorded through the same hearing aid with NFC enabled and at the following settings: (1) CF = 4000 Hz, CR = 2:1; (2) CF = 2000 Hz, CR = 2:1; (3) CF = 3000 Hz, CR = 2:1; (4) CF = 3000 Hz, CR = 6:1; and (5) CF = 3000 Hz, CR = 10:1. Settings 1 through 3 varied the CF parameter, while settings 3 through 5 varied the CR parameter.
Participants were instructed to listen to the reference stimulus carefully at the start of each paired comparison. They were then asked to listen to each of the test stimuli any number of times and rate the sound quality of the test stimulus in comparison to the reference stimulus and anchor stimuli. They indicated their sound quality ratings for each test stimulus by adjusting the slider below that stimulus button (Figure 2). Participants could replay and rerate until they were satisfied by the relative sound quality ratings of all stimuli. One test condition was repeated to allow evaluation of test-retest reliability (fourth sentence pair, experimental stimulus CF = 2000 Hz, CR = 2:1). Listeners were able complete the entire rating task in approximately 20 min. The software logged scores for each slider position and stimulus, with a possible score range from 20 through 100. A score of 100 for a test stimulus implies excellent sound quality that is indistinguishable from the sound quality of the reference signal.
Listeners were seated within a double walled sound booth, in front of a computer monitor and loudspeaker. They were oriented to zero degrees azimuth and the chair was adjusted in height to align with the loudspeaker. Listeners with NH completed the task while hearing stimuli in the sound field. The HI listeners made sound quality ratings while listening to both the reference and test stimuli as transduced through their individually fitted hearing aids, also in the sound field. This ensured that each listener received appropriate frequency gain shaping for the experimental stimuli. This combination of prerecorded and individually aided strategies was necessary to support the multiple comparison procedure used in this study, which could not have been implemented via the multimemory programming capabilities of the test instruments. Experimental stimuli were routed via a clinical audiometer (GSI-61) and power amplifier (R300) and were adjusted to each listener’s Most Comfortable Level.
Results
The interrater reliability within each group was computed using the one-way random effects intraclass correlation coefficient (ICC) as implemented in SPSS software (Version 16.0). The average measure ICCs were 0.85, 0.92, 0.96, and 0.97 for the HI children, HI adults, NH children, and NH adults, respectively. These results indicate that the speech quality ratings had good reliability within each group of listeners (Portney & Watkins, 2000). The Cronbach’s α for the test-retest data across all four listener groups was .87, indicating a high degree of intrarater reliability. The intra- and interrater reliability evaluations indicate that the groups (children and adults, HI and NH) were all able to perform the sound quality ratings reliably.
The mean sound quality ratings across processing condition are displayed by listener group in Figures 3 and 4, collapsed across the individual talkers within each gender. The NFC settings are denoted by the CR and CF parameters. For example, the label “CR2_CF4k” stands for the frequency compression setting with CR of 2:1 and CF of 4000 Hz. The statistical significance of the differences in speech quality ratings by the listener groups was evaluated using a repeated measures analysis of variance (SPSS version 16.0), with hearing status (i.e., NH vs. HI) and age group (i.e., adults vs. children) as between-participants factors. Repeated measures in this analysis included the eight processing settings and the gender of the talker. Post hoc analysis of significant interactions was conducted using family-wise alpha adjustment via the False Discovery Rate (FDR) control (Matsunaga, 2007).

Mean speech quality ratings for the four groups of listeners, averaged across the two male talkers.

Mean speech quality ratings for the four groups of listeners, averaged across the two female talkers.
The results of these analyses reveal differences across processing settings, across talker gender, and across listener groups as well as interactions among some of these variables. There was a significant main effect of the processing setting, F(7, 36) = 158.5, p < .05, and a significant interaction between the processing setting and hearing group, F(7, 36) = 18.220, p < .05, processing setting and talker, F(7, 36) = 2.697, p < .05, and processing setting and the age group, F(7, 36) = 3.737, p < .05). No significant three-way interactions were found. Given the number of two-way interactions, post hoc contrasts were conducted at the level of hearing group by age group and by processing condition (Tables 2 and 3).
Post Hoc Test Results From the NH Data in Study No. 1.
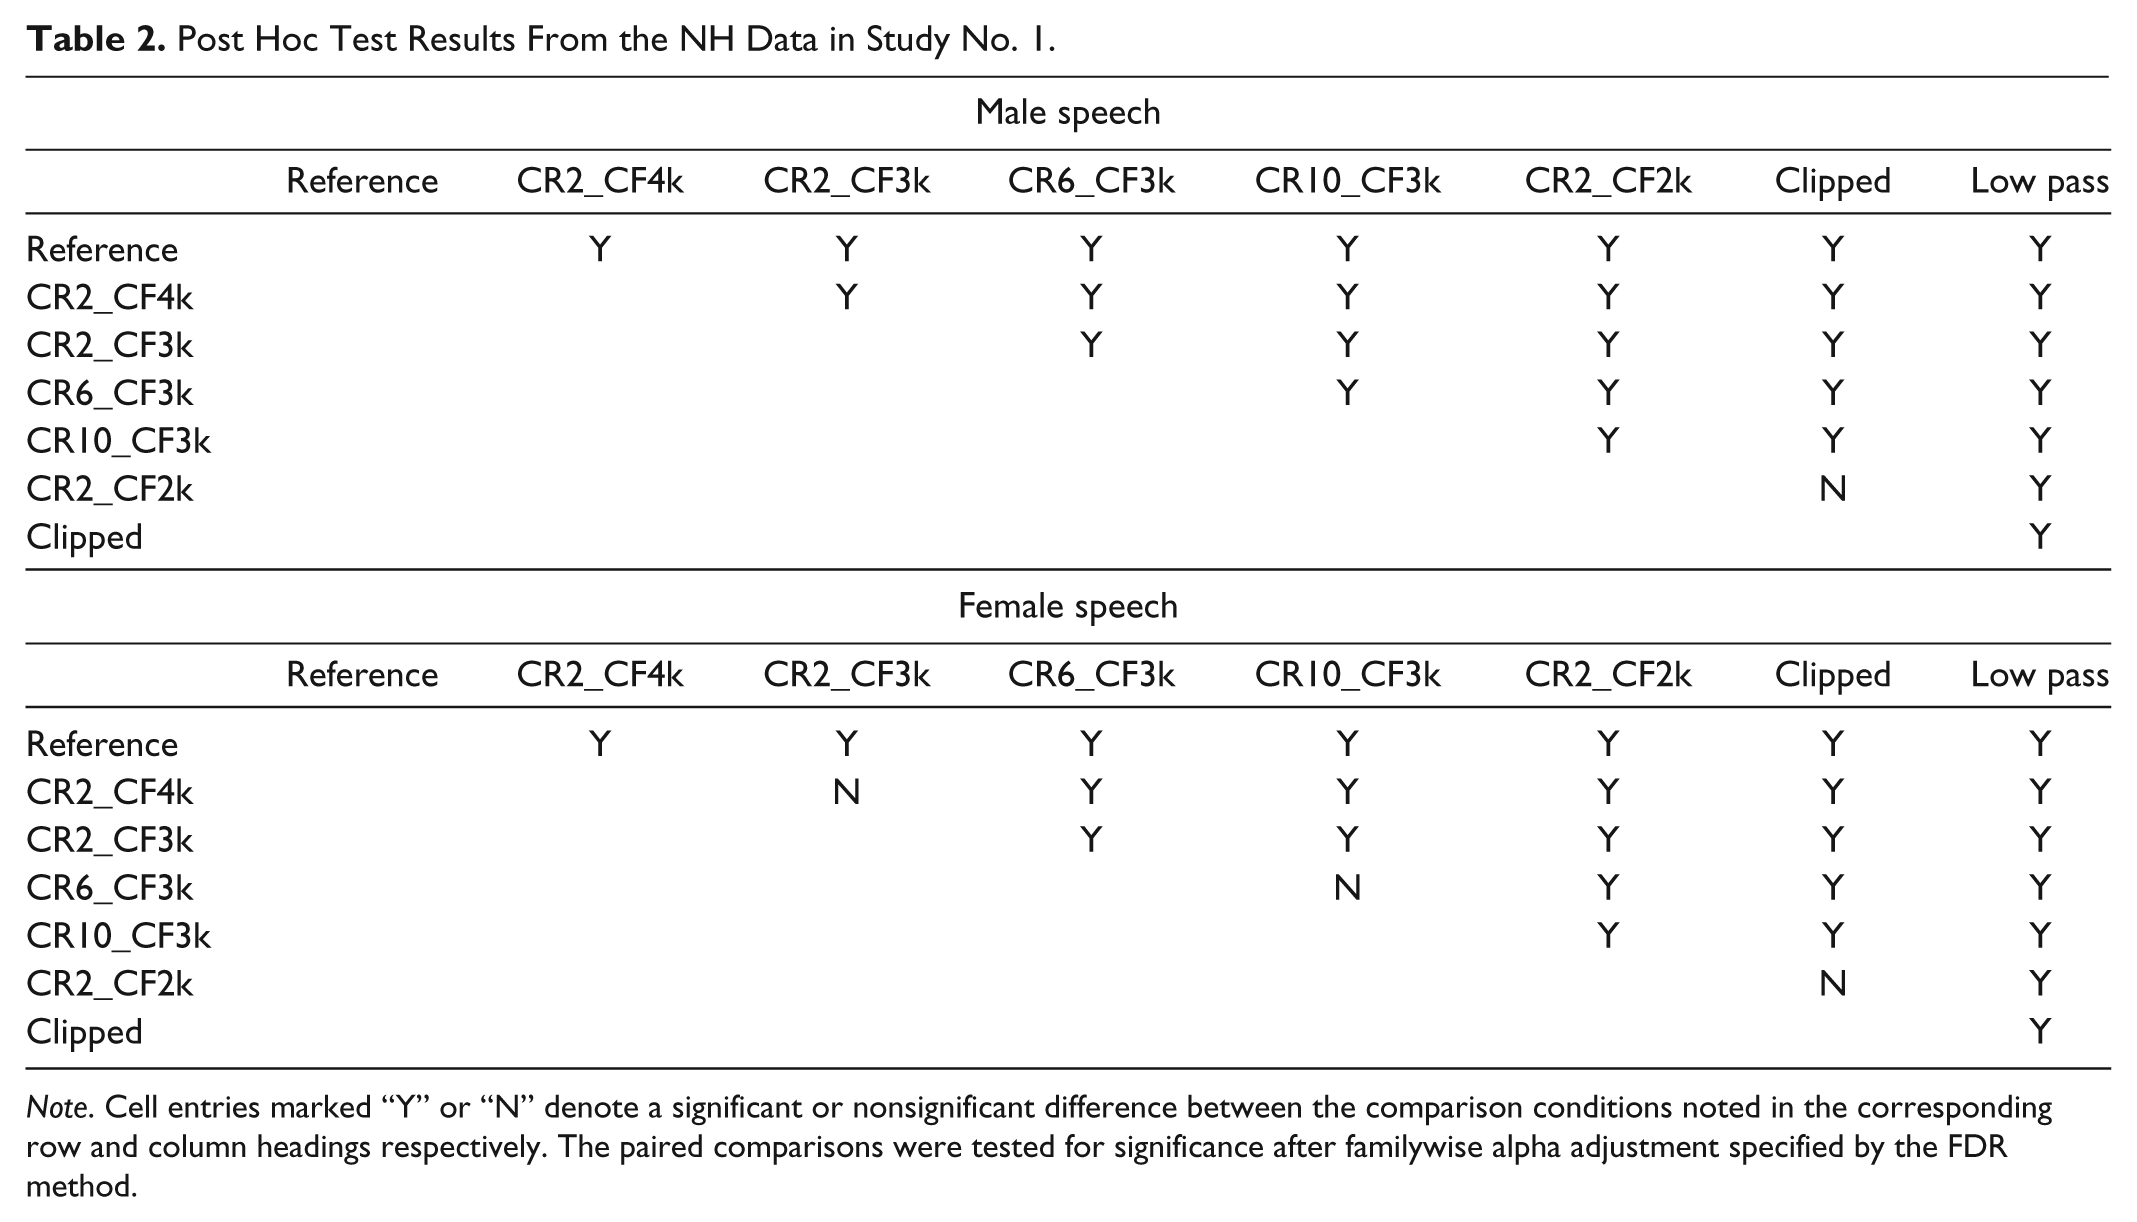
Note. Cell entries marked “Y” or “N” denote a significant or nonsignificant difference between the comparison conditions noted in the corresponding row and column headings respectively. The paired comparisons were tested for significance after familywise alpha adjustment specified by the FDR method.
Post Hoc Test Results From the HI Data in Study No. 1.

Note. Cell entries marked “Y” or “N” denote a significant or nonsignificant difference between the comparison conditions noted in the corresponding row and column headings respectively.
The interaction of processing setting with hearing group indicates that the NH listeners distinguished between the sound quality changes introduced by different frequency compression settings, while the HI listeners did not. This is evident in Figures 3 and 4, where the quality scores from NH listeners in general decreased with an increase in the amount of frequency compression, whereas HI listeners provided higher and more similar sound quality ratings to a larger range of frequency compressed stimuli. Post hoc contrasts indicated that NH listeners provided significantly different sound quality ratings across frequency compression strength for all but two settings, while the HI listeners provided different ratings for only one third to one half of the stimuli (Tables 2 and 3). These results indicate that HI listeners may be less sensitive to the sound quality effects of frequency compression compared to listeners with normal hearing.
The interaction of processing setting with talker gender was confined to NH listeners only, F(7, 16) = 3.007, p < .05. Within the NH group, there was no significant interaction between the processing setting and age group, F(7, 16) = 2.051, p = .111. In contrast, a significant interaction did emerge between age group and processing setting within the HI group, F(7, 14) = 3.218, p < .05. This is reflected in Figures 3 and 4, where the mean quality scores from HI children differed across most frequency compression conditions while ratings by the adults did not (Table 3). The processing condition rated as significantly poorer than the other conditions, by all four listener groups, was the strongest frequency compression condition used in this study (CF2_CF2k). This strong condition was rated as having sound quality that was not significantly different than the peak clipped stimulus by all groups. Statistically, this condition was not significantly different than the 2 kHz low pass stimulus as rated by the HI groups.
In summary, the results of Study 1 indicate that the MUSHRA task used here supported an evaluation of speech quality across a broad range of hearing aid settings in about 20 min and that the results were reliable in children and in adults, regardless of hearing status. Specific to frequency compression, the quality of speech declines as more NFC is applied. However, these results are best understood in the context of participant groups. Normally hearing adults and children were highly sensitive to the effects of frequency compression, peak clipping, and low pass filtering, and were able to discern significant changes in sound quality across all five of the frequency compression conditions tested here, at least for male speech. In contrast, the HI children and adults rated the sound quality of frequency compressed speech about 5% to 25% higher than did the NH listeners and rated fewer of the frequency compressed conditions as significantly different from one another. This indicates that HI listeners may be less sensitive to the sound quality changes produced by frequency compression than are NH listeners. This effect was most noticeable in the HI adult group, who provided sound quality ratings of nearly 80% for any frequency compression settings with a CF at 3000 Hz and above. For clinical practice, this may mean that carefully selected individualized fittings may maintain acceptable sound quality for users of frequency compression hearing aids. These adult participants have also been evaluated for frequency compression benefit in a companion article, in which they received individualized settings using a protocol aimed at maintaining a high cutoff frequency when possible (Glista et al., 2009). Using this strategy together with the DSL v5.0 prescription, 6 of the listeners who also participated in the present study had significant benefit from frequency compression on one or more of the following measures: consonant recognition, plural recognition, /s/ or /∫/ detection, one had significant detection decrement, and the remainder had a neutral outcome. While majority of these participants had cutoff frequencies above 3000 Hz, five received CFs between 2000 and 3000 Hz, indicating a further need to evaluate the implications of sound quality within this range for adult hearing aid users. In the present study, a substantial decrease in sound quality was observed for adults with hearing loss when the NFC CF was changed from 3000 Hz to a stronger setting of 2000 Hz, regardless of the frequency compression ratio. This significant change will be explored further in Study 2 below.
Children with HI were more sensitive to the effects of NFC. The reasons for this are unknown and may be due to developmental factors or to our use of a higher listening level by the children in this study. Recall that these same children also demonstrated a greater degree of benefit with individually adjusted NFC in the companion study by Glista et al. (2009). This may mean that the differences in sound quality ratings observed here do not preclude the use of frequency compression in children, provided that appropriate individual fittings are provided. In the companion trial and other studies since, children have shown significant benefit with frequency compression, particularly if their high frequency hearing loss is severe (Glista et al., 2009, 2012). The relationship between individualized settings and children’s performance with frequency compression or other frequency lowering strategies requires further study.
Study 2
Motivation
Study 1 investigated the effects of NFC on the quality of male and female speech. The frequency compression CF was manipulated in steps of 1000 Hz, and a sharp decline in sound quality was observed when this parameter was changed from 2000 to 3000 Hz in adults with hearing impairment. In Study 2, we explore this phenomenon in more detail, with the goal of better representing the range and variation of settings that may be used in individual fittings. For example, Glista et al. (2009) fitted NFC hearing aids spanning a CF range of 1500 Hz to 4000 Hz in investigating clinical outcomes of NFC for the same group of HI listeners, with most participants fitted with CFs just below 2000 to just above 3000 Hz. Furthermore, very little data exist on how the choice of different NFC parameters affects the perceived sound quality for speech signals in background noise and for music stimuli. Therefore, the purpose of this second study was to measure the effects of NFC on perceived sound quality of several complex stimuli across a broader range of NFC CF settings.
Materials and Method
Participants
A group of 8 HI adult participants and 12 NH adult participants rated the sound quality of frequency-compressed speech in quiet, speech in noise, and two genres of music. Four of the HI participants also participated in Study 1. All participants underwent an assessment or screening test battery prior to study participation, similar to Study 1. Table 4 shows the air conduction thresholds for the HI participants in the second study.
Pure-Tone Hearing Threshold Values (dB HL) for the HI Adults Included in Study No. 2.
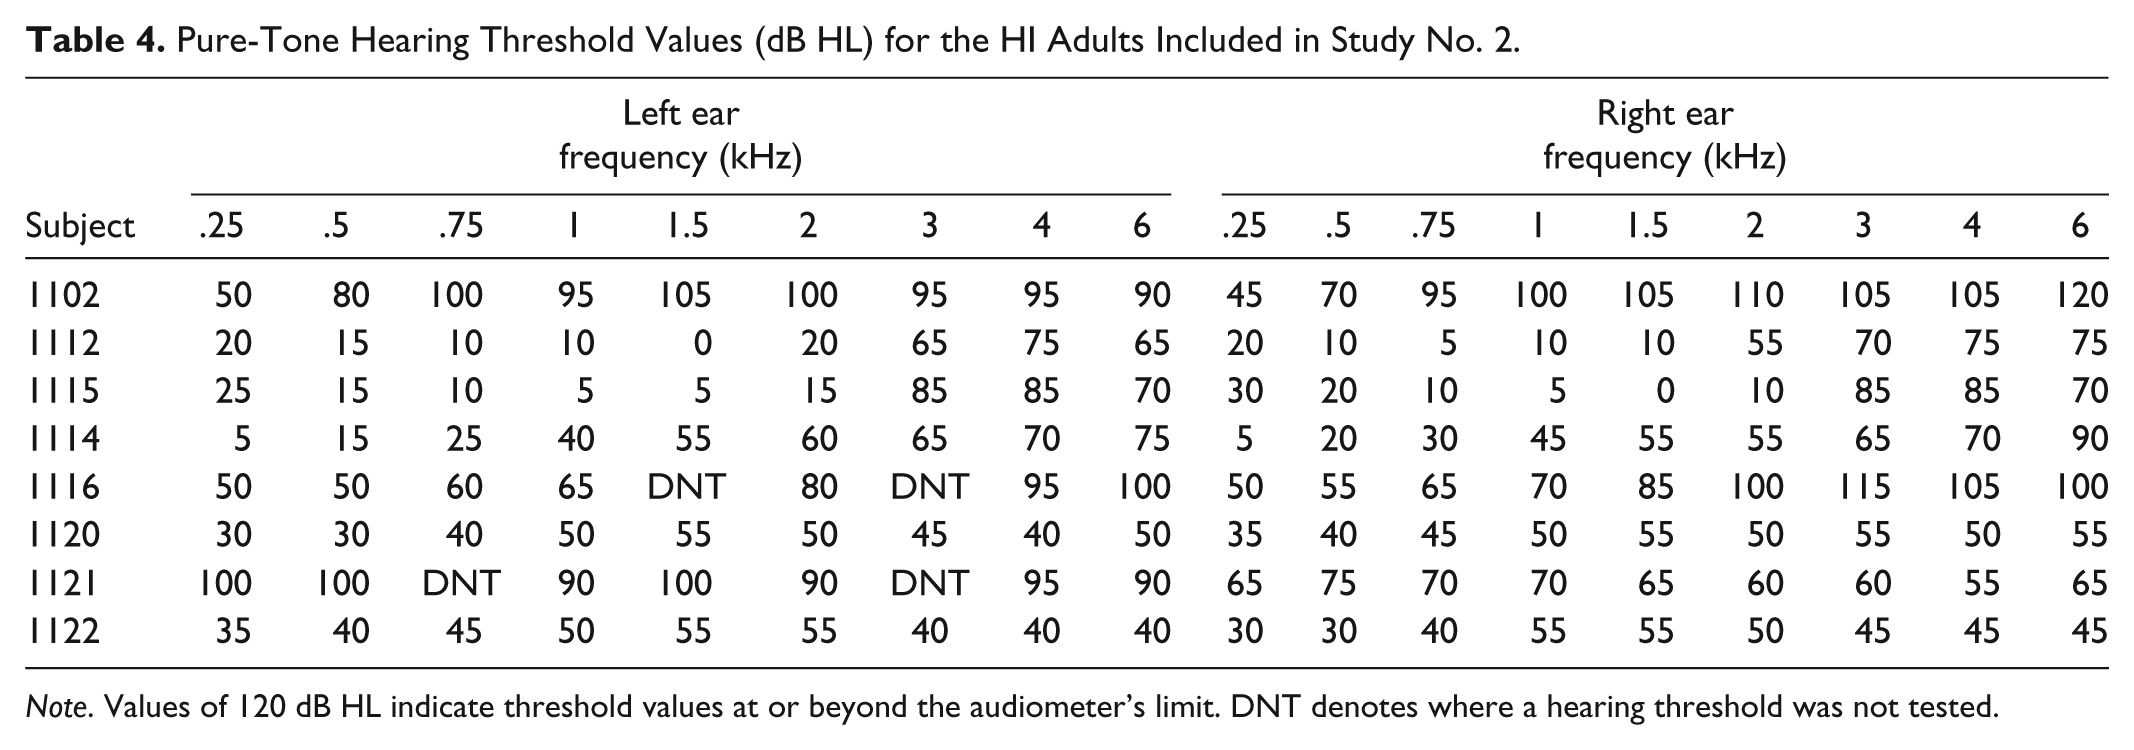
Note. Values of 120 dB HL indicate threshold values at or beyond the audiometer’s limit. DNT denotes where a hearing threshold was not tested.
Stimuli
Six stimulus types were used in this experiment: a speech sample in quiet spoken by a female talker, a speech sample in quiet spoken by a male talker, a speech sample spoken by a second female talker with background noise at a signal-to-noise ratio (SNR) of 6 dB, a speech sample spoken by a second male talker with background noise at a SNR of 6 dB, a contemporary music sample (Beatles), and a classical music sample (Handel). Similar to methods in Study 1, each stimulus type was recorded through a prototype NFC hearing aid at various settings, to create the experimental stimuli that were presented to the participants. The original digital files were used as reference stimuli in each stimulus condition. The prototype hearing aid was programmed to record four test stimuli with NFC off and at different NFC settings. CFs were selected to span 1600 to 3150 Hz, in steps of one-third octaves: 1600 Hz, 2000 Hz, 2500 Hz, and 3150 Hz. The CR was held constant at 2:1. For all the hearing aid recordings, other advanced features such as adaptive directionality, digital noise reduction, and feedback cancellation were disabled. Two anchor stimuli were generated through low pass filtering and peak clipping. The low pass stimulus was created by filtering the reference stimulus with a cutoff of 2000 Hz, and the peak clipped sample was generated through hard-clipping at 25% of the peak amplitude value in the reference stimulus.
Sound quality ratings
Subjective ratings of sound quality were obtained using the MUSHRA procedure described earlier. HI participants listened to the stimuli while wearing hearing aids whose gain, compression, and output limiting were fitted according to the procedures described in Study 1. Listeners were instructed to first listen to the reference stimulus of either speech or music, and then judge the next eight randomly presented samples by comparing them individually to the reference. After each comparison, the listener rated the sample using the associated slider bar on a scale out of 100. Listeners were encouraged to listen to the stimuli as many times as they wished and were instructed to readjust the previously adjusted sliders, if they wished.
Results
The raw ratings were first tested for consistency. Interrater consistency was calculated within each recruitment group using the ICC one-way random effects model found in the SPSS software package (Version 16.0). The resulting values from this test were 0.93 and 0.72 for the NH and HI groups respectively. This suggests good consistency in ratings by the NH participants and moderate consistency for the HI group (Portney & Watkins, 2000). Because the consistency was reduced in the HI group, ICCs were also obtained for each stimulus type in the HI group. The results indicated that for the rating in the quiet condition the ICC value was 0.80; for the music condition, 0.69, and for the noise condition, 0.38. These data therefore suggest good consistency for the HI listeners in quiet, moderate consistency for data collected using music stimuli, and poor consistency for data collected on stimuli in noise.
Statistical analysis of the subjective data for each of the three stimulus types (speech in quiet, speech in noise, and music) was conducted separately to determine and interpret differences in quality ratings. A repeated measures analysis of variance was performed (SPSS version 16.0) on the quality ratings for each stimulus type with hearing status as the between-participants factor, and talker gender or genre and processing condition as within-participants factors. Post hoc comparison of means was completed with family-wise adjustment of alpha error (Matsunaga, 2007).
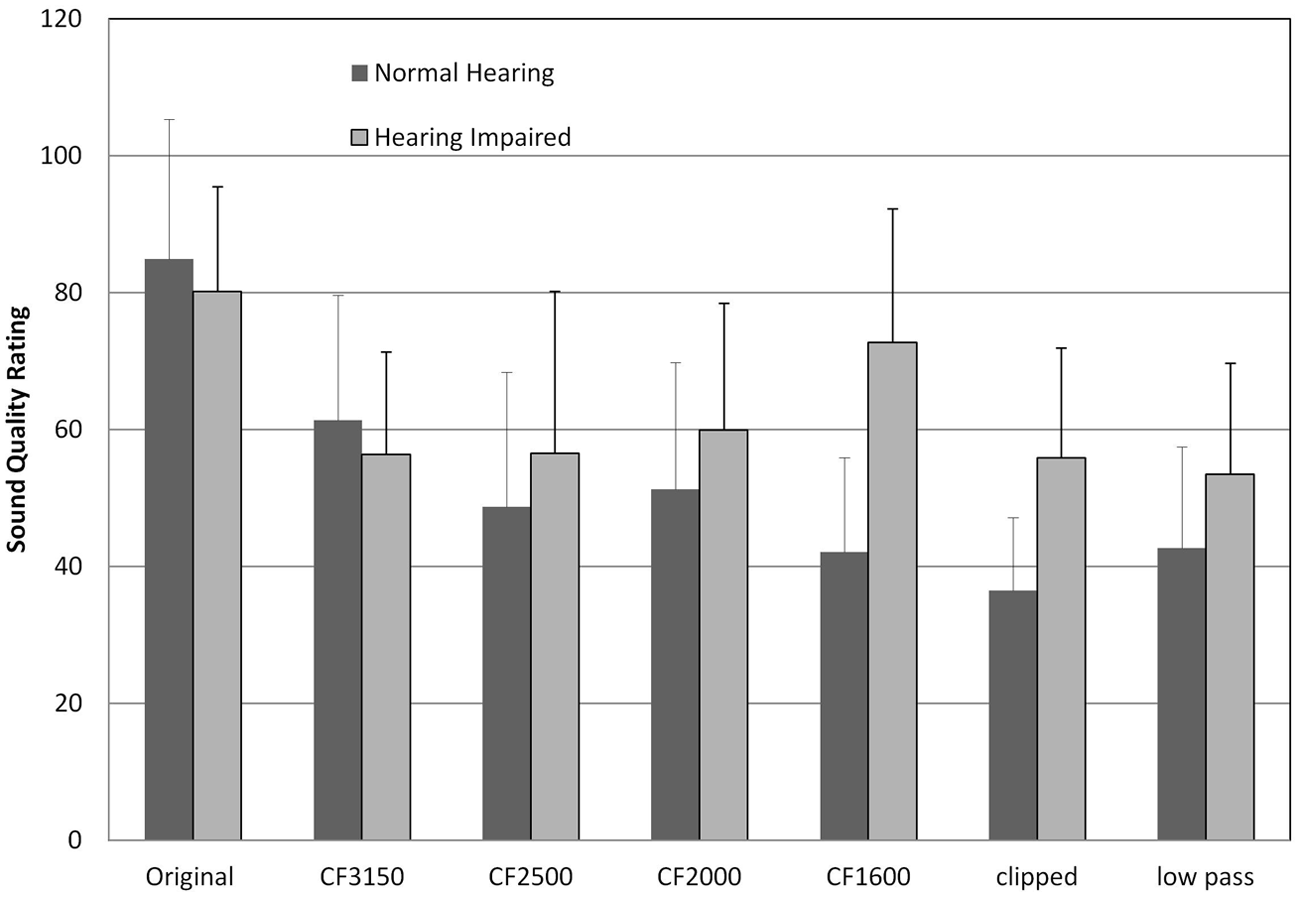
Figure 5 displays the averaged ratings for the speech in quiet condition, with the error bars denoting one standard deviation. Statistical analysis revealed a significant main effect of processing condition, F(6, 13) = 45.36, p < .05, and a significant interaction between processing and hearing status variables, F(6, 31) = 3.79, p < .05. As in Study 1, sound quality ratings from NH listeners declined as more NFC was applied, while this was not the case for the HI listeners. The NH listeners perceived sound quality differences for all pairs of stimuli, except for a few settings involving the strongest NFC settings and anchors (Table 5). In contrast, the HI listeners had sets of NFC settings that were not rated as having different sound quality (Table 5).

Averaged NH and HI quality ratings for the speech in quiet condition.
Post Hoc Test Results for Quality Ratings of Speech in Quiet and Noise From Study No. 2.

Note. Cell entries marked “Y” or “N” denote a significant or nonsignificant difference between the comparison conditions respectively. Columns marked “S” represent data from speech in quiet condition, while those marked “S + N” represent data for the speech in noise condition.
The results for speech in noise were, however, not similar to those obtained in Study 1 (Figure 6). In noise, there was a significant main effect of processing, F(6, 13) = 20.93, p < .05, and an interaction between processing and hearing status, F(6, 13) = 9.13, p < .05. The NH listeners continued to provide declining sound quality ratings as more frequency compression was applied, even in the presence of noise. They had fewer significantly different ratings when comparing the strongest NFC setting to the anchor stimuli, in noise (Table 5). In contrast, the HI listeners’ ratings were not significantly different between any pairs of stimuli (Table 5), were restricted in range, and provided lower ratings overall even for the reference signal. It appears that the presence of noise reduced the overall sound quality for HI listeners across stimuli and perhaps masked any sound quality differences that HI listeners may have perceived between different NFC settings.

Averaged NH and HI quality ratings for the speech in noise condition.
Finally, Figures 7 and 8 display the averaged sound quality ratings for the contemporary and classical music stimuli respectively. Statistical analysis showed a significant main effect of processing, F(6, 13) = 27.39, p < .05, as well as a significant interaction between processing and hearing status, F(6, 13) = 5.63, p < .05, and processing and music genre, F(6, 13) = 11.79, p < .05). The first interaction reveals that music quality ratings from NH listeners decreased as more frequency compression was provided, which was not the case for the HI listeners. For example, the NH listeners rated any frequency compressed passage of music as significantly poorer than the reference signal, but only rated a significant difference between frequency compression conditions for the strongest versus weakest NFC settings (Table 6). In contrast, the HI listeners rated the frequency compressed music more favorably than did the NH listeners (Figures 7, 8) and had fewer pairs of conditions that had different ratings (Table 6). The interaction between processing type and music genre was mainly due to the differences in quality ratings for the “clipped” condition between the contemporary and classical music samples. Peak clipping had a more adverse effect on sound quality for the classical music sample, and reasons for this are given in the discussion below.
Average rating of contemporary music.

Average rating of classical music.
Post Hoc Test Results for Quality Ratings of Music Samples in Study No. 2.

Note. Cell entries marked “Y” or “N” denote a significant or nonsignificant difference between the comparison conditions respectively. Columns marked “M1” represent data for contemporary music, while those marked “M2” represent data for the classical music.
Discussion
This article presents the results of two studies investigating the effects of frequency compression signal processing on the sound quality of speech and music. Both adults and children, with and without hearing losses, were tested across a wide range of NFC settings (strengths) and for a variety of stimuli. A computer-assisted multiple comparison procedure was used, and produced reliable results in all listener groups, for most stimuli. Speech in noise stimuli had poorer reliability for listeners with hearing impairment; this was likely affected by the restricted and poor range of sound quality ratings obtained for this condition. Overall, these findings are encouraging because they demonstrate that consistent ratings of hearing aid sound quality were obtainable using this method.
Quality ratings for male and female speech were obtained from both adults and children in Study 1. Within the NH group, both adults and children ranked the different conditions in a similar manner. Within the hearing impaired group, the adults appear to be less sensitive to changes in the CF and CR, when the CF was above 2000 Hz. The HI children, on the other hand, were able to perceive differences in sound quality between NFC settings with higher CFs. In general, the HI children provided sound quality ratings that were similar to those from the NH listeners. These results are interesting given that these children were a subset of those who reported significant benefit with NFC in a companion article (Glista et al, 2009). If the children could hear differences (reductions) in sound quality in this study, that did not appear to prevent them from obtaining benefit from NFC. Factors that may relate to this include the use of individualized settings in the companion study, a trial period that permitted acclimatization to sound quality changes, and/or the relative importance of speech sound detection/recognition abilities versus sound quality. A full understanding of these factors would require further evaluation.
For adults, the results of Study 1 also indicated a marked decline in sound quality when the NFC CF was changed from 3000 Hz to a stronger setting of 2000 Hz. In Study 2, the impact of NFC on speech in background noise and music was also studied, and included settings within and outside the range of 2000 to 3000 Hz in one-third octave band steps. One reason for this study was to replicate the sound quality rating study for sentences in quiet and with smaller step sizes of CF. It may have been possible to observe that a particular CF was associated with a rapid decline in sound quality. However, this did not occur. Instead, we observe a gradual relationship between NFC strength and sound quality for speech.
Sound quality ratings for speech in noise did not follow the same trends as observed for speech in quiet. The quality ratings of noisy speech by HI participants showed no consistent sound quality preference and/or an inability to distinguish stimuli with respect to sound quality. They were also of poorer reliability than corresponding data from NH listeners. The poor reliability with HI data was likely affected by an overall reduction in intelligibility of speech in noise, as even the reference stimulus (NFC off) was rated as having approximately 20% poorer sound quality by the HI listeners than by the NH listeners. Further research on sound quality in noise is needed to understand this further, and possibly to study whether sound quality changes should be investigated in combination with noise reduction strategies.
The NH listeners were highly sensitive to the effects of frequency compression on music stimuli, and demonstrated a gradual decline in sound quality ratings as the strength of NFC increased. This is consistent with speech quality ratings from NH listeners across both studies reported in this article. Music stimuli were rated as having higher sound quality by the HI listeners, compared to the NH listeners, and this was more apparent for classical music than for rock music. This preliminary investigation of music sound quality indicates that the hearing status and the genre of the music may be important factors, with hearing aid candidates being less sensitive to the sound quality changes attributable to frequency compression than listeners with normal hearing.
The present study obtained sound quality ratings through the MUSHRA procedure, which includes a high quality unprocessed reference signal and two deliberately distorted anchor stimuli (peak-clipped and low pass filtered). These are included to serve as exemplars for high quality and poor quality stimuli. The subjective ratings in general support the use of the MUSHRA procedure for hearing aid sound quality investigations. The anchor stimuli were generally appropriate for comparison with frequency compressed stimuli, with some exceptions with the peak clipped stimuli for some of the experimental conditions. Specifically, peak-clipped stimuli were rated as having much higher sound quality for the classical music passage than for all other stimulus types and did not occupy the lower end of the rating scale. This is attributable to the method used to generate the stimuli. For each of the stimuli, the peak clipping was done at a fixed level of 25% of the maximum amplitude. Thus those stimuli with higher crest factors incurred less distortion due to this method of processing. For example, the crest factor for the classical music stimulus was 18 dB, while the crest factor for the contemporary music stimulus was 10 dB. This resulted in only 3% of the samples clipped for the classical music signal as compared to 15% for the contemporary music signal. The corresponding sound quality ratings by both NH and HI listeners reflect this, as the peak-clipped stimulus was rated closer to the reference stimulus and better than the NFC settings for classical music. The MUSHRA procedure permits the selection of anchor stimuli that are appropriate for the signal processor under investigation, so future studies could use alternative stimulus types to those employed in these investigations. The low pass stimulus is likely an important anchor stimulus for the investigation of frequency lowering, as it represents a condition without high frequency audibility. Together with the wideband reference stimulus, it effectively assesses sound quality within the clinical context frequency lowering hearing aids, which aim to provide wideband cues in a narrowband signal.
A final consideration is the role of auditory acclimatization. In the present study, speech and music quality ratings were obtained with no acclimatization to the NFC settings. This was done intentionally as to not bias the participants toward a certain setting. The findings therefore reflect sound quality perception that may occur at the time of initial fitting. These data do not evaluate whether sound quality ratings might change after regular use of the frequency compression technology. Acclimatization in the auditory modality is a controversial topic with disagreements in the literature over the breadth and significance of the acclimatization effect in HI listeners (Arlinger et al., 1996; Munro, 2008). Nonetheless, there is evidence that the speech perception abilities of some individuals do improve over time with regular hearing aid use (Cox, Alexander, Taylor, & Gray, 1996; Gatehouse, 1992, 1993; Glista et al., 2012; Horwitz & Turner, 1997; Wolfe et al., 2011; Yund, Roup, Simon, & Bowman, 2006). Earlier studies demonstrating the presence of an acclimatization effect post hearing aid use include those by Stuart Gatehouse (1992, 1993). In these studies, speech perception improved over time when compared to the unaided ear and in cases where an improved hearing aid response (i.e., greater high frequency response) was provided. Yund et al. (2006) studied nonsense syllable recognition in new hearing aid wearers fitted with either multichannel wide dynamic range compression or linear hearing aids, over a period of 40 weeks. Results showed a performance gain after 8 weeks of consistent hearing aid use by only those participants fitted with the WDRC devices (Yund et al., 2006). More recently, studies with child listeners have demonstrated the possible need for a period of time to acclimate to NFC hearing aid processing, likely due to learning effects related to differentiating new high frequency speech cues (Glista et al., 2012; Wolfe et al., 2011). It is possible that changes in sound quality judgments with NFC may occur due to acclimatization as well. A clinical study conducted by Phonak showed that the quality ratings for the NFC scheme improve after an acclimatization period of 1 month by adult HI listeners (Nyffeler, 2008). Further research is needed here to demonstrate whether sound quality judgments change significantly with acclimatization time.
Conclusions
Sound quality ratings of speech stimuli processed by a prototype hearing aid with different frequency compression settings were reliably obtained from groups of NH and HI adults and children. A follow-up study investigated the effects of frequency compression on speech, speech in noise, and two genres of music. Results indicate that listeners with NH are highly sensitive to the effects of NFC on sound quality. For these listeners, the strength of the frequency compressor is directly related to a decline in sound quality for all stimuli studied in this article. The HI adults were found to be less sensitive to sound quality effects and rated a range of frequency compressed settings as having indistinguishable sound quality from the reference (no frequency compression) condition. This pattern was most apparent for stimuli not in competition, specifically the speech and music stimuli. For speech in noise ratings, hearing aid candidates rated all stimuli as having sound quality in the “fair” range regardless of whether frequency compression was enabled or disabled. Significant adult–child differences emerged within the group of HI listeners, with children exhibiting greater sensitivity to sound quality differences introduced by NFC. This finding is interesting given that the same group of children received speech detection/recognition benefit with NFC (Glista et al., 2009). Importantly, the present study used fixed rather than individualized NFC settings and the sound quality ratings were obtained prior to allotting acclimatization with NFC. The findings reported in this article may therefore more closely reflect the sound quality judgments of an initial fitting appointment; findings may have differed had individualized NFC settings been included in this study. Nonetheless, sound quality appears to be subjective and may change with experience. Further research is needed to investigate the impact of individualized settings on sound quality judgments for different types of frequency lowering strategies. In clinical practice, clinicians with normal hearing may be advised that their perceptions of sound quality may not be similar to those of their patients, at least at the time of fitting.
Footnotes
Acknowledgements
We thank Marlene Bagatto and Melissa Polonenko for their assistance with data collection, and the participants and their families for taking part in this study.
Declaration of Conflicting Interests
The authors declared no potential conflicts of interest with respect to the research, authorship, and/or publication of this article.
Funding
The authors disclosed receipt of the following financial support for the research, authorship, and/or publication of this article: The authors gratefully acknowledge the funding support from Hearing Foundation of Canada (THFC), the Natural Sciences and Engineering Research Council (NSERC) Collaborative Health Research Project, and Phonak AG.
List of Abbreviations
CF = cutoff frequency; CR = compression ratio; DSL = Desired Sensation Level; HI = hearing impaired; ICC = intraclass correlation coefficient; FDR = False Discovery Rate; MUSHRA = Multiple Stimulus Hidden Reference and Anchors; NFC = nonlinear frequency compression; NH = normal hearing; PTA = pure-tone average; SNR = signal-to-noise ratio.