
Abstract
While hearing aids are beneficial in compensating for hearing loss and suppressing ambient noise, they may also introduce an unwanted processing burden to the listener's sensory and cognitive system. To investigate such adverse side effects, hearing aids may be set to a ‘transparent mode’, aiming to replicate natural hearing through the open ear as best as possible. Such transparent hearing aids have previously been demonstrated to exhibit a small but significant disadvantage in speech intelligibility, with less conclusive effects on self-rated listening effort. Here we aimed to reproduce these findings and expand them with neurophysiological measures of invested listening effort, including parietal alpha power and pupil size. Invested listening effort was measured across five task difficulties, ranging from nearly impossible to easy, with normal-hearing participants in both aided and unaided conditions. Results well reproduced a hearing aid disadvantage for speech intelligibility and subjective listening effort ratings. As to be expected, pupil size and parietal alpha power followed an inverted u-shape, peaking at moderate task difficulties (around SRT50). However, the transparent hearing aid increased pupil size and parietal alpha power at medium task demand (between SRT20 and SRT80). These neurophysiological effects were larger than those observed in speech intelligibility and subjective listening effort, respectively. The results gain plausibility by yielding a substantial association of individual pupil size and individual parietal alpha power. In sum, our findings suggest that key neurophysiological measures of invested listening effort are sensitive to the individual additional burden on speech intelligibility that hearing aid processing can introduce.
Introduction
Hearing aids pick up sounds near the ear, process the acoustic signal, and emit the processed signal into the ear canal. A level- and frequency-dependent amplification according to the hearing loss is primarily applied to restore audibility. Hearing aids also include various advanced signal-enhancement features such as noise reduction, directional microphones, or feedback reduction and provide many benefits to the user (Bentler et al., 2008; Keidser et al., 2007; Ricketts & Hornsby, 2005). However, listening through hearing aids or other hearing devices can also has detrimental effects. These include impaired spatial perception, unnatural sound quality, alteration of one's own voice, and diminished speech perception (Cubick et al., 2018; Denk et al., 2024; Schepker et al., 2020; Van den Bogaert et al., 2011). These parasitic or side effects of hearing devices, often referred to as hearing aid disadvantage, may counteract positive effects. The hearing aid disadvantage becomes particularly apparent when the required assistance provided by hearing aids is minimal. This is primarily the case for individuals with mild hearing loss or normal hearing. Gaining a better understanding of the reasons behind the hearing aid disadvantage will help, on the one hand, to assess when hearing aids are truly beneficial and when their advantages outweigh the disadvantages. On the other hand, delineating potential disadvantages can help improve future hearing aid algorithms.
To leave out all complex features and focus on linear amplification, hearing aid disadvantage has been investigated using transparent hearing aids, i.e., devices set to 0 dB real ear insertion gain (Cubick et al., 2018; Denk et al., 2024). This means the sound pressure level in front of the eardrum with transparent hearing aids is matched to open-ear listening at least for one incident direction (usually for frontal presentation). It is well known that due to the microphone location effect (MLE) not all directions can be equalized to be transparent at the same time which can lead to impaired spatial perception (Denk et al., 2018). In addition, limited bandwidths, processing delays, or a limited dynamic range can impair sound quality and reduce the amount of acoustically received information (Best et al., 2010; Best et al., 2020; Brungart et al., 2007; Cubick et al., 2018; Denk et al., 2019, 2024; Lelic et al., 2022; Schepker et al., 2020; Stone et al., 2008; Van den Bogaert et al., 2011).
A hearing aid disadvantage regarding speech intelligibility could also be observed in controlled settings where most limitations of hearing devices were excluded or irrelevant (Cubick et al., 2018; Cubick & Dau, 2016; Denk et al., 2024). This means speech and noise were presented in a collocated setting from the front, the bandwidth of the test signals was within the transmission range of the hearing devices, an almost closed ear coupling reduced the impact of delays, and the presentation level was chosen well above self-noise and well below the level at which non-linear distortions occur. In previous work, we performed a series of experiments to better understand the underlying reasons for the hearing aid disadvantage in this controlled setting (Denk et al., 2024). We measured speech reception thresholds for 50% speech intelligibility (SRT50) and recorded ratings on listening effort with six state-of-the-art hearing aids, an earbud system, and a research hearing aid in two settings, all compared to the unaided condition. The research hearing aid was set either to a generic transparent setting (i.e., the same setting for all subjects) or individually (i.e., to the individual open ear gain). A significant hearing aid disadvantage was found for speech intelligibility in each individual device except for the earbuds, while an effect on listening effort was only observed when averaged across all devices. Further experiments at various presentation levels ruled out the initially hypothesized reasons for self-noise and non-linear distortions. Additionally, it was shown that the individual setting of the research hearing aid significantly improved speech intelligibility compared to the generic setting. The exact reasons for the hearing aid disadvantage in this controlled setting have remained unclear. A comparison with a sound quality model (Biberger et al., 2018) suggested that the persistent issues are due to subtle sound quality degradations potentially related to insufficient equalization, artifacts, frequency-dependent signal processing, or processing delays. The mentioned effects could, in addition to speech intelligibility, also impact other aspects of hearing. Hearing itself is not limited to speech intelligibility. For instance, even with the same level of speech intelligibility, it may still be more or less effortful for listeners to engage in the listening process. In the subjective assessment of listening effort in the preliminary study, it appeared that the effect of transparent hearing aids is not as pronounced as in speech intelligibility (i.e., the deterioration is smaller). However, this experienced listening effort only reflects one aspect of this elusive construct. In addition, there is also invested listening effort, which is typically understood as a correlate of the cognitive resources dedicated to a task (Francis & Love, 2020; Herrmann & Johnsrude, 2020; Pichora-Fuller et al., 2016).
In this work, we want to apply objective measures of listening effort to better understand the impact of transparent hearing devices on the user. Pupil size and parietal alpha power, derived from the electroencephalogram (EEG), were chosen, since both measures been shown to provide important insights in auditory experiments, e.g., focusing on listening effort (e.g., Kraus et al., 2023b; Obleser et al., 2012). By utilizing objective measures of listening effort, we aim to gain a more comprehensive understanding of what changes occur in normal-hearing individuals when using transparent hearing aids. Parietal alpha power and pupil size were simultaneously recorded while a slightly modified version of the sentence-in-noise test of the previous work was performed. Moreover, these measures were not only recorded at 50% intelligibility at five different speech intelligibility levels (ranging from nearly impossible to easy), both unaided and aided with the transparent research hearing aid. In this way, we want to address the following research questions: (i) Can we replicate the hearing device disadvantage regarding SRT50 and reported listening effort from our previous experiment? (ii) Do acoustically transparent hearing devices lead to increased parietal alpha power and pupil size in normal-hearing listeners? (iii) Over what range of speech intelligibility does the hearing device disadvantage extend? (iv) Is pupil size directly associated with parietal alpha power?
Methods
Procedure
Twenty-two normal-hearing and right-handed participants (14 females; mean age: 24.3 y) were recruited from the participant database of the Department of Psychology at the University of Lübeck and attended this study voluntarily. In the end, data of N = 19 participants was included in the analyses. All participants were native German speakers and had no known cognitive disorder. Normal hearing was defined as no hearing threshold equal to or greater than 20 dB HL across the octave frequencies from 250 to 8,000 Hz.
Before the experiment, participants gave written informed consent and were either financially compensated with €10 per hour or received course credits. The study was approved by the ethics committee of the University of Lübeck (reference number: 22–086).
The experiment was separated in two identically organized sessions. The separation resulted from the net measurement time, which should be one-and-a-half-hour maximum per session. The sessions were conducted a minimum of 24 h apart.
Participants were placed approx. 70 cm in front of a monitor (Wimaxit M1330CT2, Shenzhen Weimi Communication Co., Ltd., Guangdong Sheng, China) in a sound-proofed booth. Stimuli were presented via a loudspeaker (Genelec 8030, Genelec Oy, Iisalmi, Finland), which was placed above the monitor and tilted towards the subject's head. The experiment was executed using custom software written for Matlab R2017b (MathWorks, Natick, USA), with the Psychophysics Toolbox 3 (Brainard, 1997) on a desktop computer (64-bit Windows 7 Professional) connected to an external soundcard (RME Fireface UC, RME Audio Interfances, Haimhausen, Germany).
All measurements used speech-in-noise task with sentence material from the Oldenburg sentence test (OLSA), spoken by a male speaker, and the respective speech-shaped unmodulated noise (so-called OLnoise). Each sentence is constructed according to the scheme “Name – verb – number – adjective – noun), e.g., “Ulrich gives seven heavy seats”. These sentences are syntactically correct but lack sufficient context, making it impossible to identify any specific words based on their context (Kollmeier et al., 2015). For each measurement, the noise level was set to 70 dB and the speech level was adapted to achieve a target intelligibility. This noise level was chosen to ensure that in future studies certain features are activated by a hearing aid and to measure at an ecologically valid sound pressure level (Wu et al., 2019). Both speech and noise were presented collocated from the same loudspeaker in front of the subjects.
During each session, there were always two identical measurement blocks: one with hearing aid (aided) and one without hearing aid (unaided). The order of the blocks within the first session was balanced using the randomized Latin Square method (Bock & Jones, 1968). In the second session, the first session was mirrored. Prior to each block, participants completed two adaptive SRT50 measurements, each using one test list of 20 sentences to minimize training effects of the OLSA material (Wagener et al., 1999). Next, five individual SRTs were determined for each participant using the Oldenburg Measurement Application version 2.2 (HörTech gGmbH, Oldenburg). The SRT20 and SRT80 were determined, and SRT50 was calculated using linear interpolation. The last two SRTs were intended to be nearly unsolvable and easily solvable for the participants. To achieve this, the SRT20 was reduced by 3 dB and the SRT80 was increased by 3 dB. This corresponds approximately to SRT5 (SRT20 - 3 dB) and SRT95 (SRT80 + 3 dB) on the reference function of the OLSA. Within a block, there were two measurements: subjective effort rating and a speech-in-noise test, while objective indicators of listening effort were recorded. For the sake of completeness, it should be mentioned that 64-channel EEG, pupil size, heart rate, and electrodermal activity were recorded simultaneously during the measurements. However, in this study, only the results of parietal alpha power (derived from the EEG) and pupil size are reported. To make the study as comfortable as possible for participants, despite the partial immobility required by the recording of various measurements, the setup was designed to be individually adjustable. This included a chair designed for 24-h use with various additional lumbar support options, a height-adjustable table, and the possibility for participants to stand up and walk around between blocks of aided and unaided conditions. The order in which participants commenced the subjective effort rating, or the speech-in-noise task was also randomised using the Latin Square method and mirrored in the second session. To assess subjective effort, the Adaptive Categorical Listening Effort Scaling (ACALES) procedure (Krueger et al., 2017) was performed also at noise level of 70 dB SPL. In this procedure, participants rated their perceived listening effort for the OLSA material using an adaptive method starting at +10 dB SNR, which corresponds to “no effort”. As a result, ACALES provides self-rated listening effort in Effort Scaling Categorical Units (ESCU) on a scale from 1 (no effort) to 13 (extreme effort) as a function of SNR.
The ACALES measurement was conducted in the Oldenburg Measurement Application version 2.2 (HörTech gGmbH, Oldenburg). Our experiment followed a 2 × 5 design. The main measurement included a speech-in-noise task (constant stimuli method) using the OLSA material (see Figure 1). Noise level was kept constant at 70 dB while the speech material was adjusted to match the five individually predetermined SRTs (SRT5, SRT20, SRT50, SRT80, and SRT95). This was accomplished in order to maintain a constant sum level across the various SRTs. A total of 150 OLSA sentences (30 sentences per SRT) were played in blocks of 30 trials to each participant. After each block, the participant could take an individual break. Within a block, each SRT was played 6 times. The order of SRTs within a block was fully randomized. The background noise was played continuously throughout a block. Between two trials, an inter-trial-interval with a median value of 2.27 s (skewed-right function) was chosen. Subsequently, the speech material was played while a speaker symbol was displayed on the screen for the participant. This was followed by another break with a median value of 2.98 s (skewed-right function) for measuring physiological reactions. Finally, the participant was either asked to repeat what was heard or another break followed. In two-thirds of the trials the participants had to repeat the sentence which was indicated by a speech bubble symbol on the screen. This comparison can tackle the side question whether verbal production has an impact on various physiological measures but is not being analysed for the purposes of the current study. The skewed-right functions were used to minimize predictability for the participant.
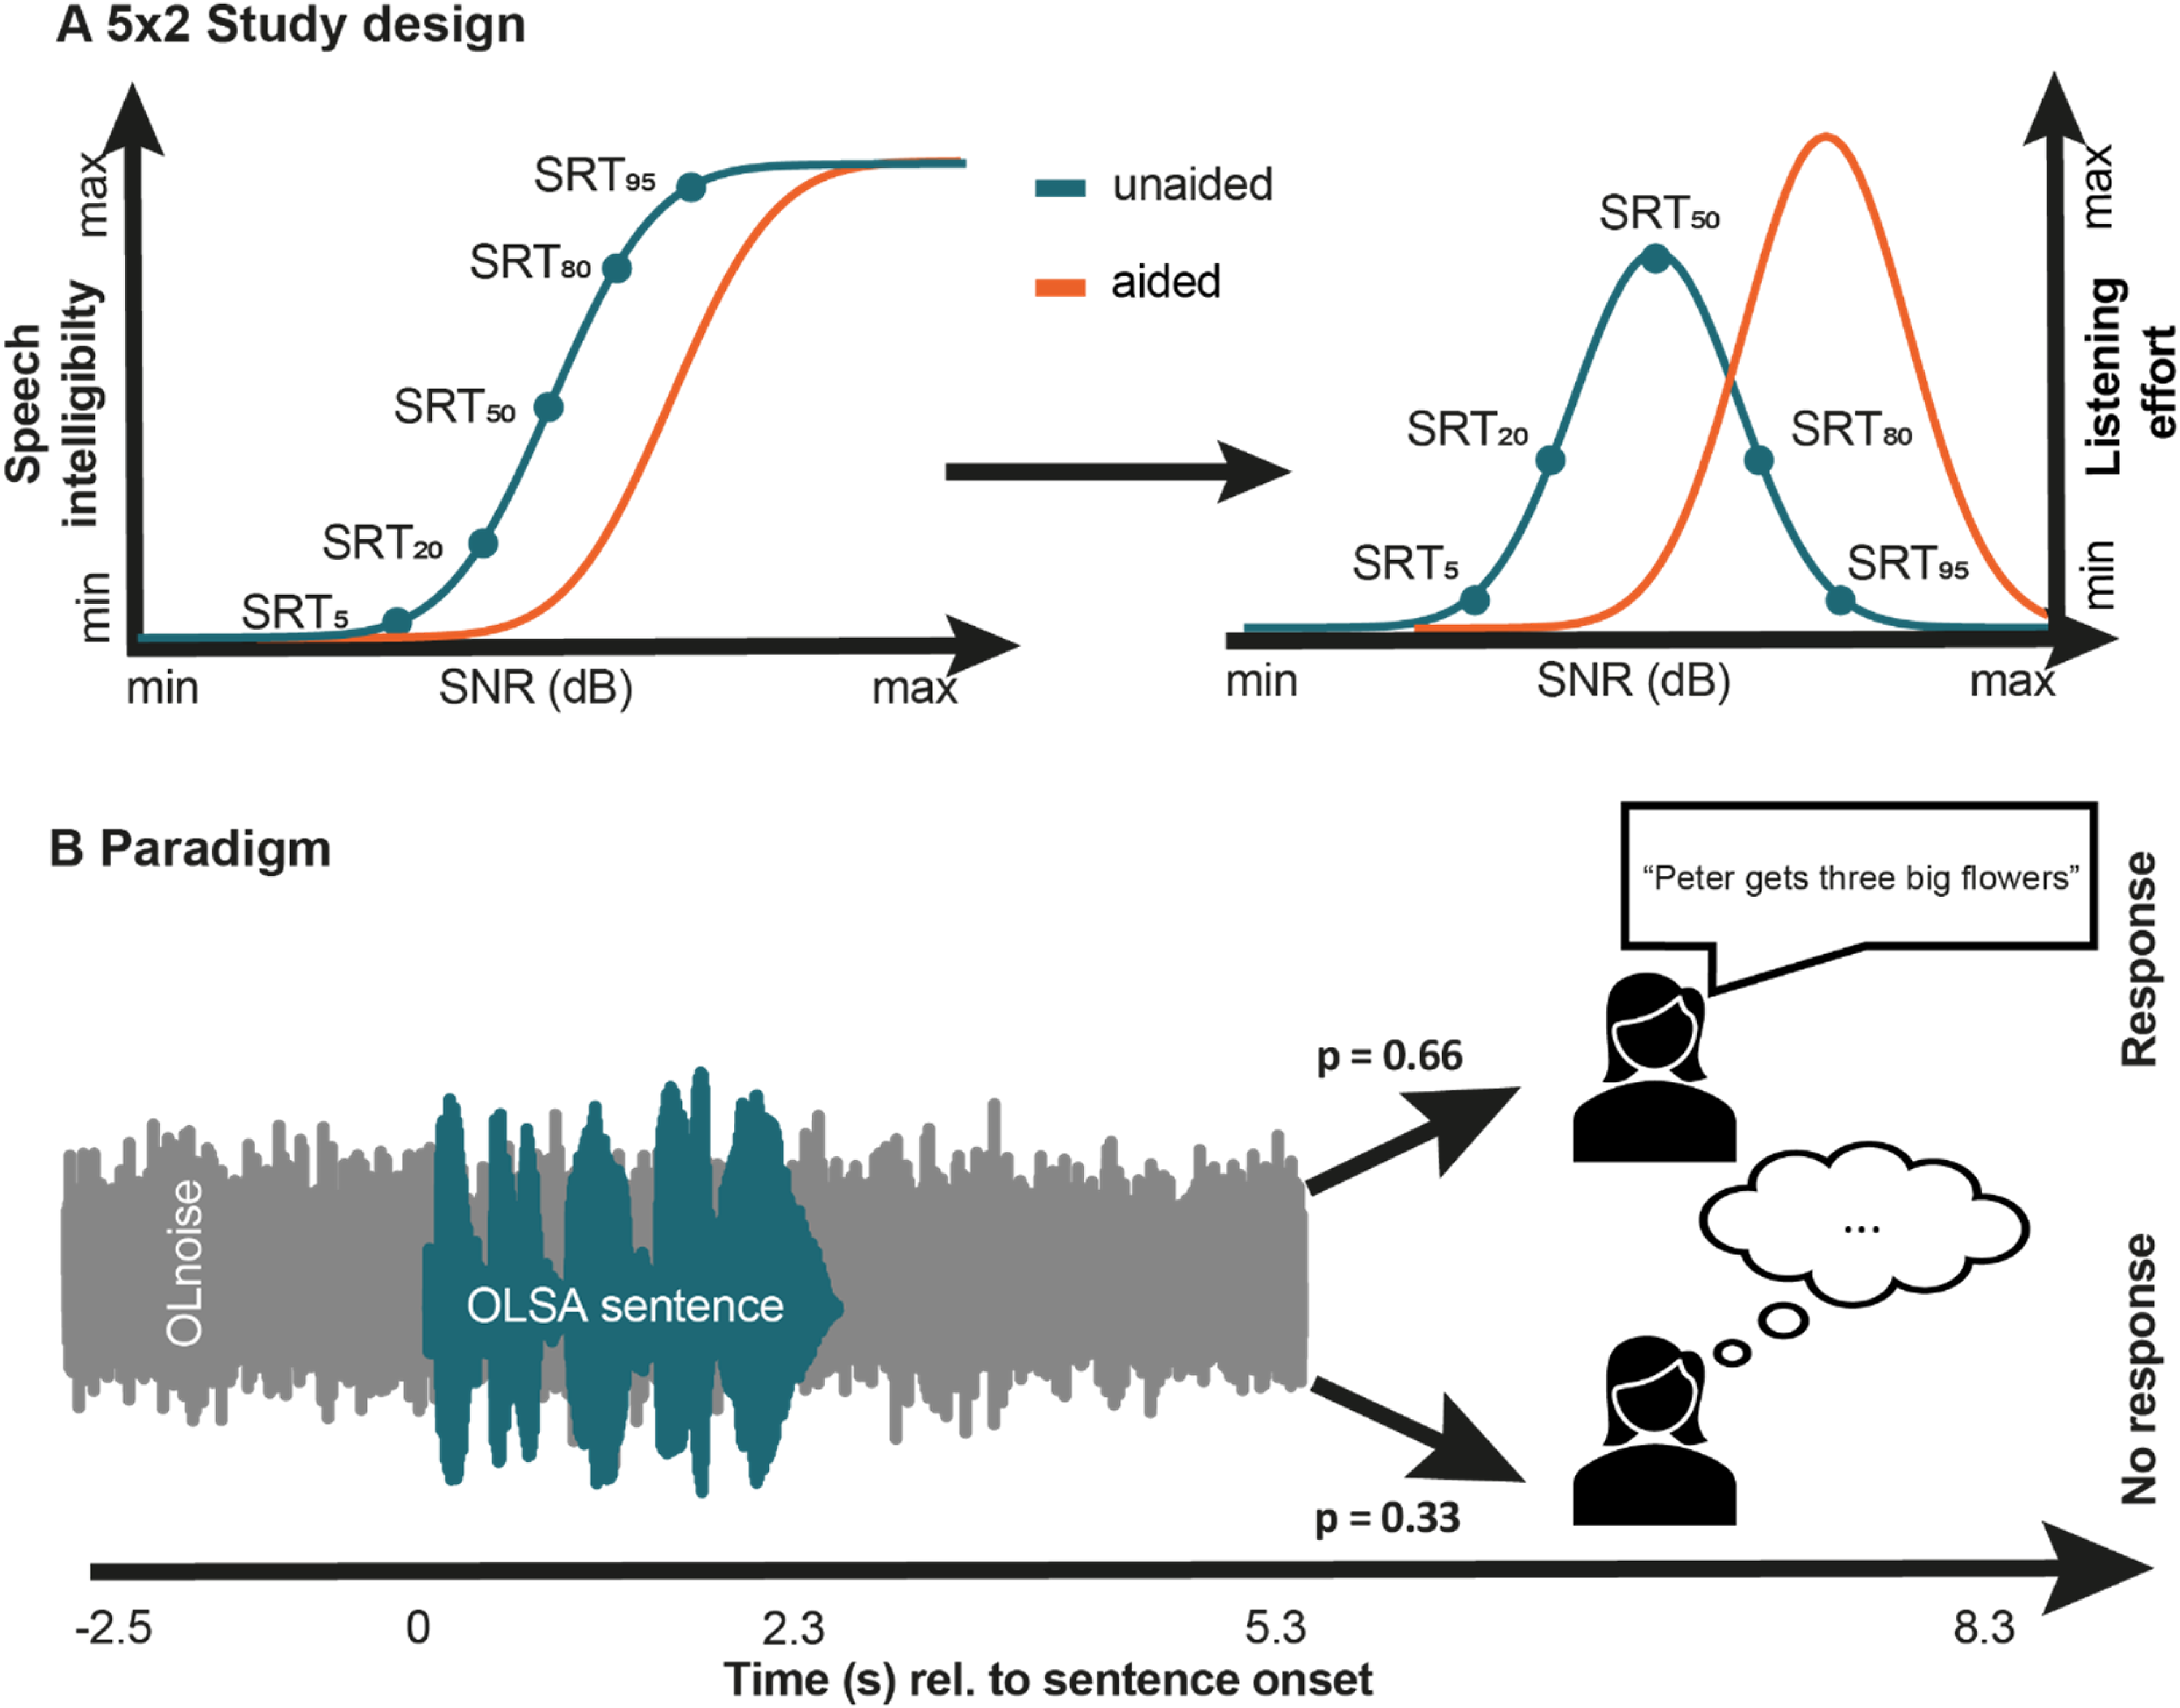
Study Design and Study Paradigm. A, Study Design and Hypothesised Results. Individual Speech Intelligibility was Prespecified for 5 Levels (SRT5, SRT20, SRT50, SRT80 and SRT95), Both Unaided and Aided. An Adapted OLSA was then Performed While Two Indicators of Objective Listening Effort (Pupil Size and Parietal Alpha Power) were Recorded. Based on our Preliminary Study by Denk et al. (2024), We Expect a Shift in the SNR for Speech Intelligibility as Well as for Listening Effort. Furthermore, Due to the Increased Experienced Effort Observed in our Preliminary Study, We Hypothesize that the Invested Listening Effort is Additionally Elevated, Which Would be Reflected in a Higher Peak in Objective Listening Effort. For Visual Reasons, The Levels Were only Drawn for the Unaided Condition. B, Trial Design. Subjects Performed an Adapted OLSA. The Noise (Olnoise) was Played Continuously During a Trial. The Sentence was Embedded in a Pre-Sentence Pause (Mean 2.27 S, Right-Skewed Function) and a Post-Sentence Pause (Mean 2.98 S, Right-Skewed Function). On Average 5.3 S after Sentence Onset, Subjects were Asked to Repeat the Sentence in 2/3 of the Trials.
Pupil Data Recording and Processing
Pupil data was continuously recorded from the right eye (500 Hz sampling rate) using an Eyelink 1000 Plus (SR Research Ltd., Ottawa, Canada) and pre-processed according to guidelines of Geller et al. (2020) realized with a custom written toolbox in Matlab (MathWorks, Natick, USA). Blinks were automatically detected by the Eye-Link device and were marked as missing values. Owing to the effects of eyelid closure on pupil size, gaps of missing data were extended to 100 ms before and 100 ms after the gap. Trials with more than 20 percent missing data were excluded. Missing values were interpolated linearly and afterwards, data were smoothed by a 4 Hz (Butterworth, fourth-order filter) low-pass filter. Furthermore, by usage of a median absolute deviation (constant of 16), rapid pupil size interferences were removed. Finally, pupil traces were segmented into trials ranging from −3 to 10 s relative to listening task onset, down-sampled to 50 Hz and averaged for each condition and participant. All averaged pupil traces were visually verified for shape and amplitude by the experimenter.
The resulting trial was then divided by the mean pupil size in the period from −0.25 to 0 s (see Figure 1 for timeline) and converted into a percentage pupil dilation. For the purposes of analysis, the pupil size was averaged over the time window from 2.4 to 3.4 s after sentence onset, separately for each participant and condition. This window was chosen so that the mean pupil dilation across all subjects and conditions is covered.
The averaged pupil values, corresponding to different levels of speech intelligibility, were fitted with quadratic functions of the form ax2 + bx + c for both the aided and unaided conditions for each participant. We aimed to use a fit that accurately represented the data while remaining simple, and the quadratic fit effectively captured the robust mean pupil values. Subsequently, the maximum value of the quadratic functions, the quadraticity coefficient and the location of the function maximum in terms of speech intelligibility were statistically compared between the unaided and aided conditions.
Electroencephalography (EEG)
The EEG signals of the subjects were captured using 64 electrodes (ActiChamp, Brain Products, Gilching, Germany) at a sampling frequency of 1,000 Hz, with the reference electrode placed at TP9 (280 Hz online low-pass filter). EEG data underwent analysis utilizing the FieldTrip toolbox (version 2019–09-20; Oostenveld et al., 2011) in Matlab (MathWorks, Natick, USA). The data were re-referenced to the average of all electrodes, high-pass filtered at 0.7 Hz (Hann window, length of 2391 points), and low-pass filtered at 100 Hz (Hann window, length of 89 points). Additionally, a 50 Hz elliptic band-stop filter was applied to eliminate power line interference.
Independent Component Analysis (ICA) was performed to eliminate artifacts stemming from blinks, lateral eye movements, and muscle activity. The data were segmented into 1-s intervals, and segments containing atypical artifacts were excluded based on visual examination prior to conducting ICA. Prior to the ICA process, noisy channels were eliminated. Artifact components were identified through visual inspection. The pre-processed continuous data were transformed into ICA space using the unmixing matrix derived from the 1-s segments used for ICA computation. Components previously recognized to contain artifacts were eliminated, and the mixing matrix was utilized to revert the data to the original 64 EEG channels. Noisy channels that were removed prior to ICA were interpolated post-ICA by averaging neighbouring channels. Subsequently, the data underwent low-pass filtering at 30 Hz (Hann window, 111 points) and was segmented into 18.0-s trials (from −5.5 to 12.5 s time-locked to the speech onset). The data were then sampled down to 250 Hz, and trials exhibiting a signal change of >200 µV across the entire epoch were excluded from further analyses (Kraus et al., 2023a).
In the analysis of oscillatory activity, individual EEG signals in the time domain were convolved with Morlet wavelets. Complex wavelet coefficients were computed for frequencies spanning from 1 to 30 Hz at intervals of 0.5 Hz and a time range from −3 to 10 s time-locked to noise onset, separately for each trial, electrode, and participant. Power was determined by squaring the absolute value of the complex wavelet coefficients, individually for each trial, electrode, and time-frequency bin. Time-frequency power representations were subsequently averaged across trials for each condition. The power values were baseline corrected to decibel power change by dividing the trial-averaged data at each time point by the mean power during the baseline time window (−0.25 to 0 s) and then log-transformed. The selection of the baseline time window, akin to the baseline time window for pupil size, aimed to mitigate the influence of visual stimuli on the baseline data.
Given our specific interest in changes in alpha power, we computed alpha power time courses by averaging the spectral power of frequencies ranging from 8 to 12 Hz. Alpha power has a better temporal resolution and a lower latency than the other physiological measures, so we focused the analysis on a slightly different time period than for the pupil. Therefore, power was averaged across parietal electrodes (PO5, PO3, PO1, POz, PO2, PO4, PO6, CP5, CP3, CPz, CP2, CP4, CP6, P5, P3, P1, Pz, P2, P4, P6) and across a 1.2–3.2 s time window post speech onset. This window was chosen so that the mean parietal alpha power across all subjects and conditions is covered.
The mean parietal alpha power values associated with various levels of speech intelligibility were modelled using quadratic functions of the form ax2 + bx + c for both the aided and unaided condition for each participant. We sought a simple yet accurate fit, with the quadratic fit effectively capturing the robust mean parietal alpha power values. Following this, the maximum value of the quadratic functions, the quadraticity coefficient and the peak location of the function in terms of speech intelligibility were statistically analysed and compared between the unaided and aided condition.
Association Between Pupil Size and Parietal Alpha Power
A linear mixed model was implemented in R (version 4.0.1) using the lme4 and sjPlot packages to investigate the relationship between pupil size and parietal alpha power. The goal was to predict pupil size based on the fixed effects of parietal alpha power and speech intelligibility. Speech intelligibility was modelled with a quadratic effect, as it is generally assumed that measures of listening effort exhibit an inverted U-shaped relationship with intelligibility/task demand.
We included participant-specific random intercepts to account for individual differences in both pupil size and parietal alpha power. Pupil size was defined as the mean baseline-corrected values within the time window of 2.4 to 3.4 s after sentence onset for each participant, averaged within speech intelligibility and listening condition (unaided and aided). Similarly, parietal alpha power was calculated within the 1.2 to 3.2 s post-sentence onset window.
The resulting statistical model took the following form:

Hearing aid
We utilized the Portable Hearing Lab (PHL) as our hearing aid device, chosen for its detailed documentation and comprehensive control over all functions, making it more suitable for our research than commercial devices (Denk et al., 2022; Kayser et al., 2022; Pavlovic et al., 2020). The PHL ran on software equivalent to the default firmware image (MAHALIA 4.16.0-r1, http://mahalia.openmha.org/), with all standard hearing aid processing features (e.g., feedback reduction, coherence-based noise reduction, multi-band dynamic compression) disabled.
Signal processing involved an overlap-add-based filter bank with 55 samples at a 24 kHz sampling rate, which enabled individual gain adjustments for each frequency bin using the “equalize” plugin. The PHL was coupled to the ear canal using custom-modified foam earplugs, which incorporated a 20-mm long sound tube with a 2 mm inner diameter for inserting the hearing aid receiver. This closed coupling design minimized direct sound leakage into the ear canal, ensuring consistent results across participants. Setting the gain to transparency (i.e., same sound pressure level before the eardrum with and without the hearing aid) was achieved by an in-situ fitting.
Probe tube microphones were placed into the ear canal to adjust and verify the hearing device settings. This procedure encompassed two primary tasks. First, we ensured a closed fit by assessing passive attenuation relative to the unaided condition, aiming for a real-ear occluded insertion gain (REOIG) of at least 10 dB across all third-octave bands from 500 Hz to 4 kHz. Second, we individually programmed the device gains to minimize the level difference between the aided and unaided conditions, achieving a real-ear insertion gain (REIG) with a linear setting, or a compression ratio of 1:1. Our requirement was to keep the difference below 5 dB across all third-octave bands from 200 Hz to 8 kHz, measured with pink noise at 70 dB SPL.
Results
Speech Intelligibility
Figure 2A presents the fitted psychometric functions from our main experiment, averaged across both sessions with standard error. From this data, the SRT50 and hearing aid disadvantage at SRT50 were determined (mean and standard error; Figure 2B). Additionally, data from Denk et al. (2024) is shown for comparison. The hearing aid disadvantage at SRT50 is defined as the absolute difference between the SRT50aided and SRT50unaided. Generally, participants in Denk et al. (2024) performed slightly better (i.e., lower SRTs), but the hearing aid disadvantage was comparable between the studies. The average SRT50 for this experiment was −6.8 dB unaided and −6.4 dB aided with a slope of 14.1% (unaided) and 14.6% (aided) per dB SNR around the SRT50, resulting in an average hearing aid disadvantage of around 0.4 dB. Normal distribution of the hearing aid disadvantage was verified using the Shapiro–Wilk test, and then the values were compared with one sided t-tests against zero. Effect sizes for t-tests are reported as Cohen's d (Cohen, 1988). Results showed highly significant differences (t(18) = 3.50; p = 0.003; d = 0.80) for the present study and for the study of Denk et al. (2024) (t(18) = 3.46; p = 0.003; d = 0.79).
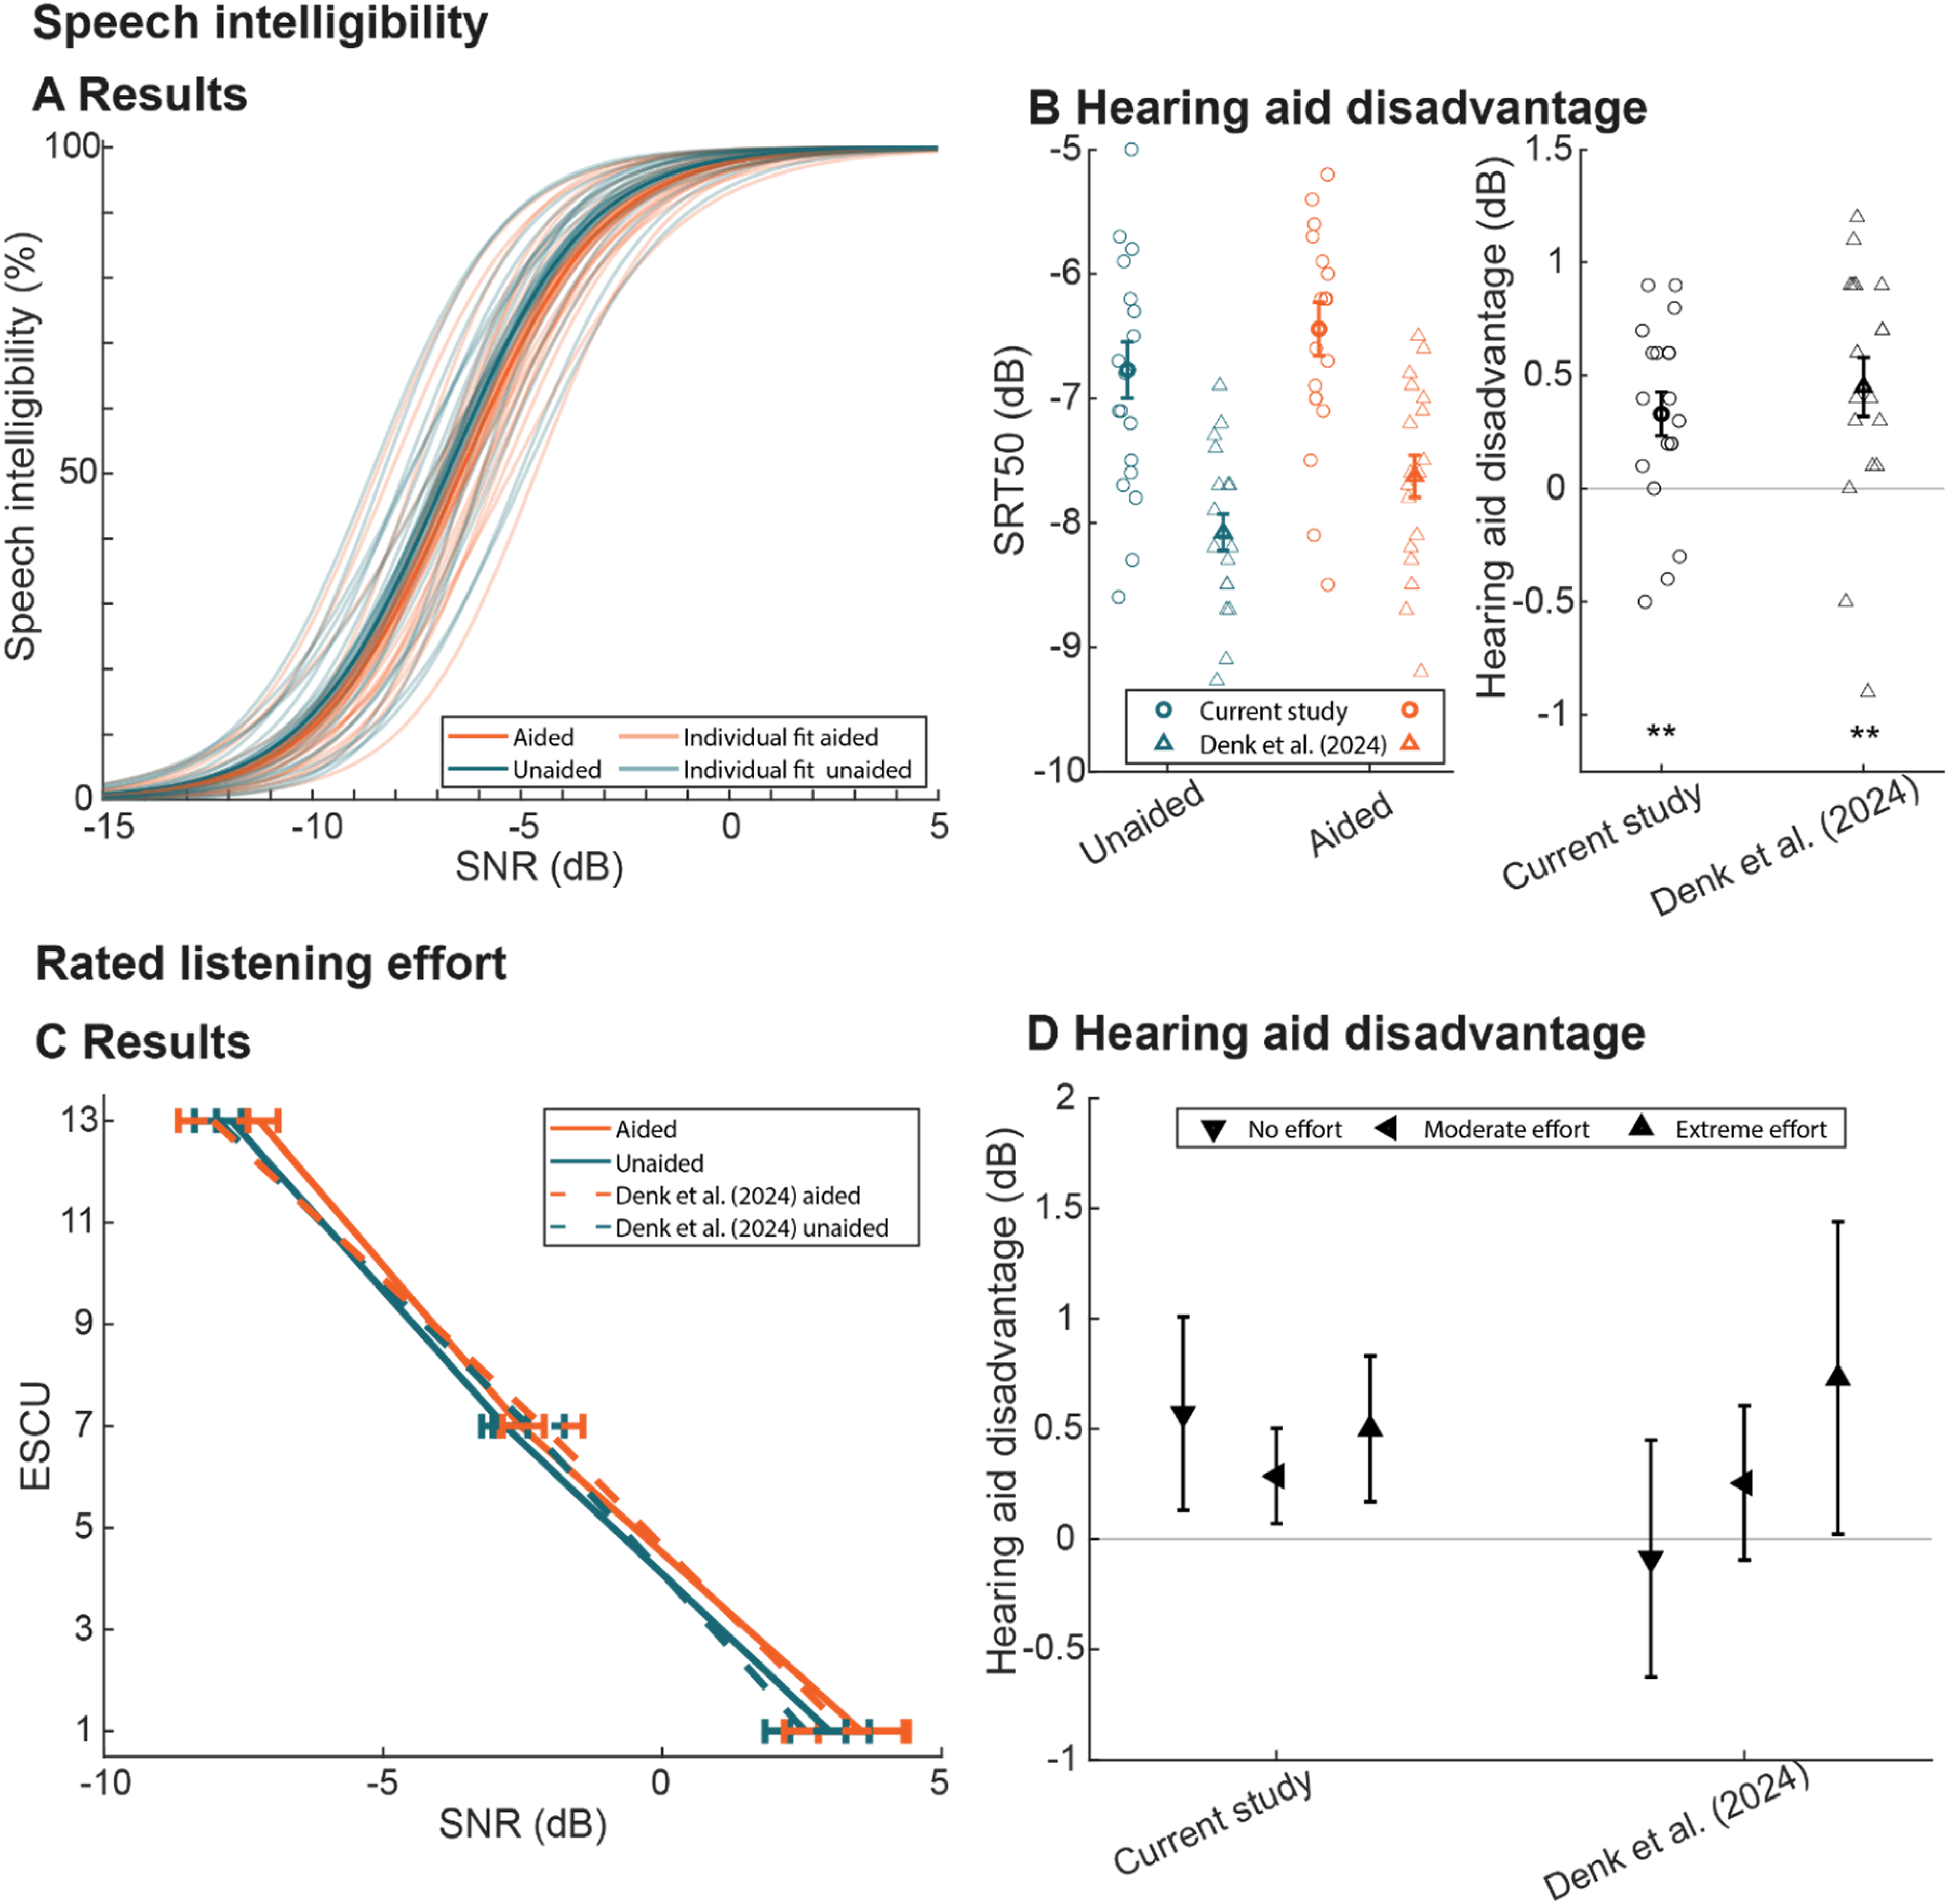
Behavioural Data Results. A, Fitted Psychometric Functions for Speech Intelligibility Obtained from the Main Experiment in the Unaided and Aided Condition. Thin Lines Denote Results from Individual Participants, Thick Lines Arithmetic Averages with Standard Errors as Error Bands. B, Left: Srts for Individual Participants as Thin Markers and Mean with Standard Errors as Thick Markers. Right: Hearing Aid Disadvantages Regarding SRT Showing Individual Subjects as Thin Markers and Mean with Standard Error as Think Markers Based on Individually Determined SRT Values. C, Rated Listening Effort Scaling (ESCU) Results for Aided and Unaided Conditions as Mean with Standard Errors. D, Hearing Aid Disadvantage Regarding Rated Listening Effort Showing Mean and Standard Error Across Participants.
Rated Listening Effort
Figure 2C illustrates the average of the fitted ACALES functions. Here, the values for ESCU 1, 7, and 13 were extracted and linearly interpolated between these points. Overall, a shift towards more positive SNRs due to the hearing aid is observed, indicating a hearing aid disadvantage. In Figure 2D, the hearing aid disadvantage for the aforementioned ESCU values is plotted as means with standard errors, along with comparison data from Denk et al. (2024). Most values are above zero, except for ESCU 1 in Denk et al. (2024). The hearing aid disadvantage is defined as the absolute difference between the SNRs of corresponding ESCU aided and unaided. Normality of the hearing aid disadvantage distribution was verified using the Shapiro–Wilk test. A series of one-sided t-tests, corrected with Bonferroni adjustments, showed neither for the present study nor for data of Denk et al. (2024) significant differences from zero (see Figure 2D).
Pupil Size
Figure 3A shows the temporal course of pupil size relative to the onset of the OLSA sentence differentiated by unaided and aided (averaged across all speech intelligibilities) as well as the analysis window. An evoked pupil response can be seen approximately 2.7 s after the sentence onset and at the verbal response. In Figure 3B, the mean values for the displayed analysis window are shown, categorized by speech intelligibility and listening conditions, along with the fitted quadratic functions. It can be observed for both the unaided and aided listening conditions that the pupil dilation form an inverted U shape (with the maximum at 50% speech intelligibility). At the same time, an increase in the mean values (20, 50, and 80% speech intelligibility) is evident for the aided listening condition. From the fitted quadratic functions, the maximum value, the quadratic coefficient, and speech intelligibility at the maximum value were individually determined for each subject in aided and unaided conditions (see Figure 3C). The normal distribution of these values was verified with a Shapiro-Wilk test, and then the values were compared with a two-sample t-test. Effect sizes for t-tests are reported as Cohen's d (Cohen, 1988). The maximum for the aided listening condition was significantly higher (t(18) = −10.72; p < 0.001; d = −2.46) as well as the quadratic coefficient (t(18) = 9.31; p < 0.001; d = 2.14). The locations of the maxima, both very close to 50% intelligibility, did not differ significantly.

Pupil Size Results. A, Pupil Size Time Courses Averaged Across Participants and Speech Intelligibilities per Listening Condition. Error Bands Reflect the Single Subject Standard Error. Gray Area Before Sentence Onset Reflects the Baseline Window. B, Averaged Data per Speech Intelligibility and Listening Condition with Single-Subject Standard Error for A 2.4 S To 3.4 S Time Window as Well as the Fitted Quadratic Functions. Thin Lines Denote Fitted Functions from Individual Participants, Thick Lines Mean Quadratic Functions Across Participants. C, 45-Degree Scatter Plots. The 45° Line Indicates No Difference Between Conditions. Dots Show Data of Individual Participants. Left, Maximum Value Derived from the Fitted Quadratic Function. Middle, Location of Maximum Value Derived from Quadratic Function. Right, Quadratic Coefficient. Histograms Show the Distribution of the Absolute Hearing Aid Disadvantage (Aided Minus Unaided) Across All Participants.
Parietal Alpha Power
Figure 4A illustrates the temporal course of parietal alpha power relative to the onset of the OLSA sentence, differentiated by unaided and aided conditions (averaged across all speech intelligibilities) and the analysis window. An increase in parietal alpha power is observed approximately 1.7 s post-sentence onset. Figure 4B presents the mean values within the displayed analysis window, organized by speech intelligibility and listening conditions, along with the corresponding fitted quadratic functions. Both unaided and aided listening conditions exhibit an inverted U-shaped pattern in parietal alpha power, peaking at 50% speech intelligibility. Additionally, an increase in mean values (20, 50, and 80% speech intelligibility) is noted for the aided listening condition. From the fitted quadratic functions, the maximum value, the quadratic coefficient, and corresponding speech intelligibility at the maximum were determined individually for each subject in both aided and unaided conditions (see Figure 4C). The normal distribution of these values was confirmed using a Shapiro-Wilk test, followed by a comparison using a two-sample t-test. Effect sizes for t-tests are reported as Cohen's d (Cohen, 1988). The maximum parietal alpha power for the aided listening condition was significantly higher (t(18) = −2.28; p = 0.03; d = −0.52), while the quadratic coefficient shows a tendency (t(18) = 1.80; p = 0.08; d = 0.41). The location of the maximum did not show significant differences.

Parietal Alpha Power Results. A, Parietal Alpha Power Time Courses Averaged Across Participants and Speech Intelligibilities per Listening Condition. Error Bands Reflect the Single-Subject Standard Error. Gray Area Before Sentence Onset Reflects the Baseline Window. B, Averaged Data per Speech Intelligibility and Listening Condition with Single Subject Standard Error for A 1.2 S To 3.2 S Time Window as Well as the Fitted Quadratic Functions. Thin Lines Denote Fitted Functions from Individual Participants, Thick Lines Mean Quadratic Functions. C, 45-Degree Scatter Plots. The 45° Line Indicates No Difference Between Conditions. Dots Show Data of Individual Participants. Left, Maximum Value Derived from the Fitted Quadratic Function. Middle, Location of Maximum Value Derived from Quadratic Function. Right, Quadratic Coefficient. Histograms show the Distribution of the Absolute Hearing Aid Disadvantage (Aided Minus Unaided) Across all Participants.
Association Between Pupil Size and Parietal Alpha Power
To assess the association between pupil size and parietal alpha power, the averaged pupil values were used as the dependent variable in a linear mixed model. Speech intelligibility exhibited a significant positive linear effect (ß = 25.90, SE = 2.30, t = 11.28, p < 0.001) and a significant negative quadratic effect (ß = −23.44, SE = 2.21, t = −10.60, p < 0.001). This indicates that pupil size increases with speech intelligibility up to a certain point and decreases at higher levels of intelligibility (inverse U-shape). Additionally, parietal alpha power also had a significant positive effect (ß = 0.35, SE = 0.13, t = 2.66, p = 0.009), meaning that higher parietal alpha power is associated with larger pupil size. Given the effect sizes, speech intelligibility has a greater impact on pupil size than parietal alpha power. Figure 5 illustrates the predicted pupil size as a function of speech intelligibility and parietal alpha power.

Association between Pupil Size and Parietal Alpha Power. Lines Denote the Predicted Pupil Size per Parietal Alpha Power Separated by SRT. Error Bands Display The 95% Confidence Interval Predicted by the Linear Mixed Model.
Discussion
In the present study, we investigated the effect of task difficulty (i.e., different SNRs) and an acoustically transparent hearing system on speech intelligibility as well as subjective and physiological measures of listening effort (rated listening effort, pupil size, and parietal alpha power) in normal-hearing listeners.
As expected, speech intelligibility improved with better SNR, and rated listening effort decreased. In contrast, the physiological measures of listening effort followed an inverted U-shaped pattern (i.e., they increased with better SNR up to a medium level of speech intelligibility and then decreased at higher levels of intelligibility).
The use of an acoustically transparent hearing device significantly decreased speech intelligibility. No significant differences were observed in rated listening effort. However, both pupil size and parietal alpha power increased when using the acoustically transparent hearing device. The effect on the physiological measures was larger than on speech intelligibility, suggesting that listening effort assessed with physiological measures appears to be more sensitive to the parasitic effects of hearing aids.
Speech Intelligibility and Subjective Listening Effort Ratings
The present results concerning speech intelligibility (see Figure 2B) excellently reproduced the findings of our previous work (Denk et al., 2024). Compared to the condition by Denk et al. (2024), where the hearing aid was not individually equalized, the hearing aid disadvantage decreased from approximately 1 dB to around 0.4 dB. It should be noted, however, that Denk et al. (2024) used a slightly different noise level of 65 dB.
Despite the individual equalization of the hearing aids, a statistically significant hearing aid disadvantage of approximately 0.4 dB remains. The exact reasons for this are still unclear but underline the parasitic effects of hearing aids (Brungart et al., 2007; Cubick et al., 2018; Schepker et al., 2020). Utilizing the sound quality model from Biberger et al. (2018) in our previous work (Denk et al., 2024), it is still hypothesized that the deterioration in speech intelligibility is due to reduced sound quality. Additionally, individual equalization does not result in the exact matching of the sound pressure waveform at the eardrum between aided and unaided conditions. This mismatch could also contribute to the remaining hearing aid disadvantage of around 0.4 dB as we know from our previous work that a better equalization results in a smaller hearing aid disadvantage (Denk et al., 2024). Given the approximate slope of 14%/dB, the hearing aid disadvantage of 0.4 dB is estimated to result in a deterioration in speech intelligibility of approximately 6%. While this value may appear relatively minor, future research should continue to investigate the underlying causes of this phenomenon to identify potential avenues for its elimination.
The results of the subjective listening effort ratings (see Figure 2C and 2D), measured using the ACALES procedure, are also comparable to our previous work (Denk et al., 2024). On average, there is a hearing aid disadvantage of 0.4 dB. However, in contrast to speech intelligibility, none of the evaluated ESCU values (no effort, moderate effort, extreme effort) were statistically significant. This could either be due to the absence of a hearing aid disadvantage effect on subjective listening effort ratings or because the method used is not sensitive enough in this context to detect such a hearing aid disadvantage.
Effect of Task Demand on Invested Listening Effort
In our experiment, both pupil size (see Figure 3B) and parietal alpha power (see Figure 4B) followed an inverted U-shape independent of the listening condition (unaided and aided), with the maximum occurring at moderate task difficulties. This finding aligns with previous research (Kuchinsky & Vaden, 2020; Ryan et al., 2022; Zekveld & Kramer, 2014). For tasks that are nearly unsolvable or very easy, we observed either no or only minimal changes in pupil responses and parietal alpha power. When a task becomes insurmountably difficult, individuals cease to invest effort and tend to give up, as the cost-benefit ratio becomes disproportionate and the probability of successfully completing the task is very low (Francis & Love, 2020; Ohlenforst et al., 2018; Wendt et al., 2016; Zekveld & Kramer, 2014). Conversely, when a task is very easy or even too easy, it may be completed, but no significant effort is invested, as individuals tend to become bored and under-challenged (Herrmann & Johnsrude, 2020; Westergate and Wilsen, 2018). This characteristic of invested effort contrasts with experienced effort, where a task is only perceived as effortless after performance has been in the saturation zone for a considerable period (Denk et al., 2024; Eckert et al., 2016; Krueger et al., 2017).
Effect of Transparent Hearing Aids on Invested Listening Effort
Regarding the effect of transparent hearing aids, we observed an increased maximum of our fitted quadratic functions in pupil size (see Figure 3C, left) and parietal alpha power (see Figure 4C, left), but no significant shift in the location of the maximum (see Figures 3C and 4C, middle). In addition, the quadraticity of our fitted pupil function increased significantly when using the transparent hearing aid (see Figure 3C, right), while parietal alpha power showed only a tendency to increase in the aided condition. The increase in the maximum and the quadraticity indicates that individuals need to invest more effort to achieve the same level of speech intelligibility. Furthermore, the effect is larger for invested listening effort than for speech intelligibility. To compare these different measures, we want to relate the hearing aid disadvantage of all results to the task demand, i.e., speech intelligibility. Given a slope of approximately 14%/dB for the OLSA in our data, the hearing aid disadvantage of 0.4 dB corresponds to a decrease in speech intelligibility of about 6%. For the subjective rating of listening effort, we see a similar difference (see Figure 2D) which was, however, statistically not significant.
Pupil size and parietal alpha power showed the inverse U-shape with a maximum around 50% speech intelligibility (see Figure 3C and 4C, middle). In the aided condition, the maximum of the unaided condition is reached around 20% or 80% (22% / 81% pupil size and 23% and / 82% alpha power) speech intelligibility which is a difference of approx. 30% in terms of speech intelligibility. This is a much higher deterioration compared to subjective ratings on listening effort (see Figure 2D) or the direct measure of speech intelligibility (see Figure 2B). Although the quadraticity for the parietal alpha power demonstrated only a trend, we are confident in stating that it reflects the impact of increased effort by a transparent hearing aid on pupil size and parietal alpha power. However, there appear to be slight differences between parietal alpha power and pupil size. In general, the larger the absolute value of the quadratic coefficient in a quadratic equation is, the more peak-like the appearance of the resulting function. In the context of our experiment, a peak-like function indicates greater sensitivity to speech intelligibility.
Regarding pupil size (see Figure 3B and 3C), the function is both shifted upwards by the transparent hearing aid (as indicated by the significantly higher maximum value) and becomes narrower (as indicated by the significantly larger quadratic coefficient). For parietal alpha power (see Figure 4B and 4C), the function is also shifted upwards by the transparent hearing aid (as indicated by the significantly higher maximum value), but the peaking effect is weaker (as indicated by the insignificant trend for the quadratic coefficient). As a result of these two observations, it can be concluded that the dependency on changes in task difficulty, and thus speech intelligibility, increases more strongly for pupil size than for parietal alpha power when using a transparent hearing aid. We also hypothesize that the hearing aid disadvantage in invested listening effort is at least partially due to poor sound quality and imperfect equalization for the unaided ear. A reduction in sound quality and the subsequent subjective distortion can result in an increase in pupil size and alpha power (e.g., Obleser & Weisz, 2012; Winn et al., 2015). Additionally, it is possible that for normal-hearing participants, the unfamiliar experience of using hearing aids potentially combined with distortions in sound quality might introduce additional stress, reflected in increased invested listening effort, as indicated by increased pupil size and parietal alpha power. This lack of habituation could lead to increased cognitive load, as the brain must adapt to a new and altered auditory input. The question of whether the effect is due to the unfamiliarity of wearing something unknown, caused by distortions, or a combination of both requires further investigation. Although effects of unfamiliarity may influence our results, we specifically chose normal-hearing participants to replicate previous findings more reliably and because they are most sensitive to signal distortions, a key factor in hearing aid disadvantage. Moreover, the ‘transparent’ modes in hearables are primarily designed for normal-hearing users. Most importantly, in individuals with hearing loss, the benefits of amplification may mask or outweigh hearing aid disadvantages, making their precise measurement challenging. By studying normal-hearing participants, we sought to better understand the limitations of amplification and determine the threshold at which its benefits begin to surpass its drawbacks. Our findings suggest the existence of hearing aid disadvantage not only in speech intelligibility but also invested listening effort to a greater extent.
The results of pupil size and parietal alpha power also suggest that hearing aid disadvantage only occurs with moderate task difficulties, but not with almost unsolvable or very easily solvable tasks. The reasons for this may lie primarily in the aforementioned effect that no effort is being invested when a task is too difficult or negligibly easy (Herrmann & Johnsrude, 2020; Ohlenforst et al., 2018; Wendt et al., 2016; Zekveld & Kramer, 2014
Association Between Pupil Size and Parietal Alpha Power
In our linear mixed model, in addition to the significant quadratic effect of speech comprehension, we also found a significant positive linear relationship between pupil size and parietal alpha power (see Figure 5). This indicates that parietal alpha power has an explanatory effect here, over and above the speech intelligibility effects. This finding contrasts with some recent studies where pupil size and alpha power did not necessarily associate (Alhanbali et al., 2019; McMahon et al., 2016; Miles et al., 2017; Seifi Ala et al., 2020).
A lack of association between pupil size and alpha power has often been attributed to the fact that the two measures reflect different underlying aspects of multidimensional listening effort. The FUEL model by Pichora-Fuller et al. (2016) suggests that the presence of perceptual deficits, such as those caused by speech in noise, is a factor leading to increased effort. Building on Kahneman’s (1973) attention model, which posits that multiple dimensions govern the allocation of cognitive resources for task management, Pichora-Fuller et al. (2016) hypothesize that different measures of listening effort target different multidimensional attention-related outputs. These include measures of the autonomic nervous system (e.g., pupil size) and changes in brain activity (e.g., alpha power). As a result, it is generally assumed that parietal alpha power and pupil size are based on different resources which end in an unassociated relationship. However, we found a significant and noteworthy relationship between pupil size and parietal alpha power, even after controlling for the obvious confound of intelligibility level.
Understanding speech in challenging situations like loud noise requires multiple resources. According to the MoLE model by Herrmann and Johnsrude (2020), the interaction of various resources can benefit speech comprehension. At the same time, these resources can compensate for each other, allowing the task to be completed even if the limit of one resource is exceeded. It is quite feasible that different resources were required to solve our experimental task as well, which could explain the observed association.
Subjective Listening Effort vs. Invested Listening Effort
The maximum value of the ACALES scale (extreme effort) corresponds approximately to the SRT50 in both our experiment (see Figure 2B and 2C) and the reference data from Krueger et al. (2017). At SRT50, the highest hearing aid disadvantage was observed for both pupil size and EEG as measures of invested listening effort (see Figure 3C and 4C, left). It is strongly suspected that invested effort and subjective listening effort ratings represent different dimensions of the elusive construct of listening effort (Francis & Love, 2020; Herrmann & Johnsrude, 2020; Pichora-Fuller et al., 2016). The two other evaluated values (moderate effort and no effort) fall within the saturation region of speech intelligibility. According to our results, we do not expect to observe any hearing aid disadvantage in this region either. It should be noted that the method used here is particularly sensitive in areas where speech comprehension exhibits ceiling effects (Krueger et al., 2017).
Conclusions
We evaluated the effect of transparent hearing aids on speech intelligibility, subjective ratings of listening effort, and physiological markers of invested listening effort. A consistent hearing aid disadvantage was observed in terms of speech intelligibility and invested listening effort, as indicated by pupil size and parietal alpha power. We hypothesize that this hearing aid disadvantage is primarily due to inadequate equalization for the open ear and impaired sound quality. The comparison between speech intelligibility, subjective ratings of listening effort, and invested listening effort (i.e., pupil size and parietal alpha power) as measures for hearing aid disadvantage clearly shows that invested listening effort was most sensitive. Hence, future research on these ‘parasitic’ effects should place greater emphasis on invested listening effort. In scenarios where performance measurements and subjective effort assessments are imprecise or ineffective, these metrics can provide valuable insights. Furthermore, the present results show that physiological markers may be a valuable tool for research on transparency in hearing devices. The observed positive association between pupil size and parietal alpha power indicates that the allocation of different resources can potentially support and balance each other when a complex auditory task is being completed.
Footnotes
Acknowledgements
The authors thank all participants for their time and patience during these measurements; the auditory cognition group for their help in setting up the experiment and providing their facilities; Robin Weiß, Nikolai Dürrbeck, and Luca Wiederschein for their help with data acquisition; and the Hörzentrum Oldenburg for providing the sound files of the OLSA material.
Declaration of Conflicting Interests
The authors declared no potential conflicts of interest with respect to the research, authorship, and/or publication of this article.
Funding
The authors received no financial support for the research, authorship, and/or publication of this article.