
Abstract
Pupillometry data are commonly reported relative to a baseline value recorded in a controlled pre-task condition. In this study, the influence of the experimental design and the preparatory processing related to task difficulty on the baseline pupil size was investigated during a speech intelligibility in noise paradigm. Furthermore, the relationship between the baseline pupil size and the temporal dynamics of the pupil response was assessed. The analysis revealed strong effects of block presentation order, within-block sentence order and task difficulty on the baseline values. An interaction between signal-to-noise ratio and block order was found, indicating that baseline values reflect listener expectations arising from the order in which the different blocks were presented. Furthermore, the baseline pupil size was found to affect the slope, delay and curvature of the pupillary response as well as the peak pupil dilation. This suggests that baseline correction might be sufficient when reporting pupillometry results in terms of mean pupil dilation only, but not when a more complex characterization of the temporal dynamics of the response is considered. By clarifying which factors affect baseline pupil size and how baseline values interact with the task-evoked response, the results from the present study can contribute to a better interpretation of the pupillary response as a marker of cognitive processing.
Introduction
The connection between pupil dilation & cognitive processes was documented as early as the 1800s (Schiff & Foa, 1874, for a historical review see Beatty & Lucero-Wagoner, 2000). Yet, scientific focus on the task-evoked pupillary responses (TEPRs) first truly began in the second half of the 20th century (e.g., Hess & Polt, 1964; Kahneman & Beatty, 1966; Nunnally et al., 1967; Polt & Hess, 1960). These early studies investigated the pupil responses in a myriad of experimental conditions, studying the effects of perception (Kahneman & Beatty, 1967), problem solving (Hess & Polt, 1964), decision making (Simpson & Hale, 1969) or arousal (Bradshaw, 1967), among others. These studies reported changes in the pupil size relative to a baseline value measured before the task of interest under the premise that the pupil response can be separated in two independent components: the baseline pupil size, commonly referred to as “tonic response”, and the TEPR, defined as the pupil changes (i.e., dilations or constrictions) that occur as a result of a specific cognitive task, often associated with a “phasic response”.
Some of these early studies focused on the perception of auditory stimuli e.g., Kahneman & Beatty (1967) measured pupil respones during a pitch discrimination task and Nunnally et al. (1967) explored the pupil's reaction to pure tones presented at different sound pressure levels. However, the use of pupillometry as an indicator of cognitive activity during complex listening tasks, namely speech-in-noise processing, only erupted in the second decade of the 2000s with several studies linking the TEPR to listening effort (e.g. Ohlenforst et al., 2018; Wendt et al., 2016, 2018; Wetzel et al., 2016; Zekveld et al., 2011; see Zekveld et al., 2018 for a thorough review of the literature). Despite the time span and the methodological differences between the state-of-the-art listening effort literature and the earlier studies, listening effort, i.e., the allocation of cognitive resources to the completion of an auditory task (Pichora-Fuller et al., 2016), is still most commonly reported by the peak pupil dilation (PPD) or mean pupil dilation (MPD) extracted from a baseline corrected TEPR. In these studies, the baseline region is defined in a pre-task condition in quiet (e.g., Wetzel et al., 2016) or, more often, in the presence of a simpler acoustic signal e.g., the masker (alone) in a speech-in-noise paradigm (e.g., Ohlenforst et al., 2018; Wendt et al., 2016, 2018). Very few studies have focused on the baseline region and its relation to listening effort (Ayasse & Wingfield, 2020; Alhanbali et al., 2020).
Whereas the TEPR has been widely shown to reflect some level of cognitive processing, the sources of variability of the baseline pupil size remain manifold, such as the pupillary light reflex (e.g., Bradshaw, 1969; Lowenstein & Lowenfield, 1964; Peysakhovich et al., 2015, 2017; Reilly et al., 2019; Steinhauer et al., 2004); tonic arousal (e.g., Gilzenrat et al., 2010; Jepma & Nieuwenhuis, 2011; Murphy et al., 2014); age (Birren et al., 1950; Kasthurirangan & Glasser, 2006; Ko et al., 2011; Piquado et al., 2010) and cognitive abilities (Aminihajibashi et al., 2020; Tsukahara et al., 2016). Tryon (1975) provided an early review of more than twenty sources of variability in pupil size. However, less is known about whether changes in the baseline values might also arise due to task-related parameters, such as mental demand. Several studies showed no evidence of these effects (e.g., Granholm et al., 1996; Trani & Verhaeghen, 2018) while others showed changes in pre-task baselines correlated with task complexity (e.g., Irons et al., 2017; Mosaly et al., 2017; Steiner & Barry, 2011).
The assumption of independence between the baseline pupil size value and the TEPR was first made by Kahneman & Beatty (1967). In their study, where test subjects performed a pitch-discrimination task, a consistent drop in the baseline values (i.e., a constriction in the pupil size) across experimental trials was found, while no decrease in the mean dilation of the TEPR was observed across trials. Bradshaw (1969) tested the hypothesis of independence of the two responses in a controlled manner by manipulating the lighting conditions during an auditory reaction time task, such that the baseline pupil size changed across measurements. He found that this manipulation did not affect the peak amplitude nor the shape of the TEPR. The findings from Bradshaw (1969) were replicated by Xu et al. (2011) using a similar paradigm for arithmetic tasks and by Reilly et al. (2019) for the perception of pure tone transitions and for a visual inspection task at different luminosity levels. In line with these findings, albeit in a less controlled manner, Beatty (1982a) observed no changes in the baseline pupil size for an auditory vigilance task that elicited significant changes in the TEPR. Similarly, Granholm et al. (1996) analyzed baseline values and TEPRs for a digit-recall task and found no correlation between baseline and pupil dilation neither at the recall onset nor during the period where listeners retained the digits in working memory.
In an influential review of the early pupillometry findings, Beatty (1982b) compared the measured peak amplitudes of the baseline-corrected TEPRs across different studies, arguing that the magnitude of the TEPRs during cognitive processing is “independent of baseline pupillary diameter over a physiologically reasonable but not extreme range of values”. Since this formalization of the TEPR as an independent measure from baseline pupil size, baseline correction has been widely accepted as the method to isolate the TEPR, allowing not only for inter-task comparisons, but also to compare across different test subject responses as well as across differences in experimental conditions.
In contrast, work by Peysakhovich and colleagues (Peysakhovich et al., 2015, 2017) showed that the TEPR, as characterized by the mean pupil dilation, was luminance-dependent (and therefore also baseline-dependent) both in short-term memory tasks and multiplication tasks. Similarly, Steinhauer et al. (2004) found a task-by-luminance interaction for a subtraction task at different luminosity levels and a modulation of the TEPR response when the baseline pupil size was altered by using pharmacological and environmental (i.e., luminosity) manipulations. Furthermore, Gilzenrat et al. (2010) found an inverse relationship between baseline pupil size and the magnitude of the TEPR. The findings of these studies, that elevated baselines lead to reduced TEPRs, might indicate adaptative adjustments of the tonic response for performance optimization (i.e., preparatory processing) by the locus coeruleus (LC) as predicted by the adaptive gain theory of tonic and phasic activation of Aston-Jones and Cohen (2005) and are consistent with models of optimal arousal (Aston-Jones et al., 1999; Teigen, 1994; Yerkes & Dodson, 1908).
Despite the contradicting evidence on the relationship between baseline pupil size and TEPR, baseline correction is still the standard in pupillometry literature. The analysis of baseline-corrected TEPRs, implies the assumption of independence between the two periods of the pupil response. Recently, the potential biases introduced in the TEPR by baseline correction were investigated by Mathôt et al. (2018). They found that reported TEPRs varied depending on the accuracy of the baseline calculation, supporting the idea that a relationship exists between baseline values and the TEPR. Several studies have argued for a characterization of the TEPR that bypasses baseline correction (Duchowski et al., 2018, 2020; Peysakhovich et al., 2015), however baseline correction is still prevalent in pupillometry research.
In addition, most studies that investigated the relationship between baseline and TEPR used a limited characterization of the TEPR, with metrics such as the PPD and the MPD. However, despite the practicality of these static measures of the TEPR, they represent only one aspect of the pupillary response. To the knowledge of the authors, a systematical investigation of the relationship between baseline values and the entire time course of the TEPR has not yet been undertaken. With studies proposing measures of the TEPR beyond the PPD and MPD (e.g., Bianchi et al., 2019; Kuchinsky et al., 2013; Mirman et al., 2008; Wendt et al., 2018), it remains to be clarified what the implications of the baseline correction are for the TEPR and how baseline values and the TEPR are related when using a more complex characterization of the response.
The present study investigated the relationship between the baseline pupil size and the temporal dynamics of the TEPR as well as the influence on the baseline pupil size of experimental factors, such as task demand and time-on-task (defined here as the amount of time during which cognitive resources are actively invested on the task). The goal of the study was to clarify whether the assumption of independence between baseline pupil size and baseline-corrected TEPR holds for TEPR metrics that characterize the time course of the response beyond PPD and MPD during a speech in noise task. Specifically, this study focused on the analysis of pupil data estimates obtained using growth curve analysis (GCA; Mirman et al., 2008), due to their current surge in popularity in the pupillometry literature (e.g., Bianchi et al., 2019; Juul Jensen et al., 2018; Koch & Janse, 2016; Kuchinsky et al., 2013, 2014; McGarrigle et al., 2017; Mclaughlin et al., 2020; Neagu et al., 2019; Winn et al., 2015; Winn, 2016).
Methods
To explore experimental factors affecting baseline pupil size and the relationship between baseline pupil size and the TEPR, this study analyzed a dataset collected by Wendt et al. (2018, Experiment 2) consisting of pupil recordings obtained during a speech intelligibility in noise task. Sentences were presented in the presence of different noise-maskers. A block of 25 sentence-trials was used to test each considered signal-to-noise ratio (SNR). Wendt et al. (2018) analyzed changes to the baseline corrected TEPR to investigate the impact of SNR and noise type on listening effort. In the present study the analysis was extended to include (i) the baseline values and (ii) the influence of other experimental parameters beyond task demand.
Figure 1 shows the different methodologies and analysis strategies considered in this study. Each methodological stage is detailed in the sections below.

Workflow of the study. The squares represent processing and analysis stages, whereas the connecting lines indicate the type of data that is transferred between stages. Double lines represent block recordings containing multiple trials of equivalent conditions; dashed lines represent the individual time series for each trial after trial separation; solid lines represent baseline corrected traces (i.e., the tasked-evoked pupillary response, TEPR); dotted lines represent the extracted baseline values and dash-dotted lines represent the TEPR metrics (i.e., the peak pupil dilation and the Growth Curve Analysis estimates).
Experimental Data
Wendt et al. (2018) collected pupil recordings of 29 native Danish, normal-hearing listeners during a speech-in-noise task. Sentences from the Danish HINT corpus (Nielsen & Dau, 2011) were presented in the presence of two different noise maskers: a speech-shaped-noise (SSN) and a four-talker babble noise (4TBB) at different SNRs. Blocks of 25 trials, each containing one sentence, were used for each SNR condition, whereby the block presentation order was randomized across listeners. Each trial included 3 s of noise alone followed by the sentence in noise (average sentence duration 1.5 s; std = 0.2 s) and three seconds of noise alone following the sentence offset. After the noise offset the participants provided their response, followed by a 2-s recovery period in quiet before a new trial was initialized.
The sound pressure level (SPL) of the noise masker was fixed at 65 dB, and SNRs ranging from −20 to 8 dB in 4 dB-steps were obtained by varying the level of the speech signal. All SNR conditions for one masker were presented in a single session, and the order of which noise masker was tested first was randomized across listeners.
The recordings were collected using the iView X RED System eye tracker (SensoMotoric Instruments, Teltow, Germany) with a sampling rate of 60 Hz. Even though Wendt et al. (2018) recorded both eyes, only the left eye traces were used in the present study. The average correlation between the left and right eye traces was r > 0.99 (minimum 0.987), it was therefore assumed that the results presented here should be independent of the eye-choice. Listeners were tested under constant luminance conditions (∼135 lux), with small adaptations for listeners that had relatively big pupil sizes at rest (Wendt et al., 2018).
Data Preprocessing
The raw pupil recordings were pre-processed to remove artifacts and reduce the noisiness inherent to pupil recordings. The processing workflow provided by Relaño-Iborra and Bækgaard (2020) was used which removes artifacts and noise from pupillometry recording and provides annotated data. Here, each recording (i.e., each 25-sentences SNR block) was preprocessed to remove blinks, identify saccade regions (i.e., rapid eye movements), as well as to interpolate and denoise the data. Blinks were defined as samples whose recorded value was more than three times lower than the mean of that block's recording, as recommended by Winn et al. (2018). Subsequently, saccades were detected using the velocity-based algorithm proposed by Duchowski et al. (2002). Velocity data were not provided in the raw data of Wendt et al. (2018), thus, the angular velocity was derived from the gaze coordinates by:

A quality threshold was defined such that traces that contained more than 15% of interpolated data were rejected. Additionally, if missing regions were found in the baseline period, the trial was also rejected (Mathôt et al., 2018). Overall, one listener was discarded due to excessive missing data (>20% of invalid trials across all conditions). After removing this listener, 10.800 traces were analyzed (28 listeners x 8 SNRs x 25 sentences per SNR-block x 2 maskers), from which 58 were rejected as they did not meet the quality threshold (0.005%). For all analyses in this study, the first 5 trials of each block were discarded to avoid biasing the statistical analyses due to effects of initial arousal (Winn et al., 2018).
Characterization of the TEPR
As this study aimed to evaluate effects of baseline on commonly reported pupil metrics, and in order to obtain stable TEPRs, the trials within each SNR-block were averaged, such that one overall trace was obtained per listener and SNR-block. To characterize the resulting TEPRs, the PPD was extracted, defined as the maximum value found in the first 5 s following the sentence onset, such that the analysis window covered the listening and retention periods, i.e., the sentence duration (1.5 ± 0.2 s) and the following 3-s of noise alone, but not the response periods. In addition to the traditional PPD, growth curve analysis (GCA; Mirman et al., 2008; Mirman, 2014) was applied to obtain estimates of the mean, slope, curvature and delay of the TEPR in the same analysis window.
GCA generates models of the TEPR that provide a reduced metric space to characterize the pupillary response. Originally inspired by its use on longitudinal studies, Mirman et al. (2008) provided a generalization for time series analysis of the pupillary response. The underlying idea behind the GCA model is that of nested mixed-effects models. First, a so-called level-1 model is built, which provides the temporal relationship and is defined as:


Statistical Analyses
Factors Affecting Baseline Pupil Size
The baseline pupil sizes, defined as the mean pupil size during the last second of the noise-alone region prior to sentence onset of each trial, were extracted as a part of the data preparation 1 . Changes in the individual trial baseline resulting from experimental parameters, such as the block order and the trial order within a block, were investigated. The effect of task difficulty, manipulated in this data set by changes in the SNR, as well as the noise type and recording session, were also evaluated. A mixed-effects model was used with listener evaluated as a random effect. The fixed effects considered were noise type, session, SNR, block order and trial number and all interactions; quadratic effects were also included (see the appendix, for the mathematical derivation of the statistical model).
The model was reduced by backwards selection from the maximal base model, thus not assuming any a priori effect size. Likelihood ratio tests were used for model comparisons and non-significant effects were sequentially removed until all remaining effects were significant. The analysis was performed in R (R Core Team, 2018) using the package lme4 (Bates et al., 2015).
Baseline Effects on the TEPR
To investigate the effect of the baseline pupil size and experimental parameters on the temporal dynamics of the baseline corrected TEPR, five metrics were used to characterize the TEPR: PPD, GCA mean, GCA slope, GCA curvature and GCA delay (i.e., the intercept, linear, quadratic and cubic GCA parameters, respectively). Each of the metrics was calculated individually for each listener, noise type and SNR-block (i.e., averaged across trials), as previously described. The resulting values were used as the dependent variable in five separate mixed effects models. The base model was common for all metrics with listener as a random effect and SNR, noise type, block order and baseline as potential fixed effects. Here, in contrast to the baseline pupil size analysis where single-trial baselines were considered, the mean baseline across all trials within a block was considered as to have the same time scale for all variables. The models were reduced by backwards selection from the maximal base model using likelihood ratio tests with the R-package lme4 (Bates et al., 2015) until all remaining effects were significant.
Results
GCA Model for the Characterization of the TEPR
The GCA model selection revealed significant improvements in the model performance (as evaluated by an increase in the log-likelihood and a decrease in the AIC) when including SNR and noise effects in all the GCA parameters (i.e., in Equations (3) to (6) for
Results from the stepwise model comparisons of the growth curve analysis (GCA) for the task-evoked pupillary response (TEPR). AIC = Akaike's Information Criteria, BIC = Bayesian Information Criterion, logLik = Log Likelihood.

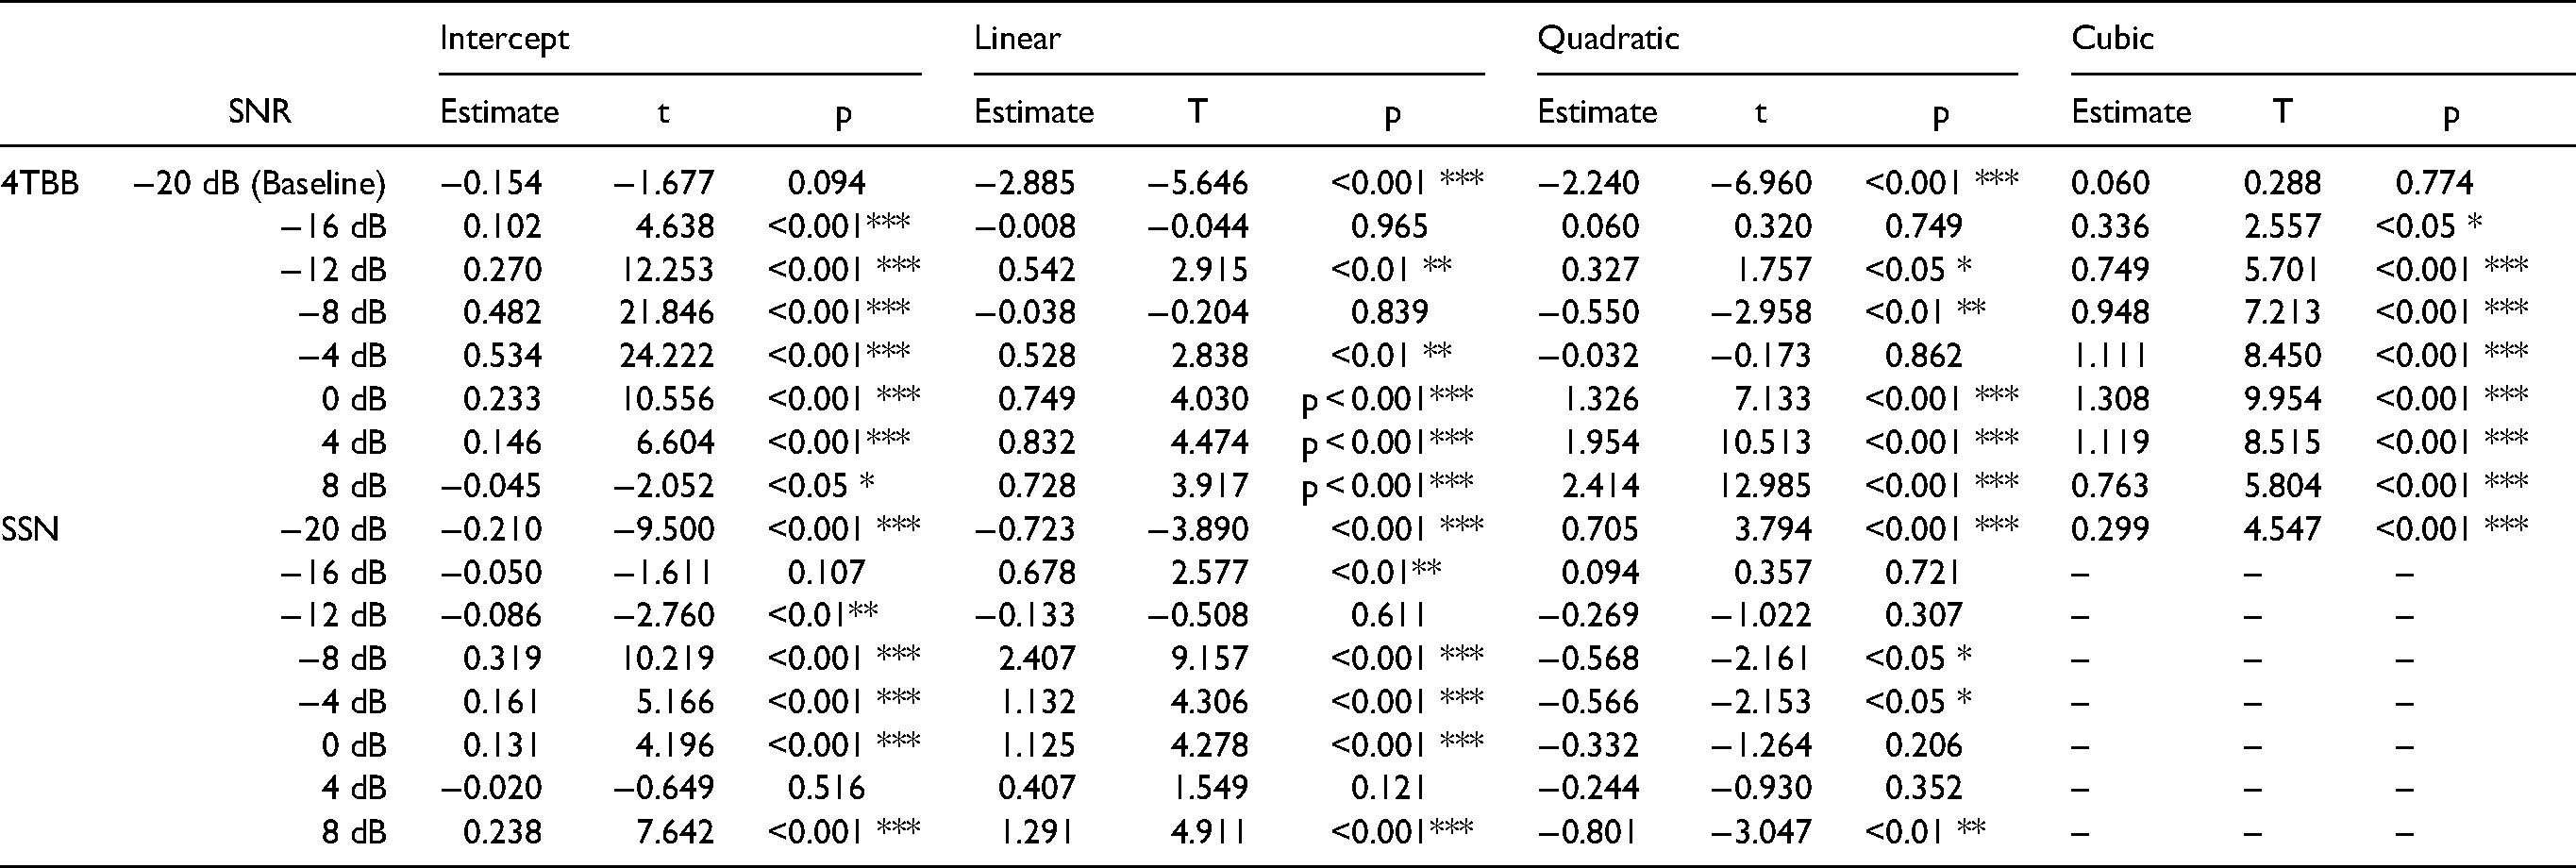
The results from the fitted model are shown in Figure 2 as a function of time from the sentence onset. The GCA model results are indicated as thick lines, while the recorded data are shown with thin lines indicating mean values and the shadowed area representing the standard error. The left panel shows the data and model results for the 4TBB, and the right panel shows the corresponding results for the SSN. Data and model results for each SNR are shown using a color legend. The figure illustrates that the model accounts well for the main trends in the data and that it can capture differences across noise type and SNR. Table 2 reports the average estimates across listeners and significance levels for the GCA model.

Pupil traces as a function of time from the sentence onset for the 4TBB masker (left) and SSN (right). The thin lines represent mean values of the raw data while the shadowed regions represent its standard errors. The thick lines represent the results from the GCA model. The SNR condition is represented by the different colors.
Outputs for the mixed effect model on the TEPR. The model formula follows: pupilSize ∼ (1 + Linear + Quadratic + Cubic)*SNR + (1 + Linear + Quadratic + Cubic)*Noise + (1 + Linear + Quadratic)*SNR:Noise + (1 + Linear + Quadratic + Cubic | listener). The interaction of SNR:Noise on the cubic parameter was not included in the final model after model selection. Thus, estimates for the SSN at all SNRs are equal and only reported once (redundant values are shown as ‘–‘).
Factors Affecting Baseline Pupil Size
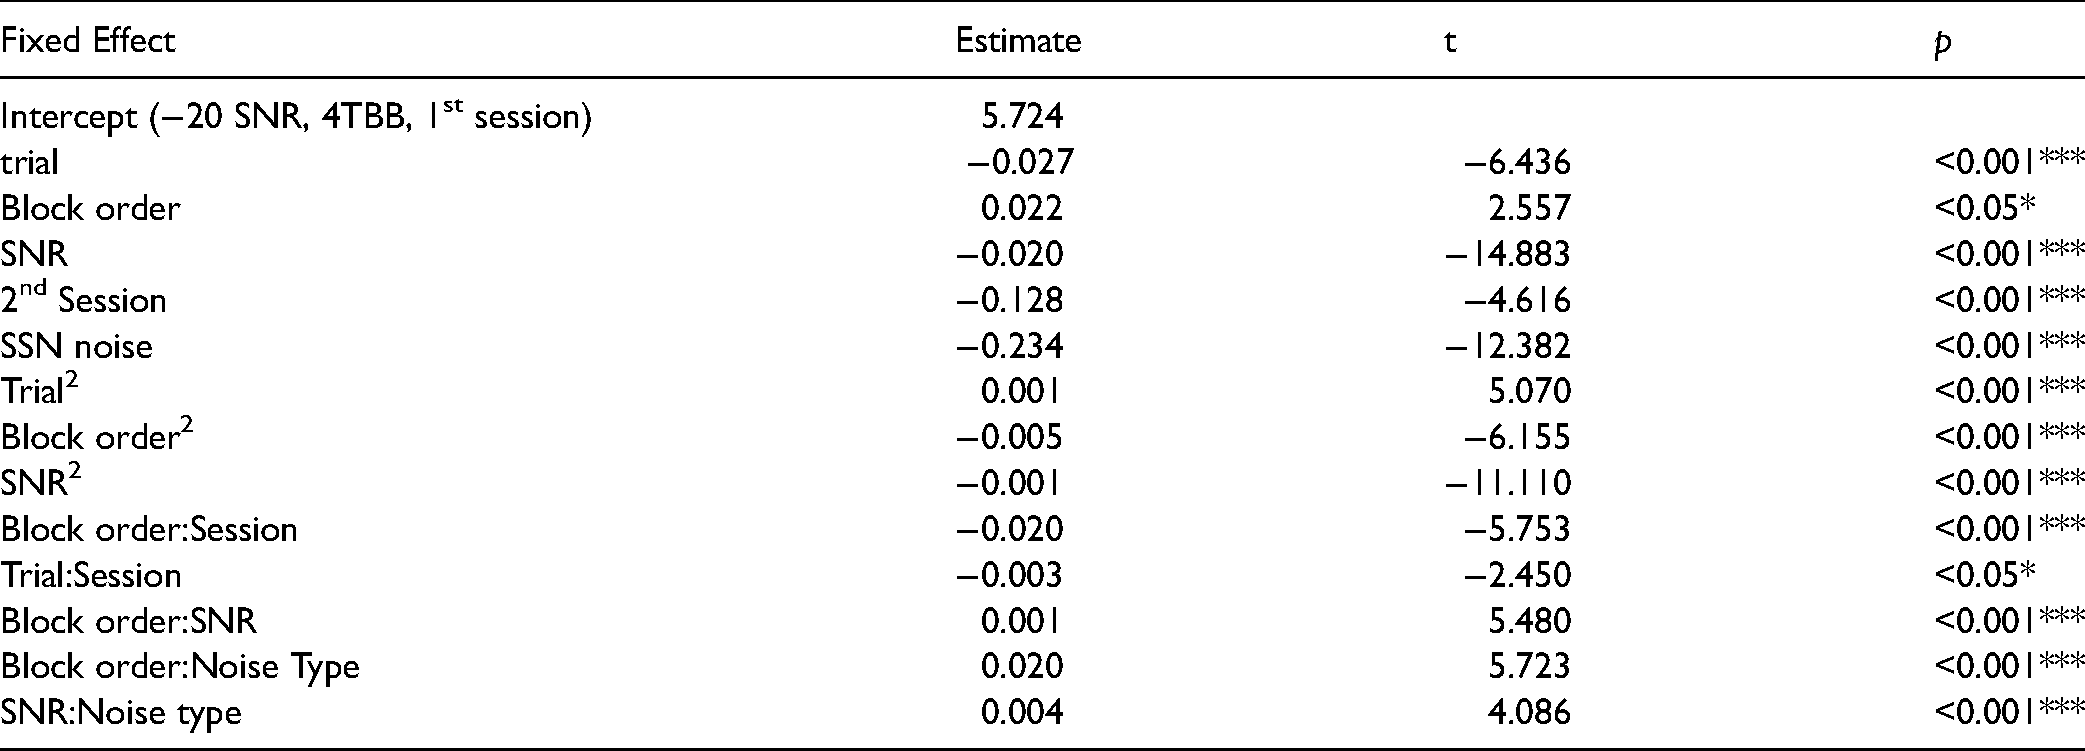
Table 3 shows the results for the mixed linear model applied to the single-trial baseline values after model reduction. The model showed a significant constriction of the baseline pupil size across trials (p < 0.001), block presentation order (p < 0.001) and testing sessions (p < 0.001), suggesting that the time-on-task across all time scales results in a reduction of the baseline pupil size. Additionally, the model reflected a significant effect (p < 0.001) of the task difficulty (i.e., of SNR) in the baseline pupil size despite the baseline being measured before the task started. The model also showed significantly lower baseline values for the SSN masker than for the 4TBB masker (p < 0.001).
Several interactions were found to be significant. Session interacted both with block order (p < 0.001) and trial number (p < 0.05). Additionally, a three-way interaction between SNR and noise type (p < 0.001), block order and SNR (p < 0.001) and block order and noise type (p < 0.001) was found.
Figure 3 shows the marginal means of the baseline pupil size for the fitted model, illustrating the main effects of SNR, noise type and block order, as well as their three-way interaction. The marginal means of the baseline pupil size across blocks (x-axis) are shown for each SNR (color legend) for the 4TBB (left panel) and the SSN (right panel). It can be observed that the baseline pupil size decreases as the time-on-task increases (here represented by the block order), whereby the extent of the constriction changes for each SNR, i.e., the lowest SNRs (SNR < -12 dB) have a larger constriction from Block 1 to 8 than the higher SNRs (SNR >4 dB). Larger baseline sizes were found for the hardest conditions (SNR < -16 dB) than for the easier conditions (SNR >4 dB) for the SSN, but only when they were presented earlier in the experiment, with the reverse trend emerging when these conditions are presented later in the experiment (i.e., harder conditions showed lower baselines than the easy conditions when presented in the final blocks). For the 4TBB, a similar change in the baseline responses from the earlier to the later blocks was found; early blocks showed the highest baseline values for the most difficult SNRs (SNR < -16 dB), whereas later block showed the highest baseline values for the medium SNRs (0 < SNR < -8 dB), albeit lower overall baselines were found as time increased (i.e., the baselines for medium SNRs in later blocks are much lower than those observed for the low SNRs in early blocks). The interaction of task difficulty and presentation order in the baseline response indicates that different baseline values are measured for the most difficult conditions depending on whether they are presented early or later on in the experiment run.
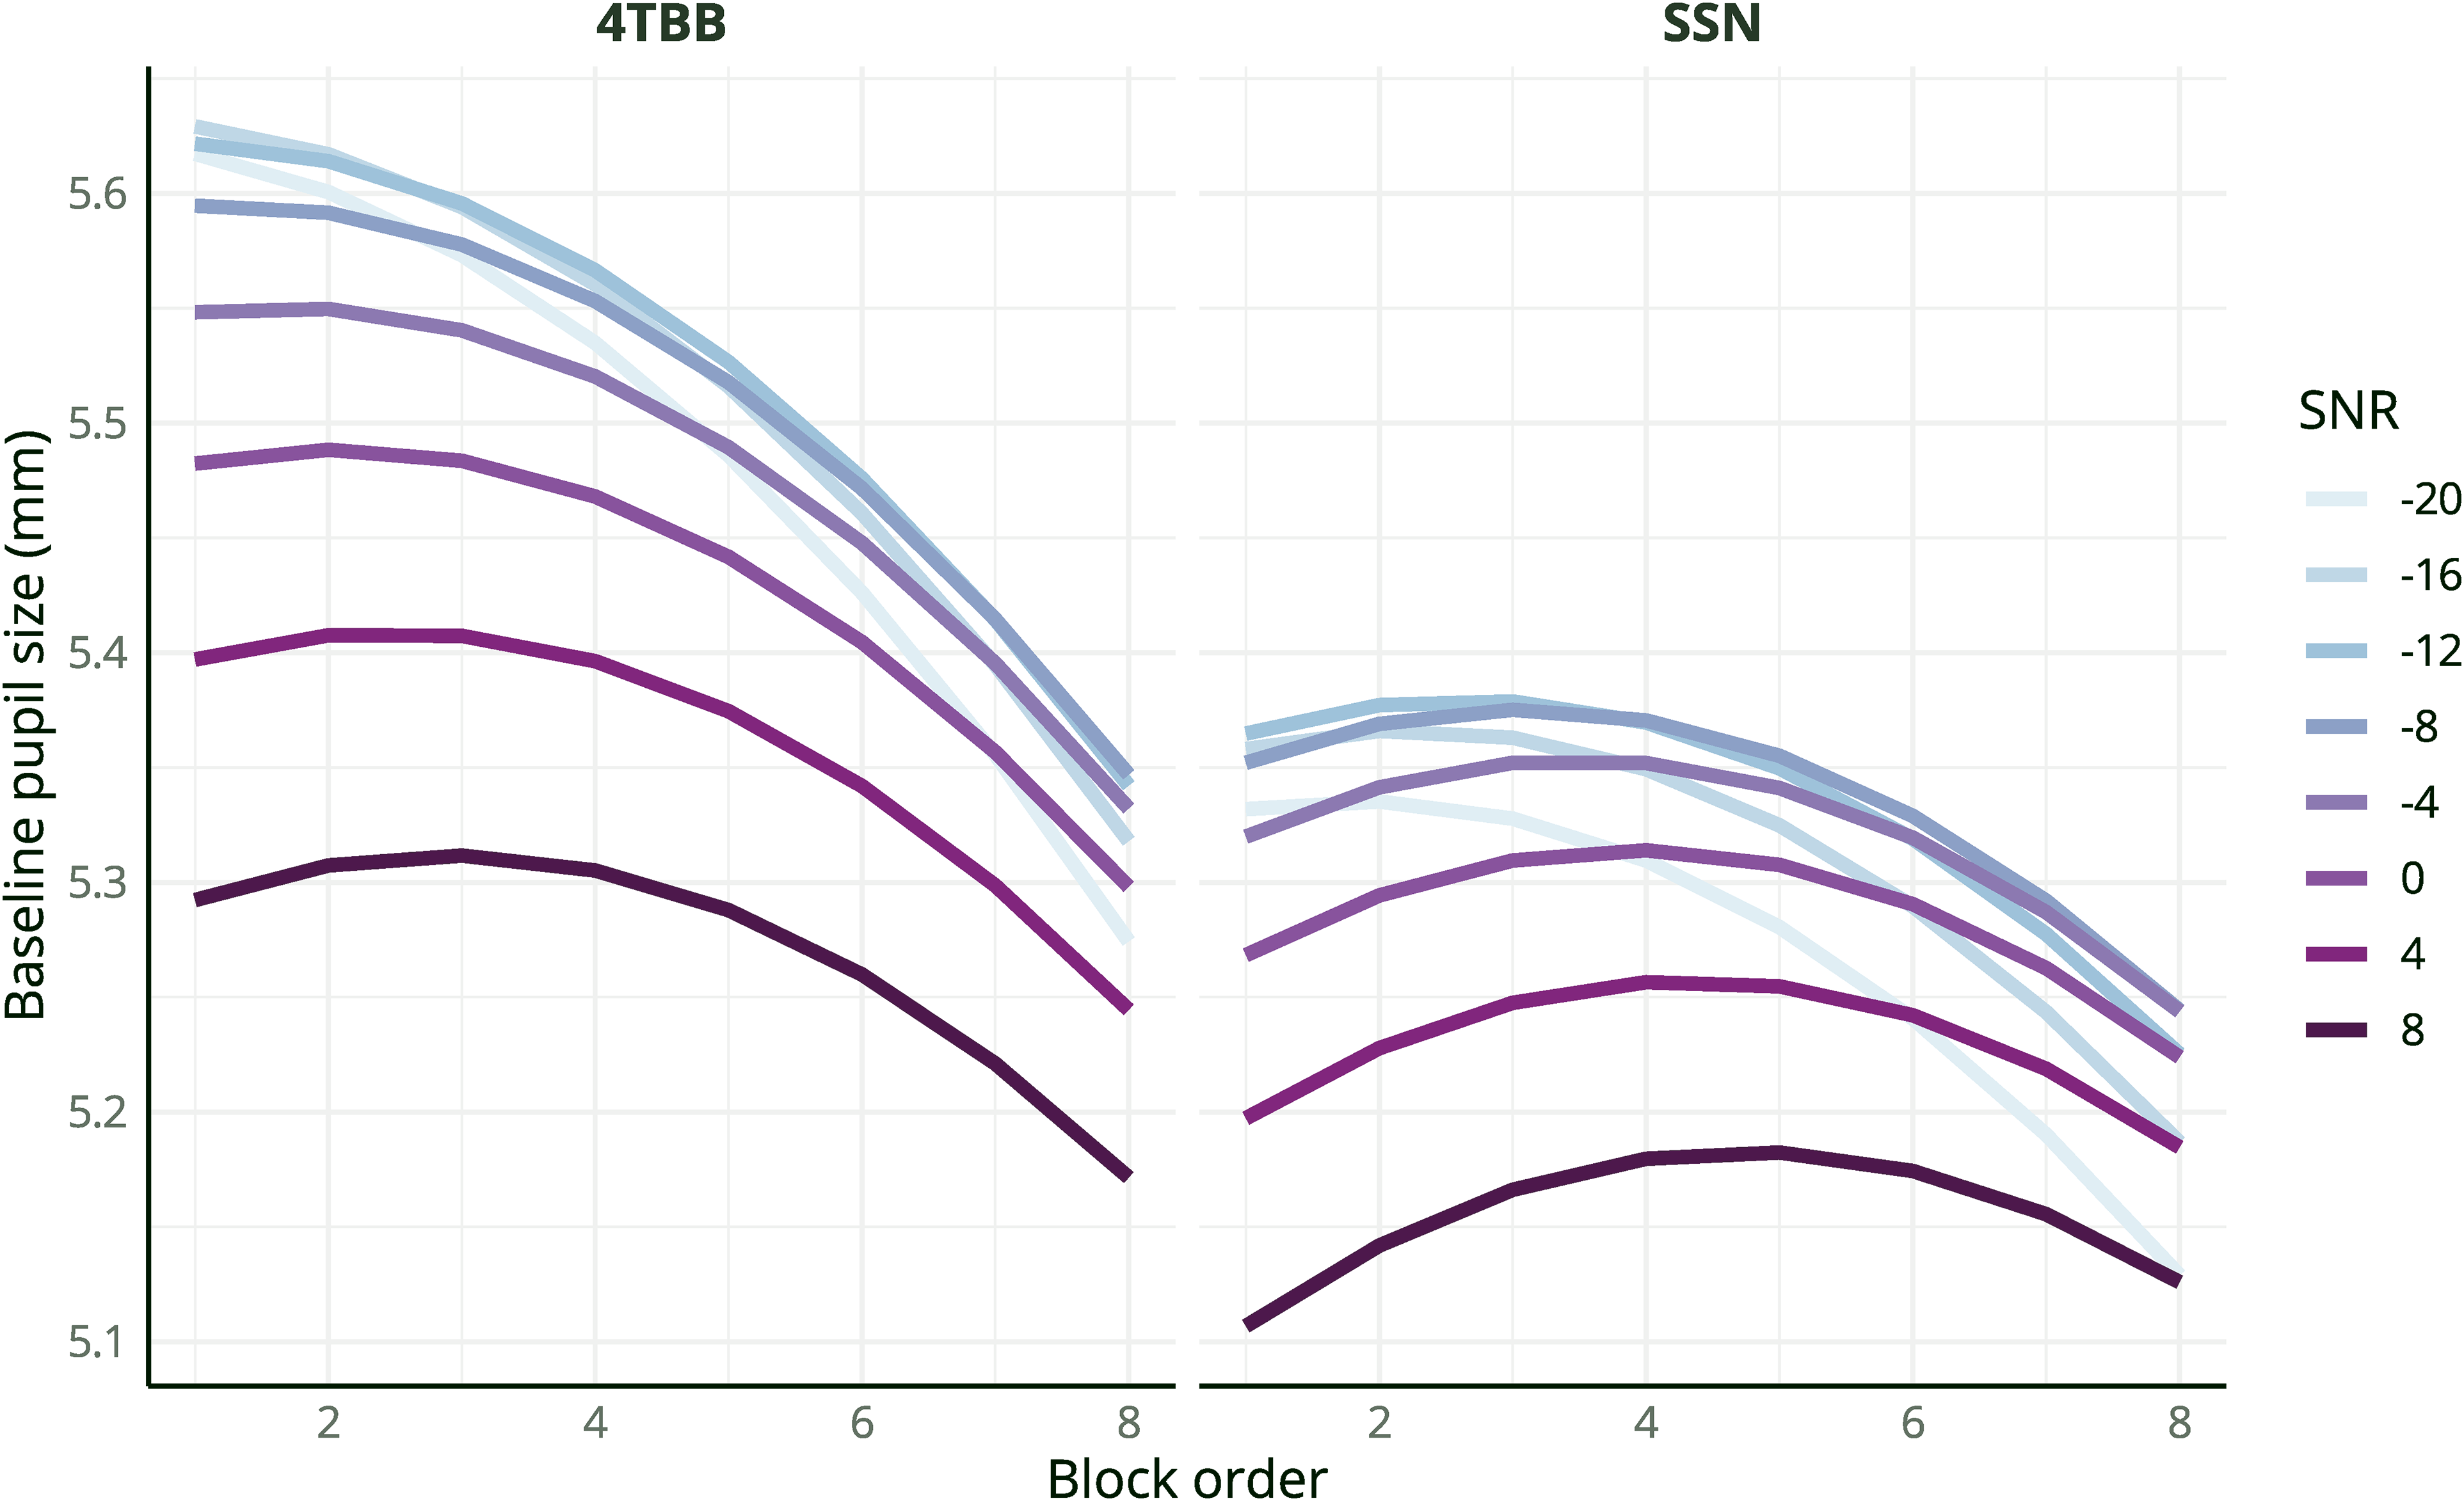
Marginal means of the baseline pupil size for changes in block order (x-axis), shown for each SNR (color) for the four-talker babble noise (4TBB; left panel) and the stationary speech shaped noise (SSN; right panel).
Reduced baselines for the SSN masker as compared to the 4TBB masker for all corresponding SNRs and block presentation orders can also be observed in Figure 3. However, the constriction rate from the initial to the final presentation block was also smaller in the case of SSN, reflecting the interaction of these effects.
Additionally, the main effects of SNR and noise type over the baseline values are shown in Figure 4; the main effects of SNR and noise type on the PPD are also shown for comparison. The left panel in Figure 3 shows the changes in baseline pupil size as a function of SNR for the 4TBB (black circles) and the SSN (grey triangles) conditions, while the right panel in Figure 4 replots the PPDs across SNRs reported by Wendt et al. (2018) for both noises. The model of the baseline values revealed strong and significant effects of both SNR, noise type and their interaction. This is in contrast to the findings of Wendt et al. (2018) for the PPD, where very small, albeit significant (p < 0.01), effects of the noise type were ound and no significant effects of the interaction between SNR and noise type (p = 0.9) were reported. Additionally, Wendt et al. (2018) reported no significant differences in performance across the two noise conditions. This indicates that baseline pupil size can encode differences in masker type characteristics, even if these differences are not reflected in the PPD.

The left panel shows the extracted baselines as a function of SNR whereas the right panel shows the peak pupil dilation (PPD) as reported in Wendt et al. (2018). Data from the speech-shaped noise (SSN) masker condition are plotted in black circles and from the four-talker babble (4TBB) condition with gray triangles.
Baseline Effects on the TEPR
A mixed-effects model was fitted to each of the parameters extracted in the TEPR characterization, i.e.,to the PPD, GCA mean, GCA slope, GCA curvature and GCA delay. The results from the analysis are summarized in Table 4.
Estimates and significance levels obtained using a mixed effect model over the baseline values. The intercept corresponds to the reference condition corresponding to a first session, four-talker babble masker (4TBB) at −20 dB SNR. The variance explained by the listener random effect is 87.269%. LogLikelihood = -3630.598. Akaike's Information Criteria = 7293.196.
Results from the mixed effect models for the different TEPR metrics. Each model was optimized individually, only significant effects are shown.

A highly significant (p < 0.001) negative effect of the baseline was found for the slope, curvature and delay of the TEPR. Thus, these TEPR characteristics get reduced when the baseline increases. A positive marginally significant (p = 0.049) effect was found for the PPD, suggesting that PPD increases for elevated baseline values.
Discussion
The results from the present study showed that for the investigated speech-in-noise listening task, baseline pupil size showed significant effects of task demand (as manipulated both by changes in SNR and differences in noise type). Furthermore, the results indicated that time-on-task affects the baseline pupil size at different time scales: across sentence trials, across presentation blocks and across measurement sessions. Additionally, it was shown that the effects of task demand and time-on-task on the measured baseline value interacted significantly. The results of this study also showed that baseline pupil size encoded differences in masker type characteristics, even if these differences are not reflected in the PPD nor in the task performance.
The observation of task complexity influencing pre-task baselines is consistent with previous studies (e.g., Ganea et al., 2020; Irons et al., 2017; Mosaly et al., 2017; Steiner & Barry, 2011) that found similar effects for a broad range of cognitive tasks. Steinhauer and colleagues linked the elevated baselines for difficult tasks with differential preparation and processing (Steinhauer et al., 2004). This preparatory control, as measured by increased baseline pupil size has also been linked to, e.g., decision-making performance (Jercic, 2019) and enhancement of stimulus detection (Steiner and Barry, 2011). In a thorough experimental analysis of baseline values, Gilzenrat et al. (2010) found that measured changes in the pupil baseline were correlated with behavior and were reliable indicators of task engagement and disengagement, arguing that this was consistent with the pupil diameter being indicative of locus coeruleus (LC) activity as predicted by the adaptive gain theory (Aston-Jones & Cohen, 2005). However, several studies did not show evidence that the baseline pupil size tracked task complexity (Granholm et al., 1996; Trani & Verhaeghen, 2018). Interestingly, Granholm et al. (1996) found that baseline pupil size did not follow task difficulty in a working memory task but did so in a visual tracking task, while baseline pupil size did not predict subsequent performance for either of them. This suggests that baseline activation might be paradigm-dependent, which may account for the differences across studies. Based on the findings of the present study, it appears that a complex task, such as understanding speech in noise, might induce preparatory control, as reflected by pre-task baseline elevation for the most difficult conditions.
Along these lines, the finding of elevated baselines for the babble noise (see Figure 4) as compared to the SSN indicated that baseline pupil size can encode differences in listening effort due to e.g., acoustic complexity of the masker, even when the PPD does not reflect any masker-type differences. These findings complement those of Wendt et al. (2018), who could not verify their hypothesis that to obtain the same performance level that they had observed across maskers, a larger allocation of effort (measured by an increase in the PPD) should be necessary for the babble masker. Therefore, the current findings support the hypothesis that elevated baselines might be a marker of performance facilitation (Steiner & Barry, 2011). Additionally, a decrease in pupil size with time-on-task was observed, which was consistent with previous findings (e.g., Ayasse & Wingfield, 2020; Hyönä et al., 1995; Steiner & Barry, 2011; for a review see Zekveld et al., 2018). Furthermore, the results presented here showed an interaction between time-on-task and task difficulty in the pupil size (i.e., the baseline pupil sizes reflected task difficulty differently depending on the presentation order). A reduction in the pupil response for difficult conditions has previously been shown for the PPD (e.g., Ohlenforst et al., 2018; Wendt et al., 2018) and it has been argued to reflect a giving-up effect. However, its interaction with the time-on-task has not been analyzed. As shown in Figure 2, the most challenging conditions (i.e., lowest SNRs) elicited an elevated baseline only when they were presented earlier on in the experiment, whereas this elevated response was not found when presented in the later blocks. This indicates changes in the listener's engagement (and disengagement) with the task due to familiarization with the task (engaging in the difficult tasks when they are presented earlier on, but not once they are familiar with the experiment paradigm). After sufficient exposure, listeners seem to be able to gauge whether effort deployment would result in a successful completion of the task, thus disengaging from it if success could not be achieved. This disengagement might be a result of e.g., fatigue, familiarity with the task or motivation (Pichora-Fuller et al., 2016). The interaction of task-demand and time-on-task in the measured baseline pupil size might indicate that preparatory control is less required as listeners familiarize themselves with the task at hand. Disentangling the interactions of these effects is not possible in the present dataset and requires further investigation. However, the effects of task engagement and preparatory control, as seen in the baseline in this study, further support the idea of the adaptive gain theory that pupil diameter can reflect levels of LC activity due to changes in control states (Aston-Jones & Cohen, 2005; Gilzenrat et al., 2010).
The interaction of task difficulty and presentation order in the baseline response, as well as the evidence presented here for preparatory control, is also consistent with the Framework for Understanding Effortful Listening (FUEL) of Pichora-Fuller et al. (2016) which argues for a multidimensional understanding of listening effort, where fatigue, arousal and motivation as well task demand interact in forming the listeners physiological and behavioral response to a set of stimuli and tasks. What is more, the influence of time-on-task in the relationship between baseline and task demand might explain why previous studies did not find baseline differences across task difficulties, as neither the task order nor the time-on-task was included in those analyses. Overall, the findings from this study suggest that thinking of the intra-trial baseline pupil size as a purely tonic response might not fully capture the complex cognitive processes happening before the task is presented to the listener, as also argued by Joshi and Gold (2020). Furthermore, the strong effect of presentation order across blocks, has implications for future experimental design, indicating that a randomized presentation of the different conditions might be preferrable in order to factor out time-on-task influence on the pupillary response.
Indeed, a potential limiting factor of the results presented in this study is yet another side-effect of the block design which could lead to the contamination of the baseline region due to previous responses. Trials within a block were measured consecutively and, despite response and recovery times being inserted between trials, it is possible that subsequent trials were presented before the dilation from previous trials had fully converged to resting state. Thus, baseline values might reflect not only preparatory processing but also spill-over effects from the previous trials. However, as shown in Figure 4, changes in the baseline were found even when changes in the TEPR were not, supporting the idea that the baseline might encode aspects of cognitive processing that are simply not captured by the TEPR, such as e.g., task preparation, stimulus familiarity or motivation, as suggested by the FUEL (Pichora-Fuller et al., 2016).
It has been argued that elevated baselines consistent with preparatory processing and arousal (i.e., elevated LC activity) could potentially lead to reduced TEPRs, in accordance with both the adaptive gain theory (Aston-Jones & Cohen, 2005; Gilzenrat et al., 2010) and the Yerkes-Dodson model of optimal arousal (Aston-Jones et al., 1999; Teigen, 1994; Yerkes & Dodson, 1908). The present study found that elevated baseline responses corresponded to a reduced TEPR, with a significant (p < 0.001) negative effect of the baseline pupil size on the slope, curvature and delay of the TEPR. However, no effect of baseline on the GCA mean (i.e., on the average dilation, analogous to the MPD) was found, and a small and only marginally significant (p = 0.049) positive effect was found of the baseline on the PPD.
These findings contradict the earlier hypothesis of TEPR and baseline independence (e.g., Beatty, 1982a, 1982b; Bradshaw, 1969; Granholm et al., 1996; Kahneman & Beatty, 1967) but are in line with recent findings regarding the influence of baseline on TEPR metrics (e.g., Gilzenrat et al., 2010; Peysakhovich et al., 2017; Steinhauer et al., 2004). There are several findings from the current study that might explain the contradicting evidence regarding the relationship between baseline and TEPR across previous studies. First, the results from this study showed no effect of the baseline response on the GCA mean (which can be interpreted as a MPD) and found small and only marginally significant effects of baseline on the PPD (p = 0.049), suggesting a lack of stability of this effect. Given that MPD and PPD are the most common metrics of TEPRs, it is possible that previous studies that focused only in these two metrics simply overlooked the influence of the baseline in the TEPR, evident when the response is characterized in terms of estimates of its temporal dynamics. Second, task complexity might play a role on the relationship between baseline activation and TEPR. Mosaly et al. (2017) showed that different relations between baseline and TEPR exist for tasks that have variable loads, such as those measured in, e.g., Kahneman & Beatty (1967); Beatty (1982a), and tasks with sustained challenging conditions (e.g., Gilzenrat et al., 2010; Peysakhovich et al., 2017). The task considered in the present study of speech understanding in noise is complex and, therefore, it follows that it results in a relation between baseline and TEPR. Finally, several of the studies that have discarded a relationship between baseline and TEPR were based on experimental paradigms that systematically manipulated baseline values by changing the lighting conditions only (e.g., Bradshaw, 1967; Reilly et al., 2019; Xu et al., 2011). However, Gilzenrat et al. (2010) found that when baseline changes were induced by luminosity changes, the TEPR did not show an inverse relationship with baseline, such as the one they found when manipulating the task complexity. In the present study, luminosity conditions were kept constant across task difficulty (i.e., SNRs and noise types). Thus, baseline pupil size changes (for a given individual) can be assumed to reflect task-related effects (e.g., habituation, fatigue, preparatory processing), consistent with previous findings (Gilzenrat et al., 2010; Granholm & Steinhauer, 2004).
The results from this study showed an influence of baseline pupil size on estimates of the TEPR measured using the GCA method. This modelling approach assumes a polynomial behavior of the time series and it is, furthermore, unable to account for potential autocorrelation of the response (Baayen et al., 2017; van Rij et al., 2019). Recently, generalized additive mixed modeling (GAMM; Hastie & Tibshirani, 1990) has been proposed as an alternative method to analyze pupillometry data (e.g., Algermissen et al., 2019; Aydın & Uzun, 2022; Beatty-Martínez et al., 2021; Boswijk et al., 2020; Huijser et al., 2020; Lõo et al., 2016; Pandža et al., 2020). This method overcomes some of the GCA weaknesses and could be used for similar analyses to the one presented in this study. Additionally, investigations examining task-encoding in the baseline region, and its influence on the TEPR, in auditory tasks beyond speech-in-noise paradigms are necessary in order to provide methodological recommendations regarding the role of baseline analysis and correction in pupillometry data reporting.
Conclusion
The findings presented here have implications for future experimental design (such as the interactions between task-demand and presentation order) and metric choices (as shown by the effect of baseline on certain aspects of the TEPR). This study might not solve the divide in the literature regarding the relationship between TEPR and baseline, but it adds to the growing evidence that both measures of the pupillary response should be taken into account when reporting pupillometry data, as both can contain information about the measured cognitive processes.
Footnotes
Acknowledgements
We are thankful for the comments and suggestions of two anonymous reviewers that helped improve this manuscript.
Declaration of Conflicting Interests
The author(s) declared no potential conflicts of interest with respect to the research, authorship, and/or publication of this article.
Funding
The author(s) disclosed receipt of the following financial support for the research, authorship, and/or publication of this article: This work was supported by the William Demant Foundation.
ORCID iDs
Notes
Appendix
The mixed-effects model used to analyze the pre-task baseline included the block order, the trial order within a block, the task difficulty (i.e., the SNR), as well as the noise type and recording session, with listener evaluated as a random effect. A quadratic effect was assumed for all fixed effects in the maximal model before model reduction, and all interactions between main effects were also included in this base model. Such that: