
Abstract
Recordings of the pupillary response have been used in numerous studies to assess listening effort during a speech-in-noise task. Most studies focused on averaged responses across listeners, whereas less is known about pupil dilation as an indicator of the individuals’ listening effort. The present study investigated the reliability of several pupil features as potential indicators of individual listening effort and the impact of different normalization procedures on the reliability. The pupil diameters of 31 normal-hearing listeners were recorded during multiple visits while performing a speech-in-noise task. The signal-to-noise ratios (SNRs) of the stimuli ranged from
Introduction
Listening effort has been a growing topic in the auditory field over the last couple of decades. It is often defined as “the deliberate allocation of mental resources to overcome obstacles in goal pursuit when carrying out a task, with listening effort applying more specifically when tasks involve listening” (Pichora-Fuller et al., 2016). Among different measures of listening effort, pupillometry, that is, tracking of the pupil’s size, has been recognized to be the “most useful autonomic indication” of effort (Kahneman, 1973). It has been shown that the pupil response is regulated by the autonomic nervous system (Wang et al., 2016; Bremner, 2009; May et al., 2019) which plays an important role in maintaining stability and balance in the body. Its activity consists of both sympathetic and parasympathetic responses (Loewenfeld, 1993; Wang et al., 2018). The relative contribution of sympathetic versus parasympathetic activity to the pupil response, however, can vary as a function of cognitive activity. Reimer et al. (2016) suggested that nonluminance-related changes in pupil size might be determined by the locus coeruleus (LC), which has been shown to be a noradrenergic source for the cortex (Aston-Jones & Cohen, 2005; Carter et al., 2010; Jones, 2004; Lee & Dan, 2012). Several studies showed that LC activity determines parasympathetic inhibition, which thereby causes inhibition of the constrictor muscle of the pupil and ultimately leads to a dilation of the pupil (Eckstein et al., 2017; Wang et al., 2016). Furthermore, pupillometry has been demonstrated to provide a measure of listening effort during speech-in-noise tests both in normal-hearing (NH) and hearing-impaired (HI) listeners (Kramer et al., 1997; Zekveld et al., 2010, 2011; Koelewijn et al., 2012). For example, Ohlenforst et al. (2017) demonstrated that HI listeners showed an increased pupil diameter, indicating an increased allocation of resources to reach similar speech intelligibility performance compared to NH listeners. Several studies examined the impact of the level of speech intelligibility, signal-to-noise-ratio (SNR), linguistic complexity and hearing-aid signal processing on listening effort (Zekveld et al., 2011; Kuchinsky et al., 2013, 2014; McGarrigle et al., 2014; Winn, 2016; Wendt et al., 2018). For instance, pupillometry has been shown to be sensitive to changes in the acoustic signal caused by hearing-aid signal processing. Specifically, a reduction in listening effort has been reported with noise-reduction schemes for HI listeners at SNRs reflecting ecologically valid listening situations at a high level of speech intelligibility (Ohlenforst et al., 2017; Wendt et al., 2017). These studies support the hypothesis that a complete characterization of the difficulties in speech understanding arising as a consequence of hearing impairment, and the potential benefit of hearing aid interventions, can be gained when measuring listening effort in addition to speech intelligibility.
So far, pupillometry as a measure of listening effort during a speech-in-noise task has only been evaluated on a listener group level (as averaged responses across listeners), and little is known about the sensitivity and reliability of this method for individual listeners. However, such sensitivity and reliability of the method on an individual listener’s level would be crucial for pupillometry to be used as a basis for individualized rehabilitation strategies. The transition from pupillometry assessed on a group level to an individual listener level is challenging because the pupil response has numerous sources of variation (Zekveld et al., 2011, 2018; Koelewijn et al., 2012; Wang et al., 2018; Partala & Surakka, 2003). For example, pupil response is affected by environmental factors, such as luminance, masking noise, or communication technologies (e.g., hearing aids). Furthermore, listener-specific factors, such as cognitive abilities, hearing impairment, or the level of fatigue, can affect the pupil response (Zekveld et al., 2018; Kuchinsky et al., 2016; Wang et al., 2018; Pichora-Fuller et al., 2016).
A few studies investigated the reliability of the pupil response assessed during speech recognition. Alhanbali et al. (2019) explored the reliability of several physiological measures during a digit-in-noise recognition task performed under individualized listening conditions, whereby the level of speech intelligibility performance was fixed at 71%. The authors reported that among the assessed physiological measures, pupillometry (specifically, the mean pupil dilation (MPD) and the peak pupil dilation (PPD) of the response) showed the highest reliability with an intraclass correlation coefficient (ICC
These studies focused on the analysis of the MPD and PPD only, following the traditional characterization of the pupil response (Zekveld et al., 2010, 2011; Koelewijn et al., 2012). However, more recently, Kuchinsky et al. (2013) showed that growth curve analysis (GCA) could be used to detect changes in the shape of the pupil response over time, allowing for an independent evaluation of different temporal characteristics of the pupil response (Mirman et al., 2008; Winn et al., 2015). GCA fits orthogonal polynomial terms to time series data to show different variations in the function among individuals (Mirman et al., 2008). Not much is known, though, about the reliability of the traditional or GCA pupil features across multiple visits.
Only a few studies evaluated the reliability of various measures other than pupil features over more than two visits (e.g., psychophysiological measures: intrinsic attentive selection of one of two lateralized visual cues, Aday & Carlson (2019); daytime sleepiness, Zwyghuizen-Doorenbos et al. (1988)). Aday & Carlson (2019) showed that attention biases were not reliable until participants had fairly extensive experience with the task. They suggested that more visits could reduce the noise in the data related to task familiarity and increase reliability. These studies showed, in fact, an increase in the reliability of the tests with an increasing number of visits. However, the reliability of pupillometry assessed within a speech-in-noise task paradigm over multiple visits has not yet been studied. Furthermore, Alamia et al. (2019) and Widmann et al. (2018) showed that the pupil dilates following increased surprise or, more generally, following global arousal and that emotional arousal to novel sounds enhances the sympathetic contribution to the pupil dilation response. Thus, it follows that an arousal effect observed in the pupil response when performing a novel task (i.e., at the first visit) could result in lower reliability of pupillometry between the first and second visit than a comparison between the responses in subsequent visits. A common approach to avoid arousal effects has been to remove the first trials (within a condition) from the analysis and, thus, to reduce the impact of any initial effects (Winn et al., 2018). However, a more general arousal effect (i.e., novel task, novel environment, unknown experimenter) is difficult to control. Thus, the present study investigated the reliability of pupil response over multiple visits.
Furthermore, regarding the changes in the reliability of the pupil response with changing SNR, results differed remarkably across studies. Giuliani et al. (2020) found fair reliability irrespective of their considered SNR changes from 0 to
Finally, different methods of pupil diameter normalization have been proposed in the literature (e.g., Winn et al. (2018)). A common approach when assessing listening effort in a speech-in-noise task paradigm is baseline correction. Baseline-corrected responses represent a change in pupil size relative to a particular temporal window before the stimulus, known as baseline (Winn et al., 2018). However, while some studies argued that the normalization of task-evoked changes in pupil size should be done independently of the baseline pupil size (Beatty, 1982; Bradshaw, 1969), others stated that different ways of baseline scaling could produce disparities in the reported pupil size results (Reilly et al., 2019; Mathôt et al., 2018). Moreover, relatively large interindividual differences in the dynamic range of pupil diameter have been observed, and several other approaches have been proposed to target these differences. For example, Piquado et al. (2010) obtained a dynamic range of pupil response based on changes in the luminance (dark versus light), which was then used for range normalization. Furthermore, McCloy et al. (2016) applied
The present study aimed to obtain a better understanding of the reliability of pupillometry as an objective indicator of an individual’s listening effort. Different features of the pupil response, assessed in a speech-in-noise paradigm, were extracted and the impact of task demands (i.e., changing SNR) and data normalization procedures on the reliability of those features were systematically investigated. The test-retest reliability of pupillometry was investigated by assessing pupil response over three visits. It was hypothesized that the reliability of different pupil features would increase with decreasing SNR (i.e., higher task demands). Furthermore, it was hypothesized that the reliability of different pupil features would be affected by applying distinctive normalization procedures.
Methods
Participants
Thirty-five participants (aged from 18 to 65 years, mean 38) took part in this study. All participants were native Danish speakers. They had pure-tone hearing thresholds of 20 dB hearing level (HL) or better at low frequencies (below 6 kHz) in both ears and thresholds of 30 dB HL or better at frequencies above 6 kHz. The participants had no history of eye diseases or eye operations. Exclusion criteria also included caffeine intake less than 3 hours prior to the test time. The data of four participants out of the thirty-five were excluded from the analysis because of their withdrawal from the study after the first visit. The research procedures were approved by the Science-Ethics Committee for the Capital Region of Denmark (reference H-16036391), and all participants provided written informed consent for the study procedures and received monetary compensation for their participation.
Procedure and Stimuli
Participants were asked to perform a speech-in-noise test with sentences from the Danish Hearing in Noise Test (HINT, Nielsen & Dau (2011)). HINT sentences were presented in a 4-talker babble masker, which was created by overlapping two male and two female talkers (all of them reading different excerpts from a newspaper) with the same long-term average frequency spectrum as the HINT sentences. For each measurement trial, the masker onset started 3 s prior to sentence onset and stopped 3 seconds after sentence offset, as the vertical lines in Figure 1 indicate. The length of each trial varied depending on the length of the presented HINT sentence, which has a mean duration of about 1.5 s. After the masker offset, the participants were asked to repeat back the HINT sentence. Two seconds of silence were established before noise onset to allow for the pupil to return to pre-task levels (i.e., recovery). Sentences were presented at five different SNRs: 4, 0,

Schematic illustration of the pupil response within the speech-in-noise test with sentence onset at second 3. All analyzed pupil features (traditional and growth curve analysis [GCA] features) are schematically represented.
The participants were instructed to fix their gaze at a grey cross in the middle of a black screen during the speech-in-noise task and to repeat the HINT sentence or as many words as they could recall after the noise offset. The responses were scored on a word-level basis (all recognized words from the sentence were marked as correct). Speech-reception-thresholds (SRTs) were calculated by extracting the corresponding SNR value recorded at 50% correct performance by fitting a psychometric function to the data of each participant.
The participants were tested at two different visits (Visits 1 and 2) using a repeated measures design. Eleven out of the thirty-one participants were re-tested additionally at a third visit (Visit 3). The visits were spaced three to six weeks apart to avoid any learning effects of the sentence material (Bramsløw et al., 2016). The subsequent visits were scheduled at the same time of the day and at the same period of the week (i.e., beginning, middle, or end) as for Visit 1 to minimize the potential effect of fatigue at different times during a day or at different days of the week and to control for circadian rhythm effects (Daguet et al., 2019). The procedure was the same at the second and third visits with the same presentation order of the conditions and the same sentences but in a different order per condition for each of the listeners.
Apparatus and Pupillometry Data Processing
Eye-tracking data were continuously recorded during the speech-in-noise test using a desktop-mounted eye-tracker (EyeLink 1000; SR-Research Ltd., Mississauga, Ontario, Canada). Pupil sizes were recorded from the left eye with a sampling frequency of 500 Hz. The measurements were performed in the same booth with the same luminosity levels across visits (screen and ambient light). The screen’s luminance and ambient light were controlled to prevent any changes in pupil response that could be attributed to changes in ambient or screen light intensity. The ambient light was measured at 75 lx for the tasks performed in light. The screen had an approximate brightness of 9 cd/
The pupil data were processed using (MATLAB, 2018) and R (R Core Team, 2019). In order to remove any initial arousal effects, the pupil traces of the first three trials within a block were excluded from the analysis. Since a decreasing trend of the pupil within each block was observed, the entire block recording was linearly detrended. For the eye-blink removal, the MPD with standard deviation was calculated across the whole trial. Pupil diameter values more than three standard deviations smaller than the mean were coded as eye-blinks. Eye-blinks were removed by a linear interpolation that started about 80 ms before and ended 150 ms after the blinks. Data were then smoothed using a moving average filter with a symmetric rectangular window of 117 ms. Trials with more than 20% missing data, eye blinks or artifacts were removed from the analysis. All remaining traces were scaled using each of the four normalization procedures presented in Section Data Normalization below.
Perceived Effort
After each block, participants were asked to answer the NASA-TLX (Hart & Staveland, 1988) questionnaire to assess a measure of the perceived listening effort. The NASA-TLX uses a 0-20 scale (low/high). NASA-TLX has six subitems: mental demand, physical demand, temporal demand, perceived performance, effort, and frustration. The score was calculated as a mean score of each of the subitems. Additionally, another measure of a self-rated listening effort was provided by each participant after each SNR block. On a 0-to-10 scale (with 0 indicating low effort and 10 indicating high effort), participants were asked to answer the following question: “Hvor meget anstrengte du dig for at høre sætningerne?” which translates to English as, “How much effort did you put into hearing the sentences?”. Both measurements were rescaled to a 0-1 scale for further analysis.
Data Normalization
Four different normalization procedures were applied. First, baseline correction (equation 1) was applied at a trial level by subtracting the mean pupil size measured in the 1 s period preceding the sentence onset from each data point of the trial.

Alternatively, a range normalization procedure was applied for each participant for each trial. The pupil range was calculated by extracting the maximum and the minimum pupil diameter across all trials of all conditions and visits for each participant. All trials were then range normalized at a trial level (equation 2).

As another option, a

Finally, a range normalization procedure (equation 4) was applied on the baseline corrected data, for each trial, using formulas (equation 1) and (equation 2) and was referred to here as “baseline range” normalization. The individual traces were, therefore, firstly baseline corrected (i.e., subtraction of the MPD in the baseline time window) and afterward, the range normalization procedure was applied, at the individual trial level. The maximum and minimum pupil size values of the range were extracted per participant across all conditions and visits.

Feature Extraction
The MPD was calculated as the average pupil diameter in the interval between sentence onset and masker offset (see Figure 1 arrow Noise+Sentence), after the traces were averaged across all trials within a block. The PPD was calculated as the maximum dilation in the same interval, similarly, after pupil traces were averaged within a block.
In order to account for effects reflected in the time-course of the pupillary response, GCA was applied (Mirman et al., 2008). GCA is a multilevel regression technique that fits orthogonal polynomials to time course data. A third-order (cubic) orthogonal polynomial was applied to the overall time course of the pupil diameter within a time window starting at 2 s (i.e., at the baseline onset) until 8 s of stimulus presentation (see Figure 1). A third-order polynomial function, including the intercept through cubic terms, was considered to provide a good fit to the shape of the pupil response across time (Kuchinsky et al., 2014, 2016). The model was applied on a trial-by-trial basis, with the trial representing the random effect, and the estimates were calculated on a block-level. Examples of modelled pupil responses using GCA are provided in Figure 6 in the Supplemental material. The feature extraction is described in (equation 5). Pupil size was considered as a dependent variable in the model, predicted by a series of fixed and random effects (individual and trial number, respectively).

A schematic representation of the GCA features can be seen in Figure 1. The intercept term represents the average height (AH) of the pupil response, the linear term (
Reliability Analysis
The reliability of the pupil features was assessed using Spearman’s correlation coefficient, which reveals how consistent the results are across the different visits, as well as the ICC, which evaluates the test-retest reliability (Cicchetti, 1994; Koo & Li, 2016). Sperman’s correlation sorts the observations by rank and evaluates how similar the ranks are. Their values lie between

The ICC assesses the group reliability by comparing the variability within different visits of the same participant’s pupil diameter to the total variation across all visits and all participants. Here, the ICC was calculated to evaluate the reliability of different features of the pupil response (see subsection ICC - Pupil Features from the Results section) between Visits 1 and 2 for 31 participants, and between Visits 2 and 3 for the subgroup of 11 participants who came for a third visit. The latter was compared to the ICC values measured for the same 11 participants between Visits 1 and 2.
The ICC was calculated as a two-way mixed-effects model with two measurements, as reflected in (equation 7), where

Results
Group Average Data
Although this study focused on the reliability of individual‘s pupil features, a group-level analysis was conducted first to provide an anchor to previous literature and to gauge group-level reproducibility. The pupil traces shown in Figure 2 for the different normalization procedures were first averaged across trials at the participant level. Thereafter, the single-subject average traces were averaged across listeners for each condition and visit to form the group average. Overall, it can be seen that the general trend of increasing pupil response with decreasing SNR remains, regardless of the normalization procedure. Figure 2 shows that the pupil response changes with varying SNR on a group level. These results were in line with results from previous studies (Wendt et al., 2018), showing that SNR manipulation impacts pupil dilation in an auditory task (Zekveld et al., 2010). Furthermore, the difficulty level manipulated through the SNR was compared to the individual listeners’ task performance and the individuals’ perceived effort measures using a Pearson correlation analysis. By visually inspecting the traces, it appears that larger differences between the two visits occur in the z-score (low right panel) and range normalization (low left panel) procedure compared to the other two, especially for
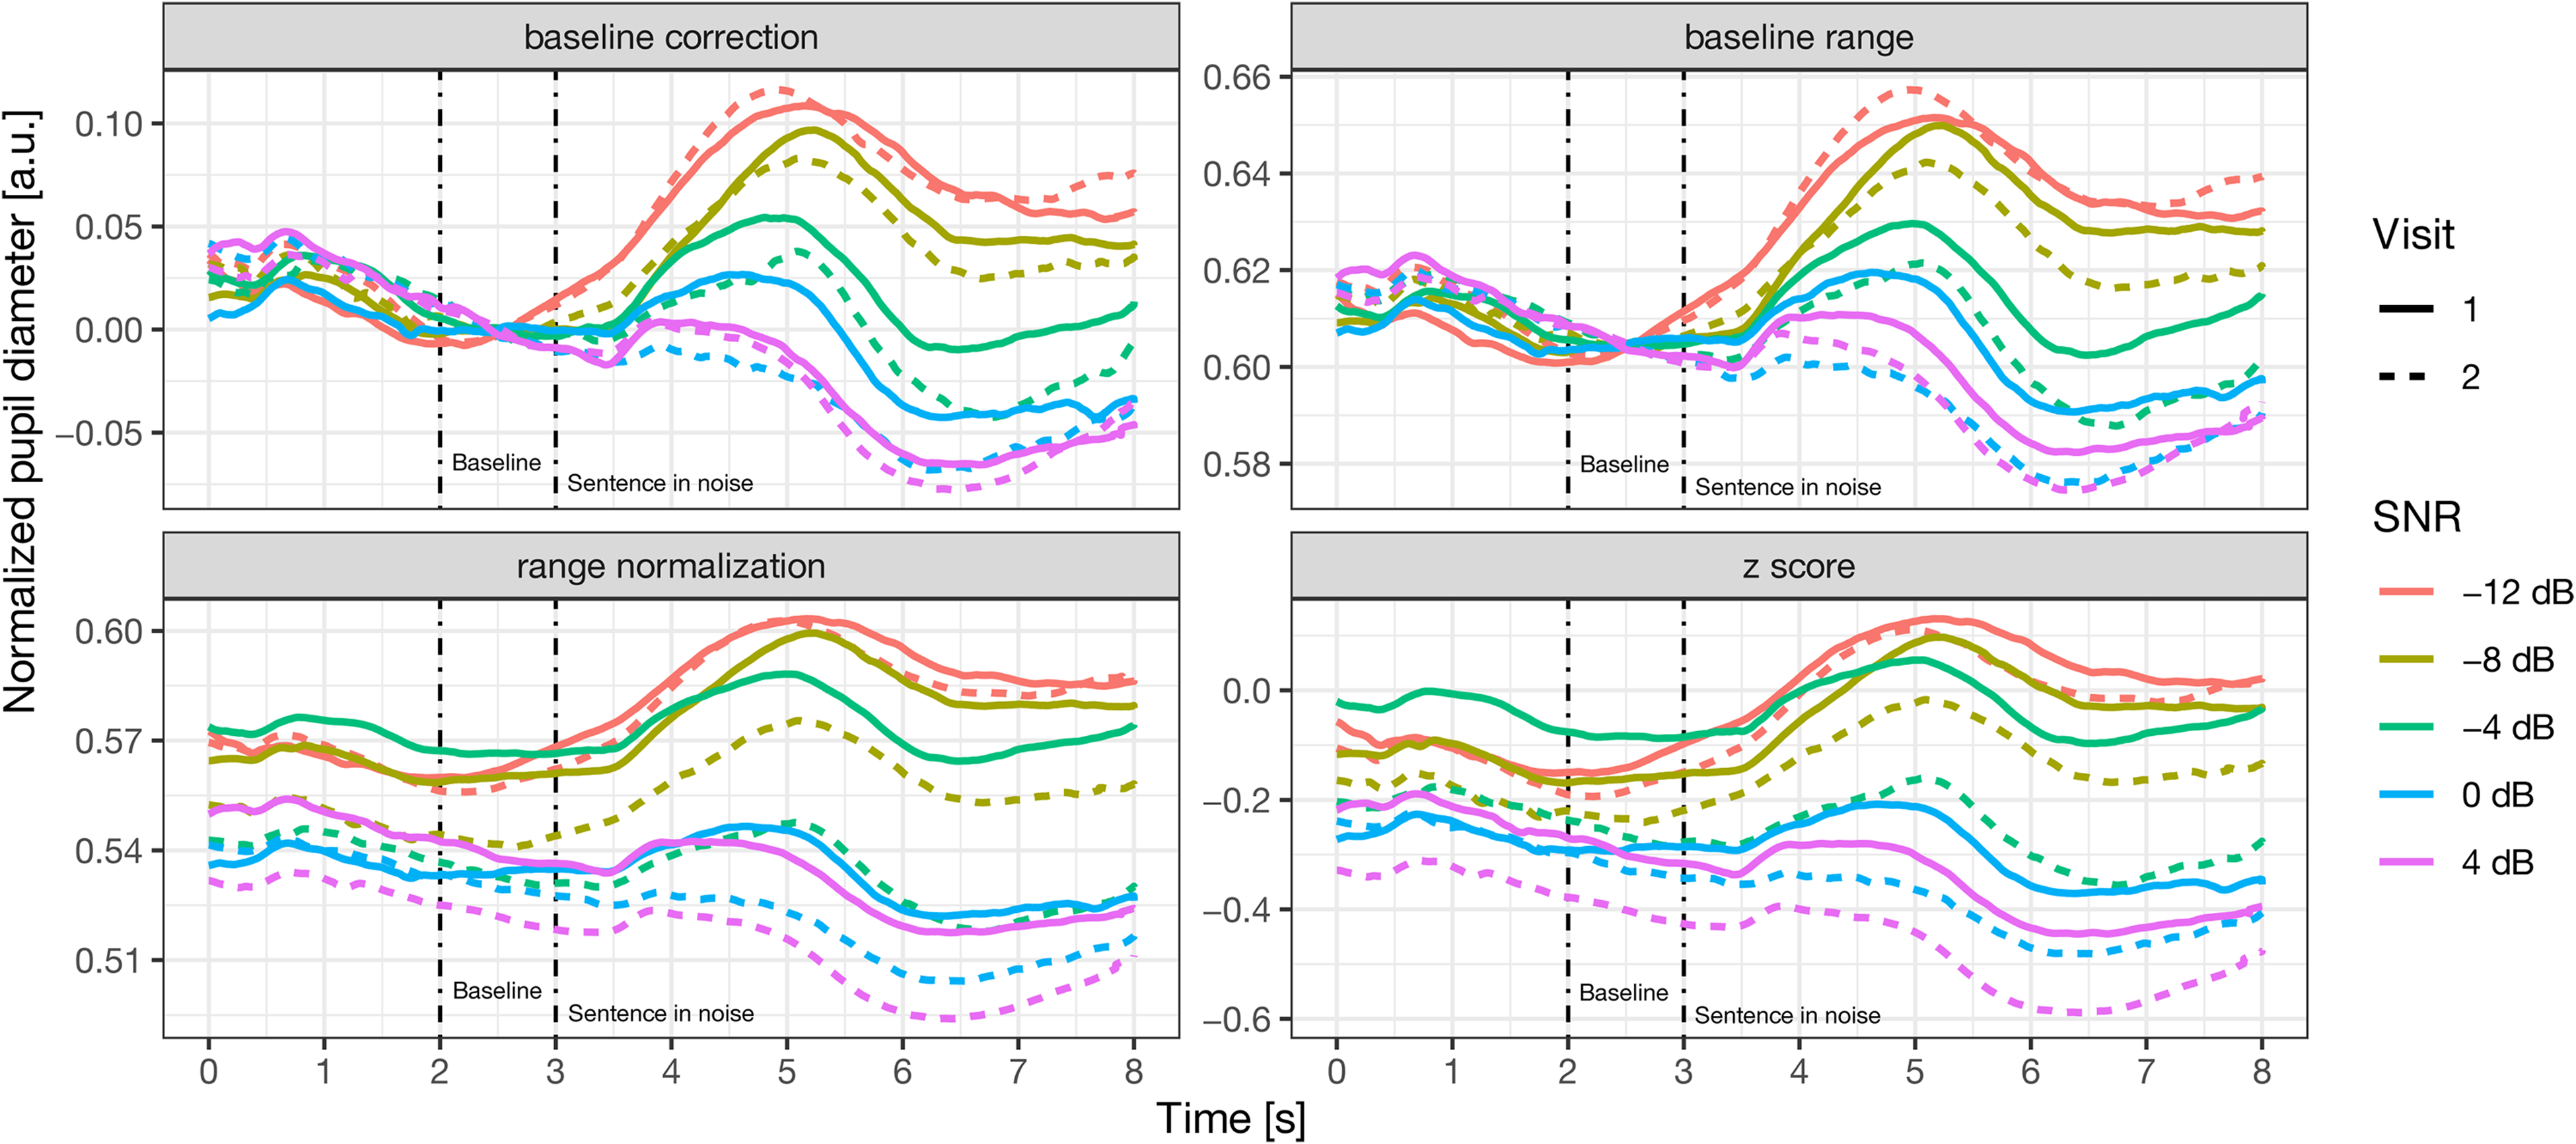
Pupil traces averaged across participants, normalized with different procedures. The SNRs tested are presented in different colors and the Visits are presented in different line types. SNR = signal-to-noise ratio.
Group Level Pupil Features Across Visits and SNRs
The six different pupil features extracted from the group-averaged, baseline-corrected pupil response are displayed in Figure 3 for all three visits and all five SNRs (
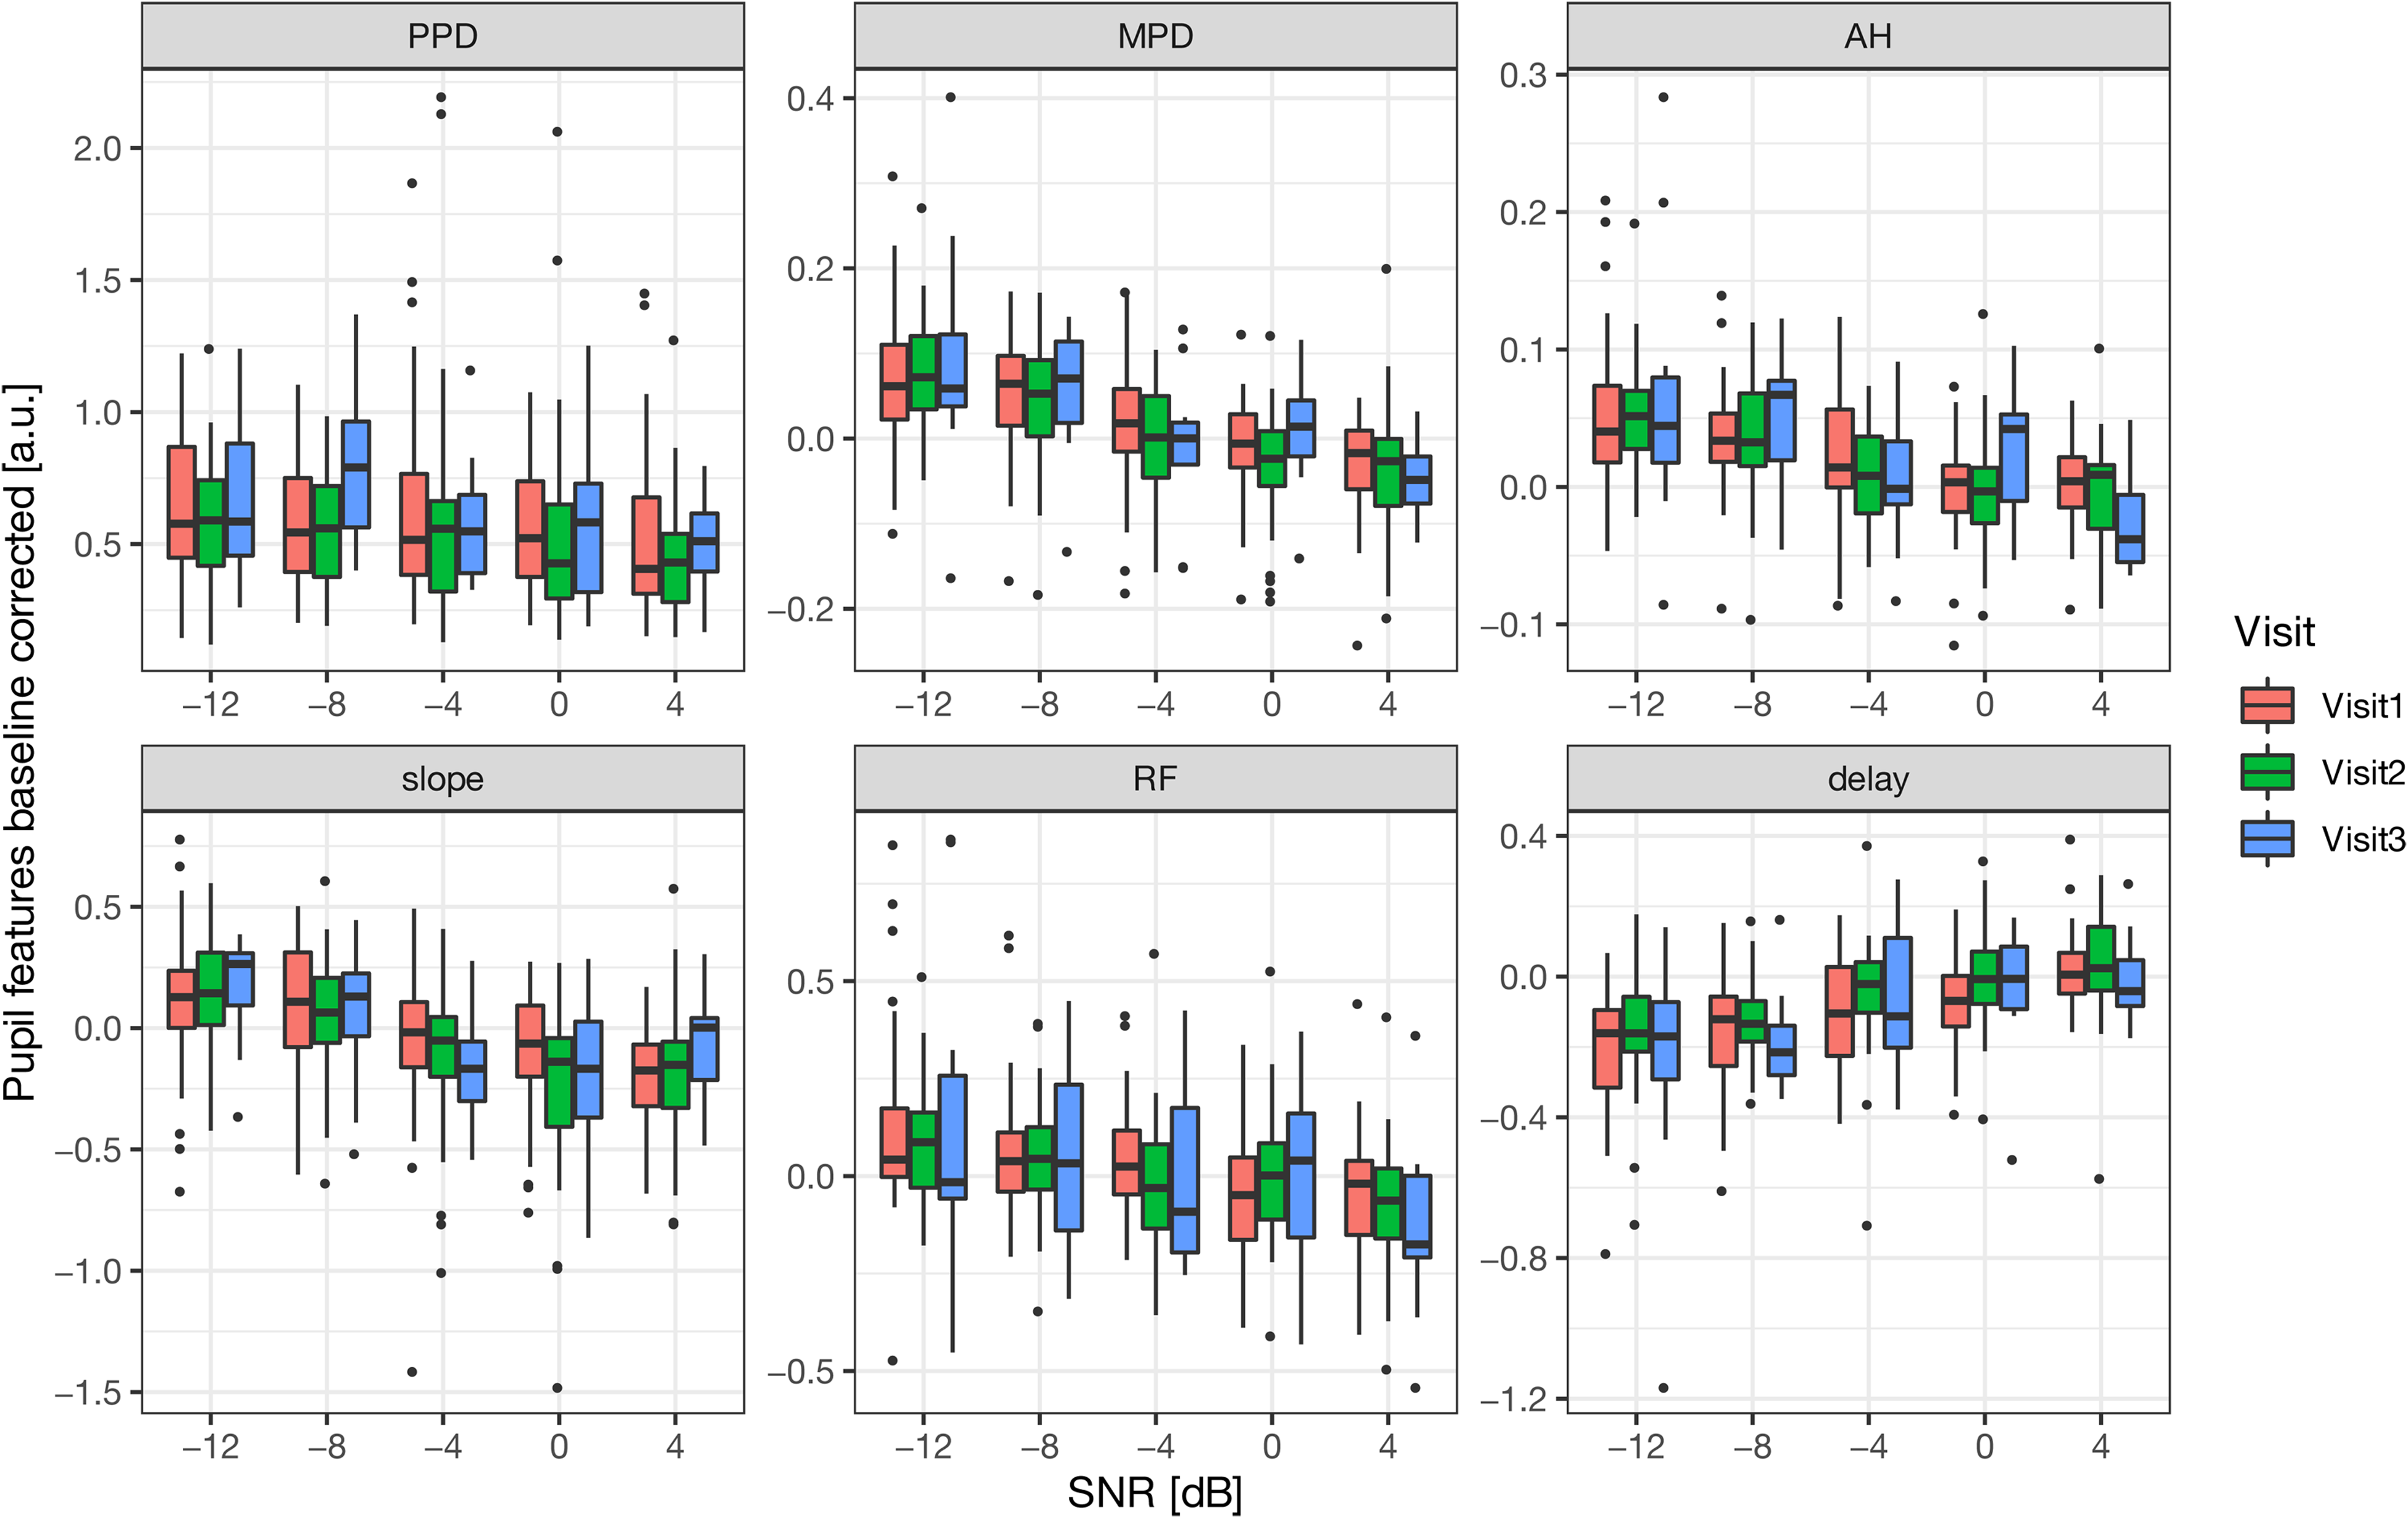
Boxplots of the pupil features PPD, MPD, AH, slope, RF, and delay indicated in the different panels are shown as a function of SNR for three different visits (Visits 1, 2, and 3) indicated by different colors. The mid-line of the boxes represents the median values while the vertical line is the standard deviation. PPD = peak pupil dilation; MPD = mean pupil dilation; AH = average height; RF = rise and fall; SNR = signal-to-noise ratio.
A two-way ANOVA was performed to investigate the impact of SNR and visit on each pupil feature for each normalization procedure. The two factors considered within this method were SNR and Visits. The SNR factor had five levels (
Estimated Coefficients of the Model Obtained when Applying a Two-way ANOVA to Investigate the Effect of SNR and Visit on Different Pupil Features for Different Normalization Procedures.

The intercept is represented by Visit 1,
Validity of the Pupil Measures
In order to assess the validity of all pupil features as markers of listening effort, Pearson correlations between the pupil features and the SNR, the perceived effort measures, and the performance in the task were analyzed (Table 2). All significant values were corrected for family-wise Type 1 error by conducting Bonferroni correction. SNR and task performance were negatively correlated with most of the pupil features. At the same time, a positive correlation was obtained between the perceived effort measures and most of the pupil measures. Note that the correlation coefficients found for the delay (with SNR, perceived effort and task performance) are against the hypothesized direction since a more delayed peak of the response is expected for more unfavorable SNRs (Wendt et al., 2018; Kuchinsky et al., 2013) and with higher perceived effort ratings. To compare the strength of the correlations among the different measurements and different pupil features, a conventional interpretation (i.e., absolute values) of the correlations was used, as the directions of the correlations were as expected. The perceived effort measures, both the self-rated effort scale and the NASA-TLX, showed low correlations provided their absolute values with the pupil features (between 0.1 and 0.35), as compared to SNR (between 0.1 and 0.51) and task performance (between 0.15 and 0.5). SNR and performance provided the highest correlations with the pupil features for the baseline correction (Corr = 0.51) and the baseline range normalization procedures (Corr = 0.49). Overall, the correlation coefficient varied depending on the pupil features. Of all pupil features, MPD, delay, and slope provided the highest absolute values of the correlations for the SNR manipulation technique (between 0.3 and 0.51). The average correlation computed across features was found for the SNR in the case of baseline correction (Corr = 0.24),
Pearson Correlation Coefficients for Different Pupil Features, Calculated through Different Normalization Procedures with SNR, Self-rated Effort Scale, NASA-TLX and Task Performance.

The highest values per row are highlighted in bold. Significant effects are represented as follows:
Speech Recognition Performance
Figure 4 shows the psychometric functions of the performance data (the averaged recognition scores) over the HINT words, averaged across all participants as a function of SNR, for each Visit represented in different colors. Psychometric functions are displayed together with the performance data, to extract SRT for each Visit. Participants achieved high recognition performance (100% correct) at the SNRs between 0 and 4 dB. With decreasing SNR (0 to

The proportion of correct responses as a function of SNR. Results are averaged across listeners. Measured values are shown as filled circles, while fitted psychometric functions are shown by the corresponding-colored solid functions representing the Visits. Red corresponds to measurements obtained during Visit 1, data from Visit 2 is shown in green and blue is used for data measured during Visit 3. SRT was estimated as the first tested SNR where the confidence interval of the psychometric function exceeded the 50% correct threshold (dotted line). Performance data of 31 listeners were measured in Visit 1 and 2, and of 11 listeners in Visit 3. SNR = signal-to-noise ratio; SRT = speech-reception-threshold
Consistency Across Visits and Normalization Procedures
To investigate the impact of the normalization procedure on the consistency of each pupil feature across visits, a Spearman’s correlation analysis was performed with each of the pupil features. Spearman’s correlation coefficients for Visit 1 versus 2 (31 participants), and Visit 1 versus 2, and 2 versus 3 (11 participants) are shown in Table 3 and the individual correlations are shown in Figures 5. For 31 participants, the highest correlation coefficients between Visit 1 and 2 were observed for two pupil features, MPD and PPD, for three out of four normalization procedures (i.e., for baseline correction, baseline range, and range normalization but not for the

Scatter plot depicting the correlation between Visits 1 and 2 per individual across all SNRs and for each pupil feature (PPD, MPD, AH, slope, RF, delay) indicated in the different panels and for each normalization procedure (baseline correction, range normalization, z-score, and baseline range) as indicated by different colors. PPD = peak pupil dilation; MPD = mean pupil dilation; AH = average height; RF = rise and fall; SNR = signal-to-noise ratio.
Spearman Correlations Between Two Consecutive Visits for all Pupil Features Calculated through Different Normalization Procedures.

The values above 0.6 are highlighted in bold, representing good correlation. PPD = peak pupil dilation; MPD = mean pupil dilation; AH = average height; RF = rise and fall; SNR = signal-to-noise ratio.
After correcting for family-wise Type 1 error by conducting Bonferroni correction, significant correlations with
Due to differences in the sample size (i.e., 31 participants for Visit 1 versus Visit 2 and 11 participants for Visit 2 versus Visit 3), a comparison was also made with the pupil features of the same 11 participants at Visit 1 versus 2. Overall, for MPD and PPD, higher consistency was obtained between Visit 1 and 2 than between Visits 2 and 3 for all normalization procedures except for the baseline range normalization. The GCA features showed no clear trend in consistency across visits. Among GCA features a high correlation was only observed in the delay values for the subsample of 11 participants between both, Visit 1-Visit 2 and Visit 2-Visit 3.
ICC - Pupil Features
To examine the reliability of the pupil features on an individual level, ICC values were calculated with 95% confidence intervals and are summarized in Table 4 for Visits 1 and 2 and in Table 7 from the Supplemental material for the subsample of 11 participants for the three sessions. The results were categorized according to Cicchetti (1994), who defined excellent reliability for ICCs above the value of 0.75 and good reliability for ICCs above 0.6. Good reliability is indicated in bold, while excellent results are highlighted in bold italic in the table. Negative ICC values were truncated to zero.
ICC Values for all Normalization Procedures and SNRs between Visits 1 and 2.

Values between 0.6 and 0.75, representing good reliability, are highlighted in bold and values above 0.75, representing excellent reliability, are highlighted in italic bold. The negative ICC values were truncated to zero. ICC = intraclass correlation coefficient; PPD = peak pupil dilation; MPD = mean pupil dilation; AH = average height; RF = rise and fall; SNR = signal-to-noise ratio.
For all features using baseline correction, the ICC analysis showed good to excellent reliability, with ICC values equal to or greater than 0.6. The ICCs for all SNRs have comparable values to Spearman correlations. However, the ICC values varied across SNR without following a general trend. For both, the PPD and MPD, high ICC values were observed for most of the SNRs (see Table 4) when comparing Visits 1 and 2. When applied to the GCA features of the pupil traces, good-to-excellent reliability (ICC above 0.6) was only found for 2 out of 5 of the SNRs for the slope and for 1 out of 5 of the SNRs for the other features (AH, RF, delay). Thus, across all SNRs, the PPD and the MPD showed overall higher ICC values compared to the GCA features.
The range normalization provided good-to-excellent reliability for the traditional PPD with 4 out of the 5 SNRs when comparing Visits 1 and 2. Interestingly, none of the ICC values was above 0.6 for the MPD. The GCA features showed, overall, poor-to-fair reliability between Visits 1 and 2 with a few exceptions (delay at
When the data were baseline corrected and then range normalized within individuals, very high ICC values were observed for PPD, MPD, and AH, indicating that these were the most reliable features across all SNRs between Visits 1 and 2.
ICC - Perceived Effort
The NASA-TLX was analyzed to assess the perceived effort for each condition (Hart & Staveland, 1988). Participants were also asked to evaluate their effort on a scale from 0 to 10 after each condition. Both perceived effort measures were rescaled to a 0-1 scale. Reliability values (ICC) for the perceived effort measures are summarized in Table 5 for Visits 1 and 2 and in Table 6 from the Supplemental material for the subsample of 11 subjects for the three visits. For both NASA-TXL and the self-rated effort scale, good-to-excellent ICC values (above 0.6) were observed for
ICC Values for the Perceived Effort Measures, Comparisons Between Visits 1 and 2, Together with the Mean, Standard Deviation and the Range of these Measures.

ICC values between 0.6 and 0.75, representing good reliability, are highlighted in black bold, and values above 0.75, representing excellent reliability, are highlighted in italic bold. ICC = intraclass correlation coefficient; SNR = signal-to-noise ratio; NASA-TLX = NASA Task Load Index.
Discussion
The present study examined the reliability of the evoked pupil response in a speech-in-noise test paradigm to identify test conditions and analysis techniques that provide the highest test re-test reliability. Specifically, it was analyzed how task demands (manipulated through SNR changes) and data normalization impact the reliability of the evoked pupil response. Overall, the results showed that data normalization procedures have a strong impact and that certain procedures lead to high reliability in the pupil response.
It was hypothesized that reliability would be affected by the normalization procedure of the extracted pupil response. Thus, various normalization procedures that were recommended in previous literature were considered (Winn et al., 2018; Piquado et al., 2010; McCloy et al., 2016). These procedures included baseline correction, two different range normalization procedures, and a
The lowest agreement across all conditions was obtained with the
It was hypothesized that changes in task demands (manipulated through the SNR) would affect the reliability of the pupil features such that higher reliability would be obtained for higher task demands. This was based on previous literature indicating increased reliability with increasing task difficulty (Aday & Carlson, 2019; Zwyghuizen-Doorenbos et al., 1988). Overall, the ICC values varied widely across SNRs, ranging from poor agreement to excellent agreement, and there was no clear trend between the SNR and the agreement. This is in line with other previous literature suggesting that reliability is independent of SNR. For example, Giuliani et al. (2020) reported fair reliability for all test conditions, independent of SNR, with no clear trends across SNRs. While Giuliani et al. (2020) studied only relatively high SNR conditions ranging between 0 and
Note that the task demands were manipulated by varying the SNR. However, participants differed in their performance for a given SNR, meaning that the task demands could differ across individuals at similar SNRs. The correlation analysis indicated that the pupil response in such a speech-in-noise task is related to both SNR manipulations as well as task performance. Correlations with the listener’s perceived effort were, although significant, comparably low. Those results might suggest a better agreement of the pupil response with performance and/or acoustic manipulation as compared to the perceptual effort of the listener. However, the relationship between different measures of effort is unclear. For instance, inconsistencies have been reported between objective and perceived listening effort measures. While several studies on perceived effort have reported decreasing effort investment with the addition of context (Johnson et al., 2015; Holmes et al., 2018), literature assessing objective measures of listening effort (such as reaction times) reported similar levels or increased effort with the addition of context (Tun et al., 2009; Desjardins & Doherty, 2014; Borghini & Hazan, 2020). Furthermore, previous literature suggested that perceived effort measures are only weakly correlated with objective measures. For example, Alhanbali et al. (2019) assessed several measures of listening effort and found only weak average correlations between different measures (see furthermore Strand et al. (2018) for similar findings). Hence, it has been speculated that those different measures of effort may tap into different dimensions of listening effort rather than assessing the same construct. Other literature suggested that listening effort is multi-dimensional and made the most common distinction between objective and subjective effort (Hornsby, 2013; Johnson et al., 2015; Francis & Love, 2020; Herrmann & Johnsrude, 2020). The findings of the current study, showing comparable weak correlations between pupil response and subjective effort, are in line with the literature reporting a rather inconsistent or weak agreement of objective and perceived effort measures.
The scope of this study was to investigate the reliability of pupillometry toward a diagnostic tool. In order to identify the potential benefits of HA interventions on individual’s listening effort, and due to the fact that current hearing aid processing schemes, such as noise reduction, can effectively reduce the SNR, the current study chose a SNR manipulation for changing task demands. However, reliability only constitutes one aspect of evaluating pupillometry as a listening effort measure. A limitation of the method arises since a mental process, such as effort, is difficult to perfectly reproduce in consecutive sessions.
In contrast to Wendt et al. (2018), there was no evidence of disengagement in the group-level analysis, which would have been illustrated by a reduced pupil response at the lowest SNRs (e.g.,
A higher reliability for each of the pupil features was expected to be obtained between Visits 2 and 3 compared to Visits 1 and 2. This expectation was attributed to potential global arousal or to a learning effect due to the novelty of the task that could occur in the first visit compared to the subsequent visits (Alamia et al., 2019; Widmann et al., 2018). In general, the results (ICC and correlation analysis) suggested no significant impact of the number of visits on most of the pupil features. At the same time, the
Note that only 11 participants out of the 31 were tested on the third visit, and, consequently, a comparison between the reliability at different visits was performed for only a subsample of 11 participants. Since ICC analysis requires a minimum of 30 participants in order to provide sufficient power Koo & Li (2016), a Spearman correlation on this subsample of participants was performed to verify the conclusions. The ICC and Spearman’s correlation results for Visits 1-2 were similar, such that no trend of correlation coefficients was found with an increasing number of visits. Further testing with a larger sample of subjects participating in three visits would be needed to better clarify how the reliability changes with more than two visits.
Overall, it seems that the traditional pupil features (i.e., PPD and MPD) are more reliable than the temporal features. This finding is in line with other studies that only considered PPD and MPD as relevant features (Kramer et al., 1997; Zekveld et al., 2010; Wendt et al., 2018). Nonetheless, all the pupil features in the current study were, in one way or another, aggregated values of a time series of the pupil response. The aggregation of the pupil response over all trials and within the final trial can limit the understanding of the entire time series and its associated reliability. This aspect was partly addressed by including the GCA temporal features. However, assessment of the reliability of the pupil response using nonaggregating methods could lead to a different conclusion.
The reliability of the perceived listening effort measures (i.e., NASA-TLX and the self-rated effort scale) was assessed, and the perceived listening effort showed, in most of the cases, a reliability that was on par with the pupil features, in line with previous literature (Alhanbali et al., 2019; Giuliani et al., 2020). This study reported slightly higher, or similar reliability between measures of perceived effort and the PPD or MPD, irrespective of the normalization procedure applied. Similarly with the pupil features results, no clear patterns in the reliability of perceived effort across all of the SNRs and normalization procedures were found.
The current study assumes that effort investment will be approximately constant over repeated visits, as long as task demands (SNR manipulation) and other external factors (i.e., luminosity, caffeine intake, day and time of the test) are well-controlled. However, the assumption that a listener will invest the exact same amount of listening effort with a given difficulty level in both sessions, and that the pupil will perfectly reflect this effort investment, might not reflect the complexity of the mental processes involved in effort deployment. It has been argued that other aspects related to the personal or mental state of the listener, including arousal or cognitive capacity limits due to being fatigued, can affect effort investment (Pichora-Fuller et al., 2016). In fact, it is argued that those factors most likely vary over time. For example, the arousal level might change due to the listener getting familiar with the task which, in turn, influences effort allocation. However, it was outside the scope of the current study to strictly control for these factors. Instead, our study aimed to explore the reliability of pupillometry, which is a prerequisite to the potential use of pupillometry as a diagnostic tool to, for example, identify potential benefits of HA interventions on an individual’s listening effort. However, it is suggested that future studies should examine the role of the mental state of the listener (including aspects of motivation and fatigue) with regards to effort investment in a speech-in-noise task.
This investigation provided a systematic approach to assess the reliability of various pupil features, involving external manipulations and data processing. A strong effect on reliability is shown by data normalization. However, since many methodological aspects are involved in pupil data preprocessing (i.e., detrending, blink detection and removal by interpolation, smoothing, and trial rejection), further research is needed to clarify the impact of each data-preprocessing step on the reliability of the extracted pupil features. Eventually, those findings could contribute to establishing a standardized pupil preprocessing methodology.
Overall, several pupil features as potential indicators of listening effort, revealed high reliability only in some particular cases (i.e., baseline range normalization procedure). Therefore, careful consideration of the data normalization procedure used when processing and studying individual’s pupil response is recommended.
Conclusion
The current study examined the reliability of pupillometry with several normalization procedures and feature extraction methods, while also assessing the impact of SNR and the number of visits on the resulting reliability. Overall, the results suggest that SNR and the number of visits only have a minor impact on the reliability of the pupil response, at least within a speech-in-noise test paradigm. Moreover, to obtain the highest reliability across SNRs, baseline correction combined with range normalization is recommended when analyzing the pupil response of individual listeners. Moreover, the stationary features (i.e., PPD and MPD) are the most reliable features. Overall, these reliability results may provide valuable insights for determining the future of pupillometry as a potential diagnostic tool in the clinic. The data will be made available upon reasonable request.
Supplemental Material
sj-pdf-1-tia-10.1177_23312165231153288 - Supplemental material for Investigating the Reliability of Pupillometry as a Measure of Individualized Listening Effort
Supplemental material, sj-pdf-1-tia-10.1177_23312165231153288 for Investigating the Reliability of Pupillometry as a Measure of Individualized Listening Effort by Mihaela-Beatrice Neagu, Abigail A. Kressner, Helia Relaño-Iborra, Per Bækgaard, Torsten Dau, and Dorothea Wendt in Trends in Hearing
Footnotes
Declaration of Conflicting Interests
The author(s) declared no potential conflicts of interest with respect to the research, authorship, and/or publication of this article.
Funding
The author(s) disclosed receipt of the following financial support for the research, authorship, and/or publication of this article: This work was supported by the William Demant Foundation.
Supplemental Material
Supplemental material for this article is available online.
Appendices
References
Supplementary Material
Please find the following supplemental material available below.
For Open Access articles published under a Creative Commons License, all supplemental material carries the same license as the article it is associated with.
For non-Open Access articles published, all supplemental material carries a non-exclusive license, and permission requests for re-use of supplemental material or any part of supplemental material shall be sent directly to the copyright owner as specified in the copyright notice associated with the article.