
Abstract
There is lack of a systematic approach concerning how to select an adequate hearing aid and how to evaluate its efficacy with respect to the personal needs of rehabilitation. The goal of this study was to examine the applicability and added value of two widely used self-reporting questionnaires in relation to the evaluation of hearing aid fitting. We analyzed responses, pre- and postfitting, from 1,319 subjects who completed the Client Oriented Scale of Improvement (COSI) and a slightly adapted version of the Amsterdam Inventory for Auditory Disability and Handicap (in Dutch: AVAB). Most COSI responses were at or near the maximum possible score. Results show a close relation between COSI’s degree of change and final ability (Spearman’s rho = 0.71). Both AVAB and COSI showed a significant effect of hearing aid experience, but—in contrast to AVAB—COSI did not show a significant effect of the degree of hearing loss. In addition, a Friedman test showed significant differences between six dimensions of auditory functioning for both AVAB and COSI, although post hoc analysis revealed that for COSI, the dimension speech in quiet explained most variation between dimensions. In conclusion, the effects of hearing loss were more salient in AVAB, while both AVAB and COSI showed differences regarding hearing aid experience. Combining the advantages of both methods results in a detailed evaluation of hearing aid rehabilitation. Our results therefore suggest that both methods should be used in a complementary manner, rather than separately.
Keywords
Introduction
Audiological diagnostic tests provide well-defined and appropriate methods to survey auditory functioning. Not only are these tests necessary in the assessment of auditory ability, they are also essential for the selection and fitting of hearing aids. Nonetheless, audiometric data and performance scores do not fully reflect the patient’s rehabilitation needs in real-life situations. For instance, average values derived from pure-tone audiometry have a low predictability for the subjective difficulty experienced during daily listening situations (Kramer, Kapteyn, Festen, & Tobi, 1995). Assessment of auditory ability usually takes place under optimized conditions. Therefore, it may occur that test outcomes indicate an improvement in an optimized situation, while the same test would produce a poorer or even negative outcome in a more realistic situation (Dillon, James, & Ginis, 1997). Daily life situations represent a broad range of different acoustical environments, consisting of varying speech levels, fluctuating noises, and reverberation, that are not well covered by the available diagnostic test methods.
Besides audiometric data and performance scores, such as pure-tone audiometry and speech intelligibility measurements, a patient’s personal experience and judgment are known to be essential factors in the rehabilitation with hearing aids. Patient-Reported Outcome Measures (PROMs) reveal additional information that could otherwise be overlooked and offers a complementary method for evaluation in terms of auditory disability, rehabilitation needs, benefit of a hearing aid fit, and satisfaction of the total fitting process (Saunders, Chisolm, & Abrams, 2005). This process includes hearing aid selection, counseling, and a trial period. The relevance of PROMS is increasing, given the need for justification of hearing aid selection and the increasing demand for evidence-based practice (Dillon, Birtles, & Lovegrove, 1999; Saunders et al., 2005). PROMS are by design very suitable methods to collect and assess such information.
Amsterdam Inventory for Auditory Disability and Handicap
The Amsterdam Inventory for Auditory Disability and Handicap (AIADH), developed by Kramer et al. (1995), is a good example of a questionnaire to assess hearing disabilities with a high reliability and validity (Fuente, Mcpherson, Kramer, Hormazábal, & Hickson, 2012; Meijer, Wit, Tenvergert, Albers, & Muller Kobold, 2003). This PROM comprises 29 items that reflect a variety of daily-life listening situations. Each item comes with an explanatory cartoon and the subject is asked to indicate how well he or she performs, making use of a 4-point scale. In this study, a slightly adapted version of the AIADH was used, called AVAB (in Dutch: Amsterdam Questionnaire for Auditory Disabilities). Three additional items were added to the existing items, including explanatory cartoons. The items were introduced to cover aspects of noise tolerance. The added questions can be translated as follows: (a) “Does it disturb you when the radio is on during a conversation?” (b) “Do you reduce the volume of the radio or switch it off completely for the benefit of a conversation?” and (c) “Do you perceive sounds from household appliances as very annoying?” This makes a total of 32 items whose scores eventually provide a six-dimensional auditory functioning profile. This profile includes individual scores for the detection of sounds, speech in quiet, speech in noise, auditory localization, sound discrimination, and noise tolerance (see also Dreschler & De Ronde-Brons, 2016). Not only could the characteristics of the AVAB be advantageous in selecting and fitting a hearing aid according to the specific needs of a patient, but it might also be an appropriate tool for evaluating the benefit of a hearing aid with respect to different aspects of auditory functioning. When pre- and postfitting AVAB scores are available for each auditory disability dimension, the differences between those outcome measures might help in constructing a measure of hearing aid benefit.
Even though AVAB consists of a wide variety of daily-life situations, it is a questionnaire with fixed questions, limited to a fixed list of general listening conditions, which are not necessarily applicable for each patient. Furthermore, the items on the questionnaire are assumed to be of equal importance. This could introduce a potential bias when interpreting the outcome measures resulting in a reduced validity of the questionnaire (Dillon et al., 1997) and could be considered an important drawback (Saunders et al., 2005).
Client Oriented Scale of Improvement
Alternatively, Dillon et al. (1997) introduced the Client Oriented Scale of Improvement (COSI) for the evaluation of hearing aids, which makes use of personally defined targets for rehabilitation. The COSI was aimed to resolve several problems which may arise in self-reported methods that make use of fixed questions, such as AVAB (Gatehouse, 2001; Stephens & Kramer, 2010). For instance, some questions may be highly irrelevant to the individual rehabilitation needs, yet do not differ in terms of weighting when final outcome scores are constructed. To overcome this problem, the COSI was designed as an alternative method, where subjects compose their own questionnaire prior to hearing aid fitting by defining well-described personal rehabilitation targets. An example of a personal target could be “hearing my spouse better during TV watching at home.” Subsequently, goals can be prioritized to define the most important rehabilitation targets. After a trial period with hearing aids, these targets are evaluated based on two outcome measures: final ability (FA) and degree of change (DC). Both outcome measures are scored on a 5-point rating scale. As COSI differs to some extent from typical PROMs, the authors refer to Dillon et al. (1997) for a comprehensive and in-depth description of the COSI method.
Defining the client’s targets provides insight into the client’s expectations (Dillon & So, 2000) and rehabilitation needs. It is essential that the most important hearing-related problems are identified prior to a hearing aid fitting, since solutions for some of the problems may not be optimal for solving some other problems (Bennett, Laplante-Lévesque, Meyer, & Eikelboom, 2017; Gatehouse, 2001). Focusing on personal needs and expectations makes COSI very useful for individual patients, but complicates the comparison of rehabilitation needs or related benefits for groups of patients (Cox et al., 2000; Saunders et al., 2005). Nevertheless, COSI is still frequently used in clinical practice, but for research purposes and evaluation over groups of patients, its applicability is limited. Improvements to the quantification of the COSI to enhance compatibility between groups of patients have been suggested by several authors (Cox et al., 2000; Dillon et al., 1999; Zelski, 2000). To overcome the problem of comparability between individual targets, Dillon et al. (1997) proposed categorizing each target into a total of 16 predesignated categories. Detailed examination of the COSI by Zelski (2000) showed a high level of interobserver agreement, but indicated that the number of categories could be reduced.
Combination AVAB and COSI
Evaluating hearing aid benefit requires a multidimensional approach including multiple factors (Humes, 1999), and the patient’s personal rehabilitation needs should be taken as the primary focus and should be evaluated accordingly. There is a pressing demand for an evaluation method that is individually tailored but also offers the possibility of collecting quantitative information in order to facilitate comparison between clients (Gatehouse, 2001). Combining the AVAB and COSI may be a first step toward a more sophisticated method for the evaluation and selection of hearing aids, which is characterized as being sensitive as well as specific. It has been shown by Dreschler and De Ronde-Brons (2016) that individual COSI targets can be categorized to match the six dimensions of which the AVAB auditory disability profile is composed. This opens the possibility to compare individual hearing disabilities and individual compensation targets to match the same six dimensions as the AVAB auditory disability profile. An advantage of using the same dimensions for AVAB and COSI is that, when using both AVAB and COSI, the COSI can help the interpretation and weighting of the AVAB results for each individual. For example, AVAB results for a subject may indicate that there is room for improvement within a specific auditory dimension, but COSI may show that this dimension is by no means relevant to the individual. In this situation, the focus of rehabilitation could be shifted toward a more urgent auditory dimension which was instigated by the combined use of AVAB and COSI.
Goal of the Study
The goal of this study was to examine the applicability and added value of the COSI and AVAB methods in relation to the evaluation of a hearing aid fitting. We hypothesize that when combined, the two PROMs will be complementary rather than redundant, since both methods differ by design. Analyses are subdivided into the following steps: (a) the correspondence between the COSI and AVAB results, (b) evaluation of degree of change and final ability of COSI results, (c) evaluation of pre- and postfitting AVAB results, (d) the effects of hearing loss and level of experience on these results, and (e) evaluation of the six different dimensions in both AVAB and COSI.
Methods
Data were collected from hearing aid dispensers and audiological centers in the Netherlands that took part in a study which explored the advantages of PROMS in the hearing aid rehabilitation process as part of a new protocol.
Subjects
A representative sample of both new hearing aid users and experienced hearing aid users who needed replacement of their hearing aid, were included from 64 hearing aid dispensers and 10 audiological centers in the Netherlands. Permission for the use of anonymous data for retrospective analysis was either granted by means of an informed consent (subjects that were included from the hearing aid dispenser), or by verbal agreement (subject that were included from the audiological centers). Subjects participated voluntarily and were included when they fully completed the hearing aid fitting process including the purchase of the hearing aid. All subjects were over 18 years of age. Subjects were excluded in case of: (a) missing or incomplete pre-AVAB, post-AVAB, or absence of COSI targets (subjects that evaluated only part of the COSI targets were also included because the information of the targets that were evaluated was judged to be relevant); (b) missing or insufficient audiometric data (e.g., noncompliant data entries such as text); and (c) a CROS-fitting.
Protocol
Data gathering took place over a period of 10 months in case of the hearing aid dispensers and 43 months for the data from audiological centers. Participating personnel that were involved in the selection and fitting of the hearing aid were instructed on the process of administering the AVAB and COSI questionnaires and how to handle results in a uniform manner. Disparity between hearing aid dispensers and audiological centers (e.g., commercial vs. noncommercial focus) resulted in only minor procedural differences, which may be assumed to have no effect on the data. Auditory disability, before and after the hearing aid fitting, was assessed by the AVAB method. In addition, the COSI method was implemented to define individual rehabilitation targets and to measure the degree of change due to the hearing aid fit and the final ability afterwards with respect to the individual targets.
Prior to the hearing aid selection and fitting process, pre-AVAB questionnaires were administered to the subjects, which could be completed at home. Upon completing the pre-AVAB questionnaire, subjects were asked to describe and prioritize a maximum of five situations in which they experience hearing difficulties. Multiple situations could be assigned the same priority. These situations formed the basis for formulating the COSI in dialogue with the hearing aid dispenser or clinician, who also assigned matching AVAB dimensions to each COSI target (multiple dimensions per target were possible). In addition, pure-tone audiometry and speech audiometry were deemed mandatory aspects for the selection of a new hearing aid. At the end of a trial period, COSI targets were evaluated resulting in scores for degree of change and final ability for each individual target. Evaluation of COSI targets was done in dialogue with the hearing-aid dispenser or clinician, who filled in the responses. In addition, a post-AVAB questionnaire was administered, which could be completed at home by the subjects themselves. This questionnaire was identical to the preceding pre-AVAB questionnaire. Speech intelligibility in quiet, with and without the fitted hearing aid, was assessed as part of the final assessment of the benefit of the fitting. The fitting, trial, and evaluation process was similar for first-time users and experienced users, although the latter were asked to judge the items of the pre-AVAB questionnaire while using their old hearing aids.
Data Analysis
For comparison between subjects, individual AVAB item scores for each subject were further processed to obtain average scores for each of the six dimensions of auditory functioning (four to eight items per dimension). These average scores per dimension were used to compute overall mean and median scores for each subject, for both pre- and post-AVAB. Similarly, COSI outcome measures were processed to obtain overall mean scores as well as mean scores per dimension if applicable. Thus, overall AVAB and COSI scores represent the mean of the scores per dimension of auditory functioning for each subject, not the mean of all individual items.
Statistical methodology
Prior to the selection of statistical methods, the distributions of the data were evaluated on all six dimensions for both COSI final ability and degree of change as well as pre- and post-AVAB. The COSI data in particular appeared to be nonnormally distributed, as was the post-AVAB data for some dimensions. Accordingly, nonparametric statistics were used throughout the data analysis. The use of nonparametric tests results in minimal power loss when data are normally distributed; however, when the assumptions of normality are not met, the power gain is substantial (Kitchen, 2009). To explore relations between the questionnaire outcome measures (COSI degree of change and final ability and pre- and post-AVAB), we used Spearman’s rank correlation. For comparison of COSI and AVAB outcomes between first-time users and experienced users, we used a Wilcoxon rank-sum test. The latter was also used to compare differences between COSI results obtained from targets classified as first priority and results obtained from lower priority targets, and to compare AVAB scores grouped by the presence of a matching COSI target within dimensions. The effect of hearing aid experience and hearing loss on COSI and AVAB outcome measures was assessed using Spearman’s rank correlations. To compare within each questionnaire between outcomes for the six different dimensions of auditory functioning, we used a Friedman test as a nonparametric alternative to a repeated-measures ANOVA. The Friedman test was complemented with a Wilcoxon-Nemenyi-McDonald-Thompson post hoc procedure (Pereira, Afonso, & Medeiros, 2014) to investigate potential group differences between dimensions of auditory functioning.
Results
Subject Characteristics.

Note. PTA = pure-tone averages.
Distribution of Number of COSI Targets per Subject and COSI Targets per Dimension of Auditory Functioning.

Note. Median scores (overall and per auditory disability dimension) for COSI Final Ability (FA), COSI Degree of Change (DC), pre-AVAB and post-AVAB. Det = Detection of sounds; SiQ = Speech in Quiet; SiN = Speech in Noise; Loc = auditory Localization; Dis = sound Discrimination; Tol = noise Tolerance; COSI = Client Oriented Scale of Improvement; AVAB = Amsterdam Inventory for Auditory Disability and Handicap.
Not all COSI targets were evaluated; therefore, it is possible that the total number of formulated COSI targets is less than the total included number of subjects.
Overall Scores for AVAB and COSI
Figure 1 shows cumulative distributions of overall AVAB and COSI scores (scores averaged over the six dimensions). These cumulative plots show the percentage of subjects whose COSI or AVAB score had a value less than or equal to the score indicated on the x-axis. Both pre- and post-AVAB scores correspond to a scale ranging from (1) almost never, (2) occasionally, (3) frequently to (4) almost always, whereas COSI FA scores correspond to (1) hardly ever, (2) occasionally, (3) half of the time, (4) most of the time, and (5) almost always. COSI DC scores correspond to (1) worse, (2) no difference, (3) slightly better, (4) better, and (5) much better. For COSI, the results described by Dillon et al. (1999) are also plotted in Figure 1(a). Figure 1(c and d) represents the distribution of both COSI FA and pre- and post-AVAB scores in histograms. Both post-measures (COSI FA and post-AVAB) show skewed distributions. For COSI FA, over 77% of all subjects reported mean scores equal or greater than 4 and 23% reported the maximum score on all given targets. There is a close relation between COSI FA and COSI DC on an individual basis (Spearman’s rho = 0.71, p < .001).
(a) Cumulative distributions of overall mean COSI results, degree of change (black), and final ability (gray). Dotted and striped lines show results found by Dillon et al. (1999). Scores on the x-axis for COSI and AVAB measures relate to responses for each AVAB item or COSI target and should therefore be interpreted accordingly. AVAB results (b) show overall mean prefitting results (black) and postfitting results (gray). Histograms of overall COSI Final Ability scores (c) and pre- and post-AVAB scores (d). COSI = Client Oriented Scale of Improvement; AVAB = Amsterdam Inventory for Auditory Disability and Handicap.
Correlations Between COSI and AVAB Outcome Measures.

Note. COSI = Client Oriented Scale of Improvement; AVAB = Amsterdam Inventory for Auditory Disability and Handicap; FA = final ability; DC = degree of change.
Effects of Hearing Aid Experience
Figure 2 shows the distribution of COSI FA and overall pre- and post-AVAB results separately for first-time and experienced users. A Wilcoxon rank-sum test showed significant differences between first-time and experienced users, both for COSI (difference in median score = 0.27, p < .001) and for pre-AVAB (difference in median score = 0.19, p < .001) and post-AVAB (difference in median score = 0.27, p < .001) scores. Also, significant differences (p < .001) were found for degree of hearing loss between experienced users (median pure-tone averages of the better ear [PTAB] = 51.3 dB HL) and first-time users (median PTAB = 36.3 dB HL). The effect of hearing aid experience on the outcomes measures of COSI and AVAB was statistically significant but rather small (highest Point-Biserial rank correlation is for post-AVAB scores with ρpb = 0.29, p < .001, see also Table 4).
Overall COSI FA (left) and pre- or post-AVAB (right) cumulative distributions for first-time users and experienced users. COSI = Client Oriented Scale of Improvement; AVAB = Amsterdam Inventory for Auditory Disability and Handicap. Effect Size Hearing Aid Experience (Spearman’s Point-Biserial Rank Correlation: ρpb) and PTAB (Spearman’s Rank: ρ) on Overall COSI FA and AVAB Results. Note. PTAB = pure-tone averages of the better ear; COSI = Client Oriented Scale of Improvement; AVAB = Amsterdam Inventory for Auditory Disability and Handicap; FA = final ability. p < .001.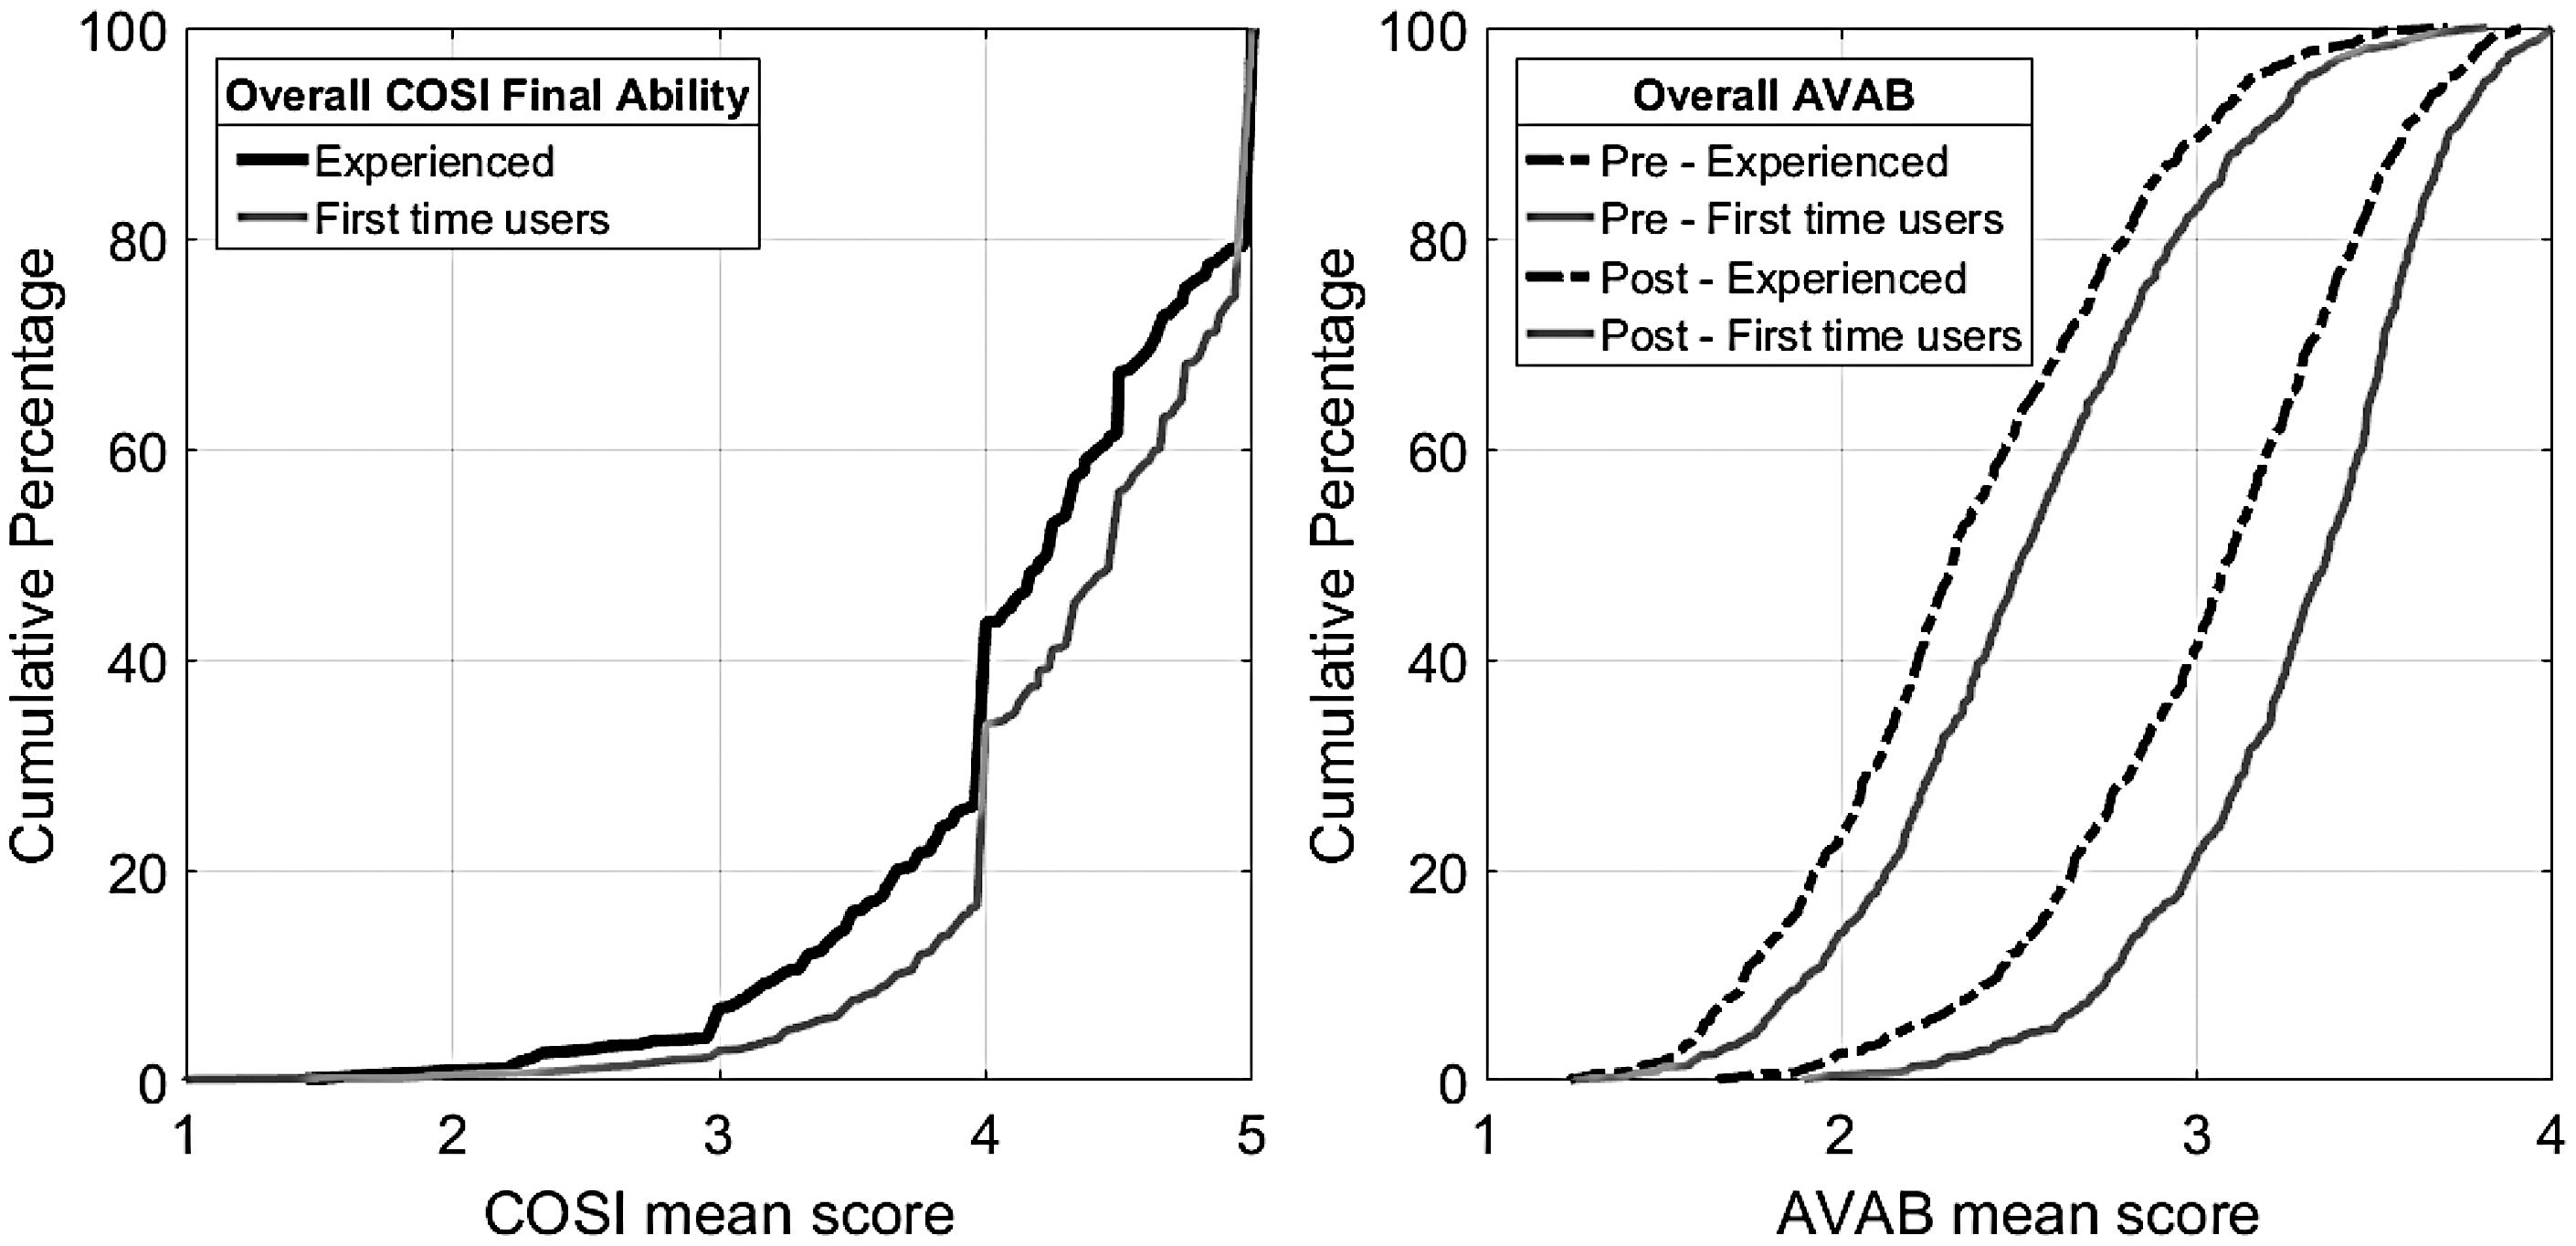

Effects of Degree of Hearing Loss
To analyze the effects of hearing loss on overall COSI and AVAB results, we calculated Spearman’s rank correlations (Table 4) to determine the dependency of overall COSI or AVAB scores on PTAB. A significant but weak correlation was found between overall AVAB results and PTAB (pre-AVAB: ρ = −0.24, p < .001; post-AVAB: ρ = −0.25, p < .001). Overall, COSI FA results did not show a significant correlation with PTAB (ρ = −0.04, p = .21).
Figure 3 shows scatter plots of overall COSI FA and AVAB results plotted against PTAB, which facilitates a graphical interpretation of the correlation results. Examination of the scatterplots shows that the distribution of overall COSI FA scores is comparable over a large range of PTAB and is mainly clustered around COSI Scores 4 and 5; yet, pre- and post-AVAB scores show a more spread-out distribution and a recognizable association between overall score and PTAB.
Scatter plots of PTAB (x-axis) and overall pre-AVAB (left), post-AVAB (middle), and COSI FA (right) plotted on the y-axis. Data points were smoothed: darker areas represent a higher concentration of data points. COSI = Client Oriented Scale of Improvement; AVAB = Amsterdam Inventory for Auditory Disability and Handicap; PTAB = pure-tone averages of the better ear.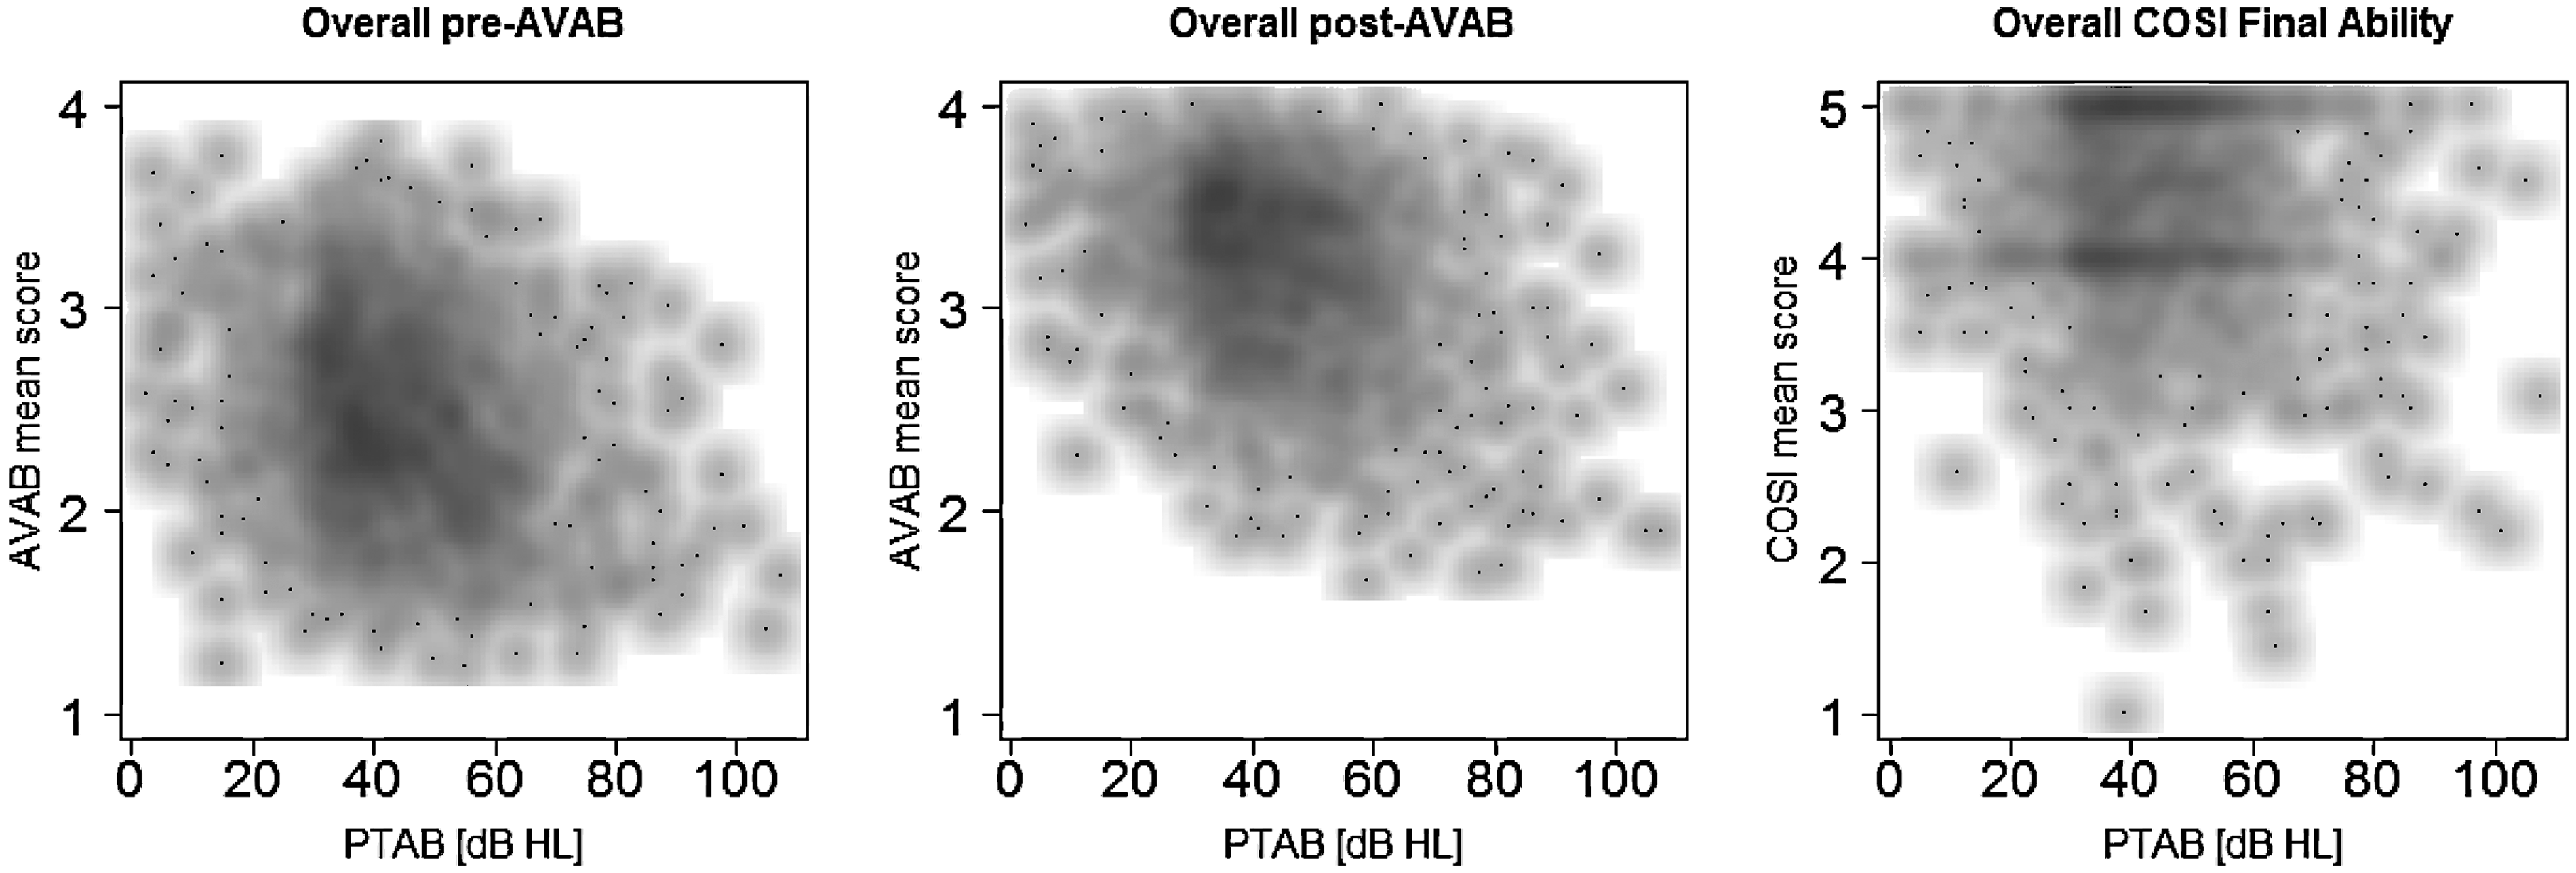
Effects for Different Dimensions of Auditory Functioning
Individual COSI targets were categorized according to the six dimensions of auditory functioning, with a specific contribution (Table 2) of matched COSI per dimension. Figure 4 shows boxplots for pre- and post-AVAB scores and COSI final ability scores on all six dimensions of auditory functioning. It should be noted that these results comprise different numbers of responses between COSI and AVAB per dimension, which prevent a direct comparison. A Friedman test showed strong significant differences between the six dimensions of AVAB responses, both prefitting (X2 = 2,377.1, p < .001) and postfitting (X2 = 2,035.4, p < .001).
Boxplots of COSI and pre- and post-AVAB scores per auditory disability dimension: Det = Detection; SiQ = Speech in quiet; SiN = Speech in noise; Loc = Localization; Dis = Discrimination; Tol = Noise tolerance; COSI = Client Oriented Scale of Improvement; AVAB = Amsterdam Inventory for Auditory Disability and Handicap.
Similarly, differences among COSI scores between dimensions of auditory functioning were analyzed. However, not all subjects had one or more COSI targets matched to each of the six dimensions. This resulted in “missing” scores for dimensions that were not matched to any of the subjects’ COSI targets. To overcome this, a subgroup (n = 120) was created, which consisted solely of subjects with a mean COSI score for each dimension. No significant differences were found between this subgroup and the total group, which suggested that the subgroup can be regarded as a representative sample of the total group. The subgroup was used to analyze differences among COSI dimensions, and a significant difference (X2 = 18.2, p = .003) was found between the mean scores of COSI auditory disability dimensions. Yet, post hoc analysis for pairwise multiple comparisons revealed that the significant differences found between dimensions could be attributed entirely to the dimension speech in quiet.
Pre- and post-AVAB scores could be attributed to each dimension of auditory functioning using the specific contribution of COSI scores (Table 2). More specifically, the dispenser or clinician matched each COSI target to one or more AVAB dimensions. Thus, for each AVAB dimension, there was one group of subjects who also had a COSI target on that dimension and another group of subjects without corresponding COSI target. A Wilcoxon rank-sum test showed significant differences (p < .001) between these two subgroups for the pre-AVAB scores for the dimensions detection, speech in quiet, and localization. For post-AVAB scores, significant differences were found within the dimensions speech in quiet (p < .01), localization (p < .01), and tolerance (p < .05). In all those cases, AVAB scores were lower for the group that had a corresponding COSI target.
Discussion
Our study focused on the combination of two PROMs (COSI and AVAB) for the selection and evaluation of hearing aids. The primary goal of this study was to determine the applicability and added value of combining the COSI and AVAB methods in relation to the evaluation of a hearing aid fitting. In a representative population of Dutch hearing aid users, both COSI and AVAB show a beneficial effect of fitting new hearing aids for six dimensions of auditory functioning. AVAB scores show more differentiation compared with COSI scores between degrees of hearing loss and between the six dimensions of auditory functioning. Both COSI and AVAB scores showed differences between first-time user and experienced user.
The current study indicates that the two outcome measures resulting from COSI (degree of change and final ability) are closely related. Both measures show similar overall cumulative distributions, as well as a moderate to strong correlation between individual scores. These results match those found by others (Dillon et al., 1997, 1999; Lopez-Poveda et al., 2017) and suggest that there is no clear distinction between the two measures. Thus, it seems plausible that subjects evaluate improvement (i.e., degree of change) similarly to final ability and it could be argued that merely evaluating final ability could be sufficient to assess individual COSI targets.
Further analysis of the COSI results showed that COSI scores had a skewed distribution, with a tendency toward maximum scores. Dillon et al. (1999) reported very similar results concerning the observed ceiling on the COSI results and argues that there may be a tendency for individuals to overestimate their level of satisfaction. Possible explanations for the ceiling effect in the COSI scores might also be a biased judgment by the clinician or dispenser, who were actively involved in the scoring of COSI targets and the emphasis on COSI targets during the rehabilitation process. Efforts have been made to achieve maximum results on each of these targets, which implies considerable attention from the clinician or dispenser for the subject’s COSI targets. On average, 3.7 COSI targets per subject were formulated and about half of all formulated targets were marked first priority. Targets marked as first priority showed significantly higher scores compared with lower priority goals. This strengthens the idea that the focus on personally defined rehabilitation targets is supportive of the success of hearing aid fitting. This, however, is not necessarily the case for questionnaires with fixed questions such as AVAB of which not all items are equally relevant or even applicable to the subjects’ rehabilitation needs. Thus, greater attention to the COSI targets might also have contributed to the ceiling effect in final ability scores. It should be mentioned that not all COSI targets could be matched to one or more dimensions of auditory functioning. These noncompliant targets comprise roughly four different rehabilitation needs: perception of music, tinnitus, practical concerns (wearing comfort, etc.), and specific hearing conditions (e.g., traffic, telephone, and TV).
It seems tempting to directly compare overall COSI and AVAB results. However, a direct comparison between these measures is not expected to yield strong correlations because of the observed ceiling effects that cause a skewed and uneven distribution of overall COSI scores (Figure 1). Pre- and post-AVAB scores on the other hand, follow a more continuous distribution. AVAB has a limited resolution (4-point scale) and it could be argued that a relatively high pre-AVAB score may potentially drive post-AVAB toward maximum scores. Therefore, we also evaluated the benefits relative to the “room for improvement” (i.e., percentage differences), which could be considered as a derived measure of benefit. Here, we found that pre-AVAB results only had a modest effect on post-AVAB scores. These results seem to be consistent with Lopez-Poveda’s et al. (2017) findings for self-reported benefit which showed only a weak relation between baseline scores and benefit scores. In spite of the limitations for direct comparison mentioned, the “room for improvement” show a moderate but significant correlation with individual COSI DC scores (ρ = 0.43). This finding may indicate that AVAB percentage differences contain valuable additional information with regard to the evaluation of hearing aid fitting.
The Effects of Hearing Aid Experience and Hearing Loss
Even though post-AVAB scores also show a skewed distribution (Figure 1), AVAB scores vary more between subjects than COSI scores (Figures 2 and 3). AVAB scores show significant differences between groups of user types (first-time or experienced users) and degree of hearing loss. Intergroup differences were less clear in the COSI results, although still significant between first-time and experienced users. Our results show that first-time users differ significantly from experienced users, not only in COSI and AVAB responses but also in the severity of hearing loss. Not surprisingly, severe hearing loss was observed more often in experienced users, when compared with first-time users: There was a 15dB increase of median hearing loss. Besides, differences between experienced and first-time users could possibly be explained by the effect of expectation. As previously described by Dawes et al. (Dawes, Hopkins, & Munro, 2013; Dawes, Powell, & Munro, 2011), elevated expectations that a hearing aid can reduce hearing problems influence overall preference measured with self-report methods. The duration of this placebo effect is not known, but it has been shown that the effect is temporal (Dawes et al., 2013). Our hypothesis is that experienced users are less affected by this placebo effect as they are more familiar with the limitations of hearing aids, which could have resulted in lower scores. It seems likely that the effect of expectations could explain the variation between first-time and experienced users, at least partially.
A closer look at Figure 3 reveals an apparent monotonic decrease in AVAB scores as PTAB levels increase. Yet, COSI final ability scores does not show a strong dependency on PTAB over a wide range of PTAB levels. Spearman’s rank correlation’s confirm these observations as there was no significant correlation found for overall COSI final ability and PTAB, while significant but weak correlations did exist between PTAB and pre- and post-AVAB scores. In our opinion, this indicates that—in contrast to COSI—the AVAB method is better able to differentiate for the effect of the degree of hearing loss. Correlations observed in this study are lower than those observed by others; Kramer et al. (1996) reported Pearson’s correlations per dimension between r = −0.32 and r = −0.51 and Fuente et al. (2012) reported a Spearman’s rank correlation for average AVAB scores and PTAB of ρ = −0.59. However, only the result found by Fuente et al. (2012) can be compared directly to the result found in this study (pre-AVAB: ρ = −0.24; post-AVAB: ρ = −0.25). The differences could possibly be explained by the fact that the amount of variation of hearing loss is smaller in our study (Table 1) relative to that described by Fuente (SD = 16.95 dB HL) and Kramer (SD = 17.6 dB HL). In addition, Fuente used a Spanish implementation of the AVAB method, whereas our study used a Dutch version. Lopez-Poveda et al. (2017) reported a weak and nonsignificant correlation between COSI scores and pure-tone threshold (r = −0.04). This is comparable to the weak and nonsignificant correlation we found (Table 4). In fact, based on an extensive literature survey on several other PROMs, Knudsen, Öberg, Nielsen, Naylor, and Kramer (2010) concluded that hearing sensitivity (i.e., hearing threshold levels) seems to be a poor predictor for hearing aid use or satisfaction.
Using the AVAB questionnaire, first-time hearing aid users were asked to judge their auditory functioning in a situation without hearing aids. Experienced users, however, had to judge their auditory functioning while using their hearing aids. Interestingly, despite the (partial) compensation of the hearing loss by the hearing aid, pre-AVAB scores for experienced users were lower than for first-time users without any compensation of hearing loss. Experienced users also reported lower post-AVAB scores as compared with first-time users. Thus, benefit from the hearing aid on auditory functioning drops during the transition from being a first-time user to becoming an experienced user. Further work needs to be done to establish why auditory functioning is judged to be poorer by experienced users who are compensated for their hearing loss compared with first-time users who are known to be hearing impaired, but lack appropriate compensation of their hearing loss.
Dimensions of Auditory Functioning
AVAB scores differ more between the six dimensions of auditory functioning than COSI scores (Figure 4). One reason for this might be that within the AVAB questionnaire, all subjects had answered questions about all six dimensions, whereas COSI included only a limited range of situations. As a consequence, not all AVAB items or even dimensions have the same relevance to a subject and therefore might have been evaluated differently than their self-formulated COSI targets. Assignment of these targets to the six dimensions is subjective and might differ between dispensers or clinicians, although previous results show high interobserver agreement (Dreschler & De Ronde-Brons, 2016). Also, multiple dimensions of auditory functioning could be assigned to one target, resulting in the same score for different dimensions for one COSI target. On average, 1.8 dimensions were attributed to each COSI target. This reduces the ability to discriminate between dimensions in final COSI scores. Consequently, not all subjects had COSI targets matched to all six dimensions. To overcome this, a representative sample was used including solely subjects with a mean COSI score for each dimension enabling the possibility for comparison between COSI and AVAB. Pairwise comparison analysis revealed that except for the auditory functioning dimension speech in quiet, no significant differences exist between mean COSI scores among the remaining dimensions. Yet, strong significant differences were found between dimensions of auditory functioning for both pre-AVAB scores and post-AVAB scores, regardless of excluding any additional dimensions. These results add to the argument that AVAB is much more sensitive when it comes to revealing subtle differences between auditory disabilities during the rehabilitation process.
The largest contribution of matched COSI targets was to the auditory functioning dimension speech in noise, which may therefore be considered the dimension containing the most pressing hearing difficulties. Also, speech in noise showed the smallest pre-AVAB scores of all dimensions. These results are consistent with those of Kochkin (2002), who showed that improvement for speech intelligibility in noise is the most desirable improvement among the hearing impaired. Surprisingly, differences between pre- and post-AVAB were greatest for speech in noise, which strengthens our hypothesis that solving self-formulated targets was an important motive during rehabilitation. Moreover, our results indicate that the dimensions speech in noise and speech in quiet are most essential to the rehabilitation process.
Combining COSI and AVAB
We investigated the relationship between COSI and AVAB in the prefitting stage. Subjects with COSI targets that were matched to the AVAB dimensions detection, speech in quiet, and localization yielded significantly (p < .001) poorer scores on these dimensions than the subjects without corresponding matches. This relationship was not found for speech in noise, probably due to the fact that almost all subjects (95.9%) matched one or more COSI targets to the dimension speech in noise. Therefore, matched and nonmatched differences between AVAB scores could not be analyzed accurately for this dimension. Nevertheless, these findings indicate that the disability is poor for dimensions that were matched with COSI targets, suggesting a certain level of agreement between prescore for AVAB and COSI. The COSI method emphasizes the need for rehabilitation in these dimensions and could direct the clinician or dispenser during the hearing fitting.
Due to the low variability in scores, COSI in its current form appears to have limited added value for evaluating effects of hearing aid fitting between different groups of users. AVAB, on the other hand, seems to provide more useful outcome measures for such analyses. However, for counseling purposes, COSI forms a valuable addition to the AVAB questionnaire in that it provides specific targets for each individual hearing aid fitting. Some of these targets appeared to be noncompliant to any of the six dimension of auditory functioning and could potentially have been overlooked during hearing aid fitting. Our results indicate that on an individual basis, some dimensions of auditory functioning (e.g., speech in noise) may be considered more important for rehabilitation than others. By assigning the COSI targets to the six AVAB dimensions, the interpretation and weighting of the AVAB results for an individual can be supported, as well as the translation of the individual rehabilitation needs into hearing aid functions and settings. On the other hand, the AVAB has added value in combination with the COSI in that it always provides results for all six dimensions of auditory functioning and therefore provides a broader view on the fitting results. In addition, by first completing the AVAB questionnaire prefitting, subjects are encouraged to think about their hearing ability in a broad range of situations before they formulate their individual needs for rehabilitation by COSI.
Conclusion
Both COSI and AVAB are useful in the evaluation of hearing aid rehabilitation, with each method having specific strengths and weaknesses. AVAB contributes to the formulation of individual needs of rehabilitation used by COSI and provides detailed information for six different dimensions of auditory functioning for the pre- and postfitting evaluation. COSI is a strong tool for the assessment of individual rehabilitation needs but is less sensitive for comparison between groups due to the diversity of targets and scores at or near the top of the response scale. AVAB on the other hand seems to be a useful tool for such comparisons and provides a broader insight in to the auditory functioning of individuals. These differences between COSI and AVAB suggest both methods should be used in a complementary manner, rather than separately.
Footnotes
Acknowledgments
Data collection was organized by the dispensers, coordinated by the PACT Foundation, and by a cooperation of 10 Audiological Centers (AC’s) in the Netherlands: AC AMC in Amsterdam, Kentalis AC’s in Amsterdam and The Hague, Libra AC’s in Breda, Eindhoven, and Tilburg, AC Holland Noord in Alkmaar, Pento AC in Amersfoort, AC UMCG in Groningen, and AC VUmc in Hilversum. The authors would like to acknowledge their contribution in collecting and sharing clinical data as used in this study. The authors also like to thank Bert van Zanten (Academic Medical Center, Utrecht) and André Goedegebure (Erasmus Medical Center in Rotterdam) for their personal efforts in data collection and data analysis on behalf of the PACT foundation.
Declaration of Conflicting Interests
The authors declared no potential conflicts of interest with respect to the research, authorship, and/or publication of this article.
Funding
The authors disclosed receipt of the following financial support for the research, authorship, and/or publication of this article: This research was funded by the Heinsius-Houbolt Foundation.