
Abstract
Objectives:
The Center for Epidemiologic Studies Depression (CESD) scale has been useful in a broad spectrum of health research on patient and population outcomes. A brief version is used when depressive symptoms are not the primary focus. Rasch (item response) analysis previously demonstrated potential problems with positively worded items. We tested the 10-item CESD (CESD-10) scale and considered an 8-item version with both psychometric and Rasch analyses.
Methods:
This was a special sample of 2067 caregivers from three existing US databases. We describe item response patterns and internal constancy in addition to Rasch scale results.
Results:
There were few problems with missing data, and internal consistency was high (alpha = 0.86–0.88) for both CESD versions. Rasch analysis indicated that one of the positive items (“hopeful about future”) could be dropped.
Conclusions:
We partly confirmed prior work that suggested dropping positive items for the CESD-10. Among caregivers, item-level problems and scaling problems seem minimal. At present, there is not a strong rationale for dropping the CESD-10 positive items: the one poorly performing positive item might be explained by the special caregiver sample.
Introduction
The Center for Epidemiologic Studies Depression (CESD) scale is arguably one of the most common measures of depressive symptoms used in research,1–4 including research with caregiver populations, that we highlight in this article.5–10 The 20-item scale is relatively brief, with four response options for frequency of symptoms. However, briefer forms have been proposed, especially for applications where depressive symptoms are not the primary exposure or outcome of research. 11 Psychometric aspects of the CESD scale, in both long and abbreviated versions, have been generally positive.1,2,12,13 However, Rasch Item Response Theory (IRT)-based analysis provided insight into the scaling aspects of the full 20-item CESD and raised the potential concern that some items, particularly those worded as positive symptoms, might be dropped. 14 In this article, we test the 10-item CESD (CESD-10) scale 11 with both Classic Test Theory psychometrics (e.g. skewness and internal consistency) and Rasch analysis. Based on previous concerns about the positively worded items, we considered the potential for a briefer 8- or 9-item version excluding one or both of the positive affect items (“hopeful about future”; “happy”).
Methods
Sample and setting
This article is based on a methods’ sub-study of a larger US research project into the issues and needs of caregivers. The data for this study come from two sources. We had CESD responses from 1121 family caregivers enrolled in a caregiver registry and 946 caregivers who sought services from Area Agencies on Aging (AAAs) in Washington state and who participated in a standardized caregiver assessment and referral protocol. Approximately 46% of the caregivers in the study from these sources were caring for their spouses or partner. An additional 41% were caring for their parent or parent-in-law, and 13% were caring for a sibling, a grandparent, aunt, uncle, or non-relative. Participants reported the diagnosis of the care recipient, and 52% had been formally diagnosed with Alzheimer’s disease. In another 14% of the cases, Alzheimer’s disease or another dementia was strongly suspected, but had not been medically diagnosed, and in 32% of the cases, memory or cognitive problems were serious issues. Only 25% of the sample did not report any memory problems.
The League of Experienced Family Caregivers (LEFC) is a registry of family caregivers who volunteer to share their caregiving experiences by completing one or more interviews or questionnaires. The LEFC, which is housed in the Office of Applied Gerontology at University of Wisconsin-Milwaukee’s Helen Bader School of Social Welfare, was created as part of a larger research effort aimed at developing and testing measures of caregiving experiences. A two-step recruitment process was used to recruit registry members. Initially, contact was made with key staff from provider organizations in six states including AAAs, home health agencies, and chapters of the Alzheimer’s Association. These staff members were asked to share information and distribute brochures to family caregivers with whom they worked. Information and brochures also were distributed at caregiver conferences and support groups throughout the country. Caregivers interested in participating provided contact information to the study team by returning a postcard that was attached to the brochure. Staff from the study team then contacted caregivers to provide detailed information about the registry and gained informed consent. Caregivers chose to complete one or more questionnaires online, via mail, or by telephone. Data for this analysis were collected from 1121 caregivers who enrolled in the LEFC between July 2005 and March 2010. Complete data were available for 773 caregivers who completed an initial survey that included the CESD-10 (LEFC sample A) and from 348 caregivers who completed a second survey that included the CESD-10 (LEFC sample B).
The third sample was recruited from a state service program. In 2009, the state of Washington began implementing a new policy to serve family caregivers. As part of that policy, all caregivers seeking help from an AAA were asked to complete a short screen and those individuals scoring high on measures of stress or depression were triaged to receive care management services by professionals trained to implement the Tailored Caregiver Assessment and Referral (TCARE®) protocol. 15 The TCARE assessment form includes the CESD-10 (described in section “Measure”). The data for this analysis were taken from the records of the 946 caregivers across the state of Washington for whom assessment data were completed between 1 April 2009 and March 2010.
Participating institutions approved this secondary analysis project as exempt.
Measure
We used a short, 10-item version of the CESD scale11,16 (see Appendix 1). This measure has been used extensively in general patient and older adult populations,11,16–24 and with caregivers.5–10,25 All questions include four response categories (0–3). There are eight items that measure symptoms of depression frequency and two that measure positive affect and that are reverse coded to fit the measurement scale model. The CESD-10 produces a continuous score that dichotomizes at eight points (equivalent to the full CESD of 16 points) for classifying subjects with clinically relevant symptoms of depression. 11
Analyses
Primary descriptive and psychometric analyses were conducted using SPSS Version 10.1. 26 We compared the characteristics of the three samples of caregivers who had all items using chi-square analyses for categorical variables (e.g. gender) and t-tests for continuous measures. We report item response percentages and scale descriptive statistics (means, standard deviations (SDs)). Items were considered skewed if 50% or more of caregivers were in one of the extreme categories (low or high frequency), and the CESD-10 was considered to have ceiling or floor effects if 20% or more of caregivers had the best (0 points) or worst possible depression symptom scores (e.g. 30 points for the CESD-10). 27 We calculated internal consistency alpha of the CESD-10 and the two possible shorter scales, using the criterion that a level of 0.80 was adequate. 27 In order to consider consistency of findings among caregiver samples, each of these tests was independently analyzed for each of the three component caregiver samples.
The Rasch analysis, partial credit model, was performed using the WINSTEPS program. 28 WINSTEPS produces detailed statistics for each item, as well as for the overall instrument. The default rating scale model, with groups equal to one, was used as this model assumes all items share the same underlying rating scale structure. Unidimensionality refers to whether the instrument measures a single construct. 29 To determine an instrument’s unidimensionality, we used two statistics to identify how well each item fits the construct: mean square standardized residuals (MnSq) and standardized Z scores (ZSTD).30,31 An item was considered to “misfit” if it exceeded both MnSq and ZSTD criteria (MnSq ≥ 1.3 and ZSTD ≥ 2.0).
In addition to fit statistics, Rasch analysis examines the measurement’s item hierarchy. An item hierarchy is a sequential ordering of items from least to most difficult. A subject’s ability is measured by logits, a unit of measurement used in Rasch analysis and derived from transforming ordinal data into an interval logit scale. 29 In establishing a subject’s ability, the item hierarchy also allows for a determination of whether the instrument is appropriate for the sample. By plotting sample ability against the items, a researcher can decide how well the items are suited for that particular sample. If person and item means are noticeably divergent, the measure may be too easy (ceiling effect) or too hard (floor effect) for the sample. As a result, the assessment may be unable to discriminate people at these extremes. Furthermore, the item hierarchy helps the researcher identify parts of the instrument that do not contribute to the measure. First, item gaps refer to areas within the assessment that are insensitive to a person’s ability level. Second, item redundancies refer to areas within the assessment that repeatedly assess the same ability level. By examining the item hierarchy, researchers can remove items that do not provide any additional information. Finally, Rasch analysis removes items from the hierarchy if they are inestimable. Items that are inestimable are ones that the entire sample either answered all correct or all incorrect. Therefore, an inestimable item does not contribute to the instrument because it has no discriminatory power. If item gaps, redundancies, and inestimable items are identified, a researcher can modify an instrument to be more efficient (e.g. remove inestimable and redundant items) and precise (e.g. add items in gaps).
Rasch analysis also provides two unique mechanisms for evaluating the reliability of an instrument. First, person separation statistics indicate how well the subjects can be distinguished from one another. The person separation index is the adjusted person SD divided by the average measurement error. 29 The greater the person separation statistic, the more distinct strata are revealed from the sample. 32 In addition to the person separation statistic, Rasch analysis produces another reliability statistic called person reliability. This is analogous to the traditional statistic, Cronbach’s alpha. A person reliability coefficient of 0.70 represents an acceptable level reliability, a coefficient of 0.80 represents a good level of reliability, and a coefficient of 0.90 represents an excellent level of reliability. 33
Results
Of the 2134 caregivers asked to complete the CESD-10, 2067 (97%) completed all 10 questions and comprise the sample analyzed for this article. There were no obvious patterns of problem questions among the CESD items (data not shown). There were some demographic differences among the three caregiver samples. Caregivers of the LEFC sample A and LEFC sample B were similar in age (57.6 and 56.7 years) and proportion of women (82.7% and 81.2%), but both groups were statistically significantly younger and had a higher proportion of women than the Washington state AAA respondents. The LEFC sample A also had a significantly higher proportion of White respondents (91.8%). Table 1 provides details on the three caregiver samples.
Caregiver characteristics of three samples of US caregivers.
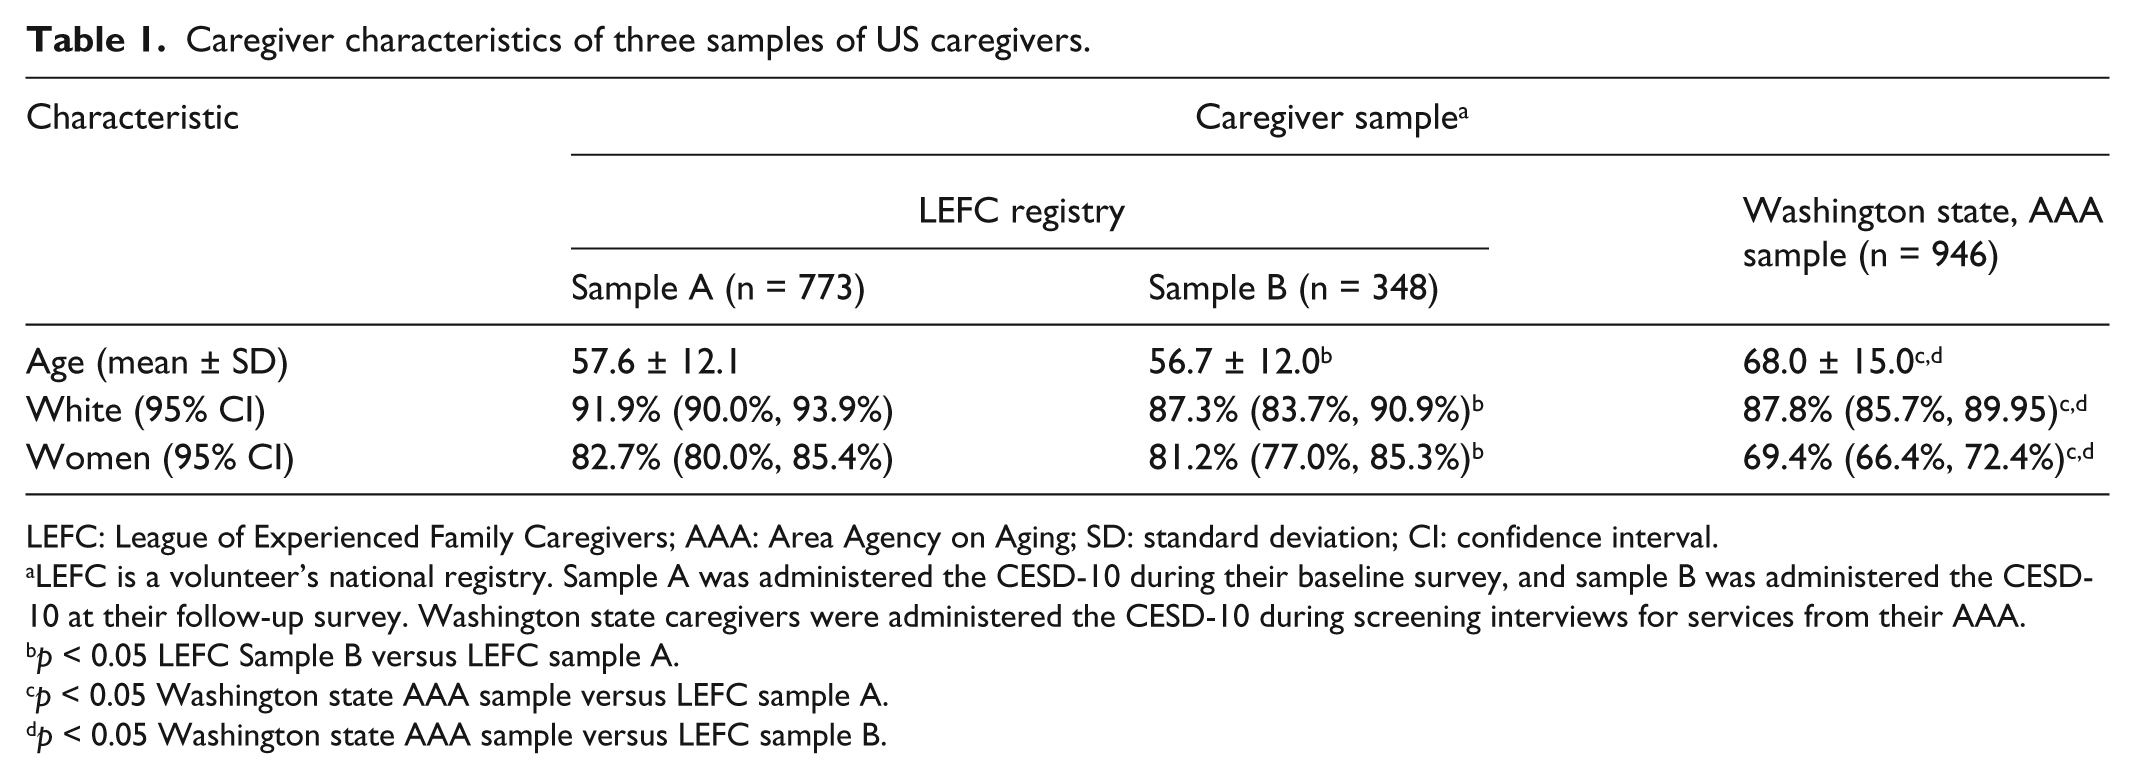
LEFC: League of Experienced Family Caregivers; AAA: Area Agency on Aging; SD: standard deviation; CI: confidence interval.
LEFC is a volunteer’s national registry. Sample A was administered the CESD-10 during their baseline survey, and sample B was administered the CESD-10 at their follow-up survey. Washington state caregivers were administered the CESD-10 during screening interviews for services from their AAA.
p < 0.05 LEFC Sample B versus LEFC sample A.
p < 0.05 Washington state AAA sample versus LEFC sample A.
p < 0.05 Washington state AAA sample versus LEFC sample B.
There was no substantial ceiling or floor effect for either the CESD-10 or the shorter scales among any of the three caregiver groups, with 6% or fewer caregivers having lowest (no depressive symptoms) and less than 1% having maximum scale scores. The item that measured being “fearful” was the most skewed distribution (62% reporting the lowest frequency among the LEFC sample A group). Overall, there were no problems with other items being skewed. Internal consistency was very similar among the three groups and between the CESD-10 and both shorter scale versions (range 0.86–0.88), which was well above the 0.80 level considered adequate. The mean CESD scores were very similar between the LEFC sample B (e.g. CESD-10 = 13.1) and Washington state AAA sample (e.g. CESD-10 = 13.1), but scores were significantly lower (p < 0.0001) among the LEFC sample B caregivers (e.g. CESD-10 = 10.7). A large percentage of caregivers were rated as having clinically relevant levels of depressive symptoms on the CESD-10 (45.7% for the LEFC sample A group, and about 75% for both of the other caregiver groups). For descriptive purposes, we used the same cutoff of eight points for the CESD-8 version we derived, and the percentage of those with clinically relevant levels of depressive symptoms was still exceptionally high. Table 2 provides more detail on these results.
Frequencies and internal consistency (Cronbach’s alpha) of abbreviated Center for Epidemiologic Studies Depression scales among three groups of US caregivers.

AAA: Area Agency on Aging; CESD: Center for Epidemiologic Studies Depression; SD: standard deviation.
“Floor” effects represent the worst (highest level of depressive symptoms) possible.
“Ceiling” effects represent the best score of zero (lowest level of depressive symptoms).
Item 5 is dropped for the CESD-9, and both positive items 5 and 8 are dropped for the CESD-8.
Rasch analysis determined that only one of the two positively worded items misfit the measurement model (#5, “I felt hopeful about the future”). Figure 1 illustrates the relationship between the subjects and the items for the CESD-10. The left side of the figure represents each subject’s level of depression (designated with the symbols # representing 10 subjects and a “.” representing less than 10 subjects). The frequencies at the bottom represent subjects with a lower endorsement of depressive symptoms and the frequencies at the top of the figure represent the subjects with higher endorsement of the depressive symptoms. The right side of the figure depicts the items arranged by the degree to which they represent depression. Items at the bottom of the figure represent less depression, while items at the top of the figure represent a greater degree of depression. Figure 1 demonstrates that the mean of the persons is half a logit below the mean of the items, indicating that this sample had a lower level of depression than the average for which the items were ideally intended. Or, this sample was less depressed than the average level of depression measured by the instrument in this sample. Additionally, there is a floor effect, where some of the sample appears not to be endorsing any level of depression. We also examined the CESD by dropping item 5 (data not shown). Similar to the CESD-10, the mean for the CESD-9 was half a logit below the mean of the items, and there was also a floor effect even with the restricted number of items.
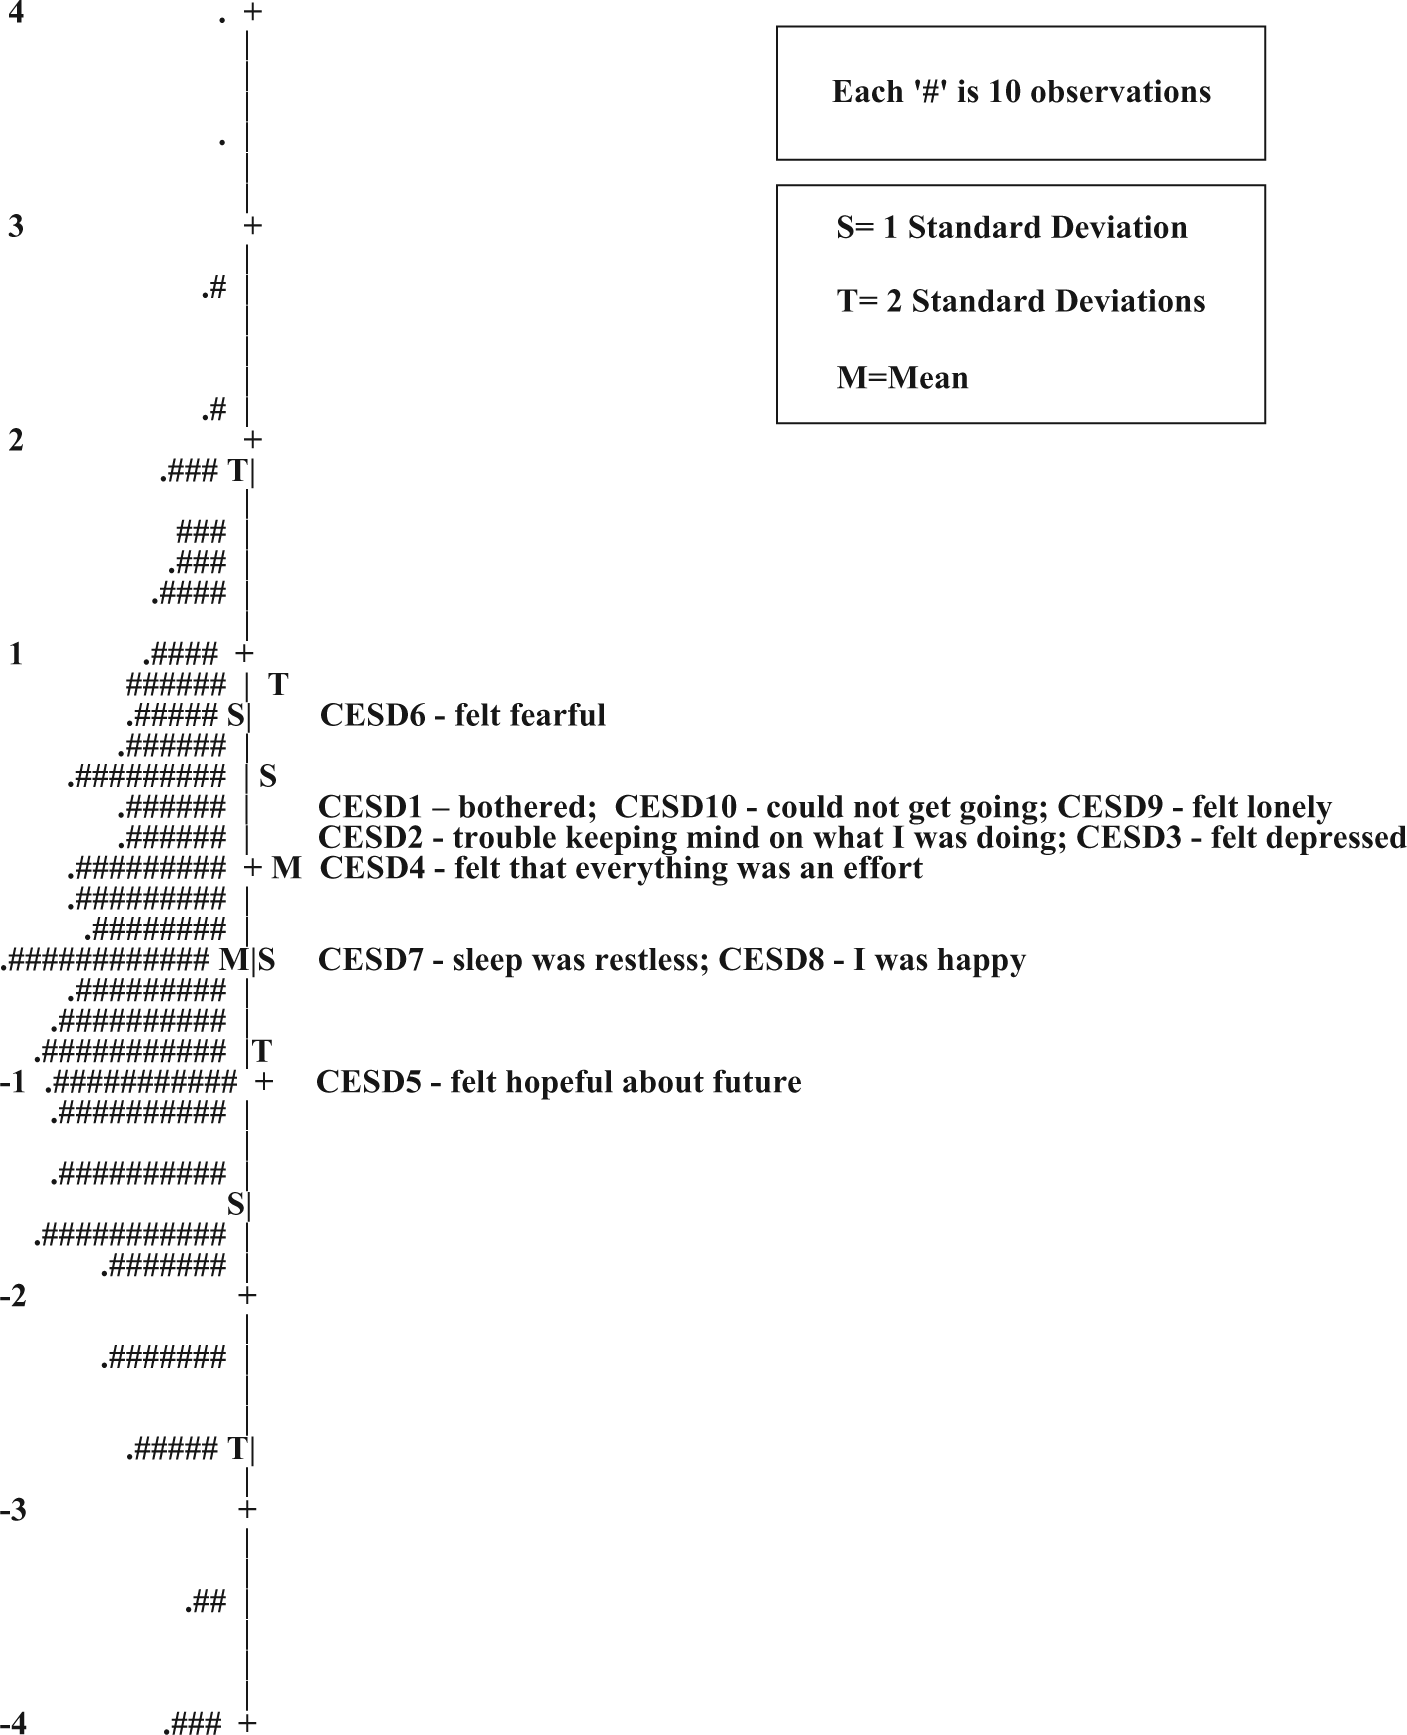
CESD-10. Person map of items based on 2067 caregivers.
This sample of the CESD-10 produced a person separation statistic of 2.05, and for the CESD-9 it was 2.03. The person separation statistic was placed into the strata formula to determine the number of distinct ability strata. The resulting strata equaled three, suggesting that the sample can be separated into three distinct “ability” groups. In addition, the sample produced a person reliability coefficient of 0.81 for the CESD-10 and 0.80 for the CESD-9. This level of person reliability indicates that the items are working well together to consistently reproduce a subject’s score for both versions.
Discussion
We hypothesized that the positively worded times would perform poorly and we partly confirmed this hypothesis. Prior work suggested dropping positive items for the CESD-10, and we found that only one of the items (“hopeful about future”) was unacceptable when tested with Rasch analysis. The item had a somewhat higher percent of frequent responses (e.g. 20.2% reported 5–7 days among the LEFC sample A caregiver group) than did other CESD-10 items; however, the item on restless sleep was even more common among two of the caregiver groups (over 27%). We speculate that the item about being hopeful and the sleep item may be linked to the respondents’ caregiving role as much indicating depressive symptoms. Based on pragmatic face validity, it is not surprising that caregivers of frail and/or seriously impaired older adults would consider the future in hopeful terms while discussing their caregiving role, nor spurring that their caregiving was accompanied by some sleep interruptions.
Another consideration is that including two items that measure positive affect as part of the CESD-10 has its own desirable characteristics in the caregiver and other applications. The CESD-10 remains a poly factorial measure. In particular, if symptom severity is important for tracking patients or study participants over time, having items that measure positive affect can contribute to the ability to measure change (especially improvement).
In contrast to the IRT analysis about items that might not “fit,” the internal consistency of all three scale versions was very similar. Strong factor loading and internal consistency, despite low item performance, were also reported by Stansbury et al. 14 Our results generally agree between the IRT and psychometric analyses, but the IRT results were more “critical” about the lack of fit of one positive item, “hopeful.”
Interestingly, one other study examined problem items on the CESD 20. 34 That article compared patients with stroke and a general patient group; the “problem” items were not the positive ones and were items not selected for the CESD-10 version we tested. With relatively few samples in which item problems have been tested with Rasch models, it will be important to confirm if there are items that are consistently poor “performers” in other samples. Our research group speculated, but could not directly investigate, a possible problem involving inadvertent confusion and errors in “response set” options among the positive items. For example, respondents answering questions at one end of the response options on weekly frequencies or symptoms might miss that the options would be reversed when the question was about positive rather than negative symptoms. Finally, a test of convergent validity with established measures of depressive symptoms and against gold standard clinical diagnosis of depression will be required to determine the best cutoff score for an abbreviated CESD scale, whether it has 8, 9, or 10 items.
Our sample was somewhat unusual (caregivers) and the level of depressive symptoms is much greater than reported in other general populations. 11 In a recent study of somewhat younger caregivers of adults with spinal cord injury (caregiver mean age 53 years), Rodakowski et al. 25 reported a mean CESD-10 score of 8.7. However, a study of caregivers of veterans with stroke 8 reported a mean CESD-10 score of 10.4, very similar to this study for at least one sample (the LEFC sample A caregivers). The possibility that CESD items represent the experience of caregiving (e.g. less hopeful about the future) leads us to recommend that item-level analyses of the CESD in other groups reexamine the possibility of item biases. The CESD-10 has been used extensively in published studies; at the present time, there does not seem to be a strong argument for dropping positive items and further reducing the scale for research purposes with caregivers or other populations.
Footnotes
Appendix 1
Declaration of conflicting interests
None of the authors has any conflict of interest with the current publication. R.M. is a lead for the program from which the data were derived (TCARE); however, this article is a secondary data analysis of the measurement of the depression instrument used in that study, not a description nor advocate for the intervention. E.M.A. is the first author of the article introducing this CESD-10 version published in 1994, but derives no financial benefit from the instrument which is in the public domain. The research for this article was conducted independently of any funding except as the authors were paid as staff and faculty of their respective universities.
Ethics Committee
This secondary data analysis of a deidentified data set was reviewed and classified as exempt from the University of Florida where the original data analysis took place by Dr Byers and Mr Friary under 45 CFR 46.101(b(4) (IRB Exemption #2010-U-193).
Funding
E.M.A. was funded for this work, in part, by the Oregon Health & Science University Center for Excellence in Developmental Disabilities, Administration on Developmental Disabilities (now the Administration for Community Living) (90DD0684 01).