
Abstract
Hearing difficulties are frequently reported by patients in audiology clinics, including patients with normal audiometric thresholds. However, because all individuals experience some difficulty understanding speech in noisy environments, it can be difficult to assess hearing complaints objectively across patients. Normative values help address this issue by providing an objective cutoff score for determining what is or is not clinically significant. The goal of this study was to establish normative values for the four-item hearing subscale of the Tinnitus and Hearing Survey (THS-H). Respondents completing the THS-H rate the level of difficulty understanding speech in the situations most commonly reported as being difficult: in the presence of noise, on TV or in movies, soft voices and group conversations. In this study, 22,583 US Service Members (SMs) completed the THS-H using an 11-point scale ranging from 0 (not a problem) to 10 (a very big problem). Responses to the four items were summed to produce values between 0 and 40. The distribution of the final scores was analyzed based on severity of hearing loss, age, and sex. Only 5% of SMs with clinically normal hearing scored above 27, so this score was selected as a cutoff for “clinically significant hearing problems.” Due to its ease of administration and interpretation, the THS-H could be a useful tool for identifying patients with subjective hearing difficulty warranting audiological evaluation and management.
Introduction
An essential component of the comprehensive audiological evaluation is assessment and documentation of self-perceived hearing difficulty reported by the patient. In most cases, hearing difficulty is assessed qualitatively as part of the patient's case history and summarized in the clinical report. However, obtaining a quantitative measure of hearing difficulty with a standardized questionnaire has several advantages. First, quantitative measures can facilitate longitudinal evaluation of self-perceived hearing difficulty, which can be useful for determining changes as a function of time and/or intervention, such as amplification. Second, quantitative measures make it possible to use normative data to compare a given patient's subjective hearing difficulty to that of patients with normal hearing or an equivalent degree of hearing loss, and third, they are essential for executing large-scale retrospective studies based on medical records.
One obvious barrier to the routine use of subjective questionnaires is the time constraint of a typical audiological appointment. Questionnaires take time to administer, score, and document in the clinical report. Full versions of questionnaires can be lengthy, such as the Speech, Spatial and Qualities of Hearing Scale (SSQ; Gatehouse & Noble, 2004) with 49 questions, and the Hearing Handicap Inventory for Elderly or Adults (Ventry & Weinstein, 1982; Newman et al., 1990) with 25 questions. Shortened versions of questionnaires and electronic administration can address the time constraint barrier, but the fact that most electronic health records do not contain quantitative, searchable fields to record the results of hearing difficulty questionnaires makes it difficult to determine how often questionnaires are administered in audiology clinics. However, we believe the time required to administer and score longer questionnaires may inhibit consistent administration due to respondent and administrator burden (US Department of Health, 2006) as well as lack of reliability and quality in responses (Sharma, 2022).
One area of audiological practice that routinely uses questionnaires is the evaluation and management of tinnitus. For example, clinics that provide Progressive Tinnitus Management (Henry et al., 2010), a stepped approach to tinnitus management, use the Tinnitus and Hearing Survey (THS; Henry et al., 2015) to differentiate hearing-related problems from tinnitus-related problems, and to screen for reduced sound tolerance, so that patients can be appropriately triaged for management of hearing loss, tinnitus, and/or reduced sound tolerance. The THS is a 10-item survey that incorporates three subscales: (1) a hearing subscale consisting of four items related to difficulty understanding speech in quiet or noisy environments; (2) a tinnitus subscale consisting of four items addressing the self-perceived impact of tinnitus; and (3) a sound tolerance subscale consisting of two items regarding tolerance to loud sounds.
Scoring the THS and interpreting the results is straightforward and fast. Each item on the THS is scored on a five-point Likert scale, from 0 (No, not a problem) to 4 (Yes, a very big problem). The score for each subscale is obtained by summing the scores for the individual items. When the score for the hearing subscale is higher than the tinnitus subscale score, management of hearing loss with amplification is typically prioritized over management of tinnitus (Henry et al., 2010). Following appropriate management of hearing loss, patients may be referred to Level 3 Skills Education if tinnitus continues to be bothersome.
The THS was designed to compare difficulties within a patient and not across patients, and, for this reason, the original paper describing the THS (Henry et al., 2015) did not include normative data for the hearing or tinnitus subscales. There are, however, a number of reasons why the THS hearing subscale (referred to here as the THS-H) could be a useful tool for assessing hearing difficulty if appropriate normative data were available. The THS-H is short, readily available, and already in use in clinics providing Progressive Tinnitus Management. The THS has also achieved international acceptance, with culturally adapted and translated versions available in Polish (Raj-Koziak et al., 2018), Spanish (Manchaiah et al., 2020), and Brazilian-Portuguese (Scheffer & Mondelli, 2021).
The purpose of the current study was to use a modified version of the THS-H to characterize subjective hearing difficulties for a large cohort of US Service Members (SMs). Study participants were recruited from Department of Defense (DoD) hearing conservation clinics where they were being seen for required annual testing. Current regulations require all US Soldiers and Marines to undergo annual testing, regardless of occupational noise exposure levels. Thus, the cohort of participants can be viewed as representative of individuals across all the career fields in the US military (i.e., not limited to combat specialties). The results from the hearing survey were used to obtain normative data on the THS-H for SMs with four different levels of hearing thresholds. It is anticipated that normative data on the subjective hearing complaints of SMs will be of particular interest to hearing health providers in the Military Health System and the Veterans Administration, because they are representative of the patient demographics seen in those clinics. The data may also be helpful for the assessment of nonmilitary patients, because they provide detailed information on the response patterns of young healthy individuals with and without subjective hearing complaints.
Methods
Participants
A total of 22,583 SMs volunteered to participate in the study during their annual hearing tests. The majority of participants (70.5%) were male (n = 15,915) with an average age of 30.7 years (SD = 8.9 years). The ages were distributed as follows: 20.1% were younger than 23 years, 39.5% were between 23 and 31 years old (inclusive), and 39.8% were over 31 years. The results of pure-tone audiometry at octave and inter-octave frequencies were used to divide the participants into four groups: Normal Hearing (NH), Army Hearing Profile 1 (H1), Army Hearing Profile 2 (H2), and Army Hearing Profile 3 (H3) (refer to Table 1). The hearing profiles (H1, H2, and H3) are based on the US Army Hearing Profile System outlined in US Army Regulation 40-502. The system is nominally designed to categorize SMs who have a high level of hearing performance with no duty restrictions (H1); those who have some degree of hearing loss that may require activity limitations (H2); and those who have hearing loss that may require significant activity restrictions (H3). If an SM's pure-tone thresholds meet the criteria for H2 or H3, the final determination is made based on the results of speech-in-noise testing. Because the US Army definition of the H1 profile includes some individuals with mild hearing loss, we separated participants with hearing thresholds ≤20 dB HL at all frequencies from the rest of the H1 participants to create the NH group. Within our cohort of 22,583 SMs, 15,392 were categorized as NH, 5,593 as |H1, 1,090 as H2, and 508 as H3. Table 2 shows additional demographics of age, sex, across hearing profile. Figure 1 shows the average thresholds at each frequency in the right and left ears as a function of hearing profile.

Average audiogram for each hearing profile for SMs who completed the THS-H. SMs: Service Members; THS-H: Tinnitus and Hearing Survey.
Hearing Profiles.
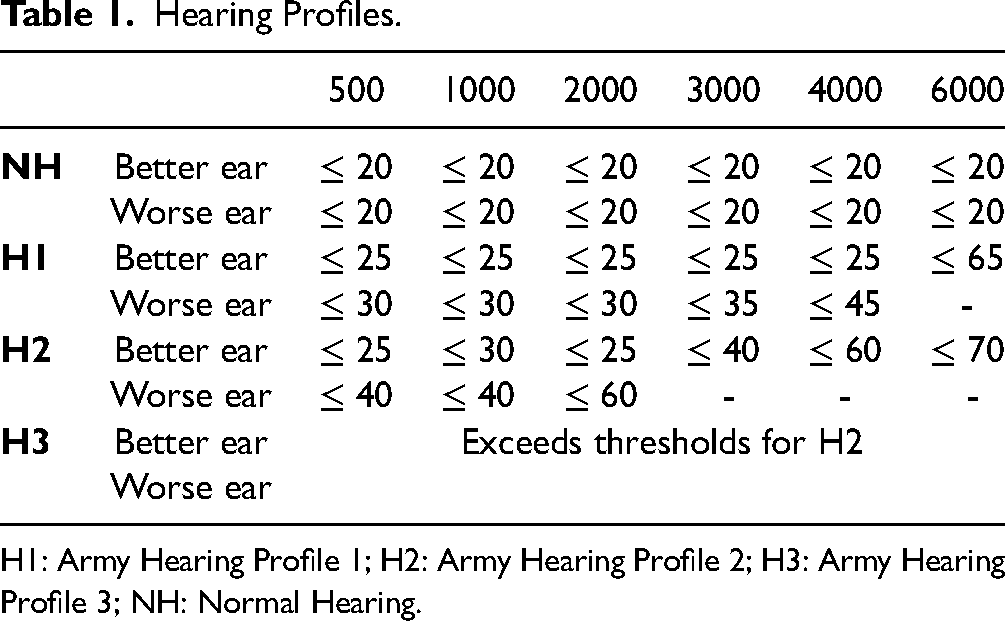
H1: Army Hearing Profile 1; H2: Army Hearing Profile 2; H3: Army Hearing Profile 3; NH: Normal Hearing.
Demographics of Participants.
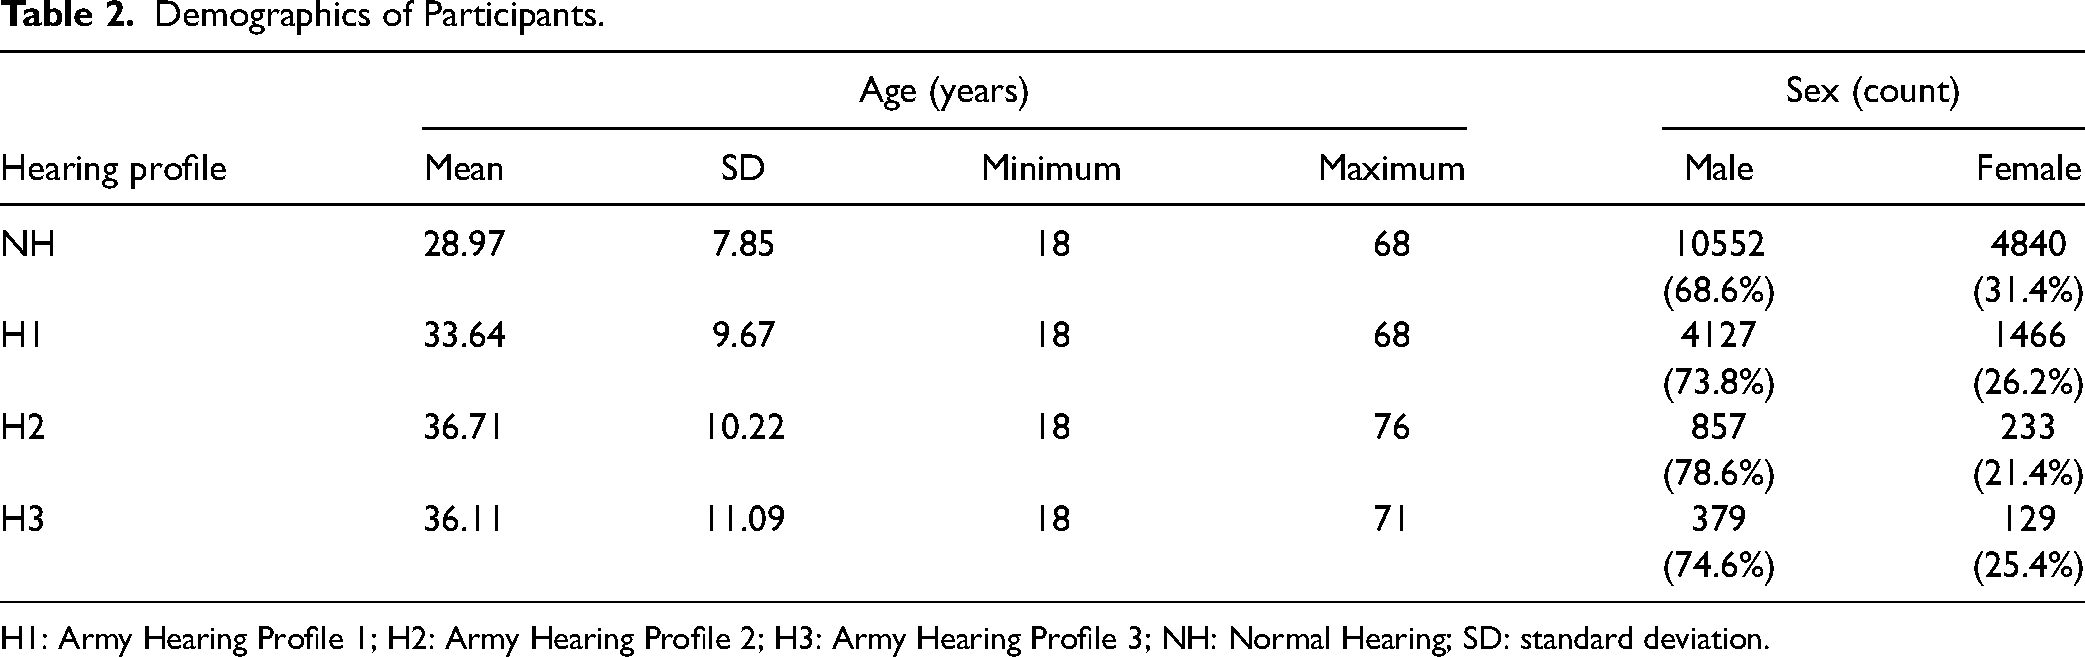
H1: Army Hearing Profile 1; H2: Army Hearing Profile 2; H3: Army Hearing Profile 3; NH: Normal Hearing; SD: standard deviation.
Procedures
Participants in the study were SMs being seen for annual hearing conservation tests, consisting of measurement of pure-tone audiometric thresholds and questions about noise exposure, tinnitus, and hearing protection device use. After completion of the annual hearing conservation test, participants were invited to participate in the study by consenting to share their demographic and hearing test data and completing a short tablet-based questionnaire using the TabSINT application (Shapiro et al., 2020). The questionnaire included items from the THS and additional questions about noise exposure and overall hearing health. Responses were recorded in the participants’ data record, along with the audiometric and demographic data. Audiometric data were collected in a single-wall booth using a CCA-200 Mini audiometer (Benson Medical Instruments, Eden Prairie, MN) connected to TDH-39 audiometric headphones (Telephonics, Farmingdale, NY). No personally identifiable information was collected or recorded in the data record and participants were not compensated. All study procedures were approved by the Walter Reed National Military Medical Center and US Army Medical Research Command Institutional Review Boards.
In this study, the four items of the THS-H were presented to participants as part of a larger tablet-based data collection effort across multiple hearing conservation clinics at military bases in the United States. The hearing subscale of the THS-H consisted of four statements:
Over the last week, I couldn’t understand what others were saying in noisy or crowded places. Over the last week, I couldn’t understand what people were saying on TV or in movies. Over the last week, I couldn’t understand people with soft voices. Over the last week, I couldn’t understand what was being said in group conversations.
Participants were asked to respond to each item with an 11-point Likert scale, with response value 0 labeled as “No, not a problem” and response value 10 labeled as “Yes, a very big problem,”
Comparison of the 11-Point THS-H to the Traditional Five-Point THS-H
The original version of the THS-H is scored on a five-point Likert scale that has a descriptor associated with each numerical rating, as follows: 0 = No, not a Problem; 1 = Yes, a small problem; 2 = Yes, a moderate problem; 3 = Yes, a big problem; and 4 = Yes, a very big problem. The responses to the four items of the THS-H subscale are summed to get an overall hearing subscale score ranging from 0 to 16. This original version of the THS-H will be referred to as the THS-H16 in this paper.
In this study, the THS-H was modified to obtain responses on an 11-point Likert scale, with 0 labeled as “No, not a problem” and 10 labeled as “Yes, a very big problem.” This change was made to make the response options comparable to other subjective difficulty questionnaires that were being administered to participants in the same session, including questions from the Speech, Spatial, and Qualities of Hearing Scale (SSQ; Gatehouse & Noble, 2004) and the Tinnitus Functional Index (Meikle et al., 2012). The four items on the THS-H were summed to get overall hearing subscale scores ranging from 0 to 40. This version of the THS-H is referred to as the THS-H40.
Clinicians and researchers who have existing data on the THS-H16, or those who would prefer to continue using the original scoring scale, may be interested in how the normative THS-H40 results reported in this study can be used to interpret data collected using the THS-H16. To address this question, 305 participants in this study were asked to complete the THS-H using both response scales, the five-point scale of the THS-H16 and the 11-point scale of the THS-H40. The THS-H16 was administered first. Participants then completed other questionnaires for approximately 3min after which the THS-H40 was administered.
A conversion equation was applied to estimate the relationship between the percentile scores on the THS-H16 and the percentile scores on the THS-H40. The scores corresponding to the first through 100th percentiles were calculated for both scales. The correlations between the THS-H16 and the THS-H40 scores were excellent (r = 0.99, p < 0.001), indicating strongly that participants used the scales in a very similar manner (see Figure 2). This further indicates that researchers can freely use either version so long as there is a method to convert from one set of scores to the other.

Scatterplot of THS-H16 scores corresponding to select percentile ranks against THS-H40 scores corresponding to those same percentile ranks. Only SMs who completed both versions of the THS-H are included. Scores for the THS-H16 are plotted along the x-axis and scores for the THS-H40 are plotted along the y-axis labeled with that point's percentile rank on both scales. For example, the point labeled “60” indicates that 60% of the scores were at or below4 on the THS-H16 and at or below10 on the THS-H40. A least-squares function was fit to the scores in order to convert from THS-H16 to THS-H40 with a large amount of variance explained (R2 = 0.98). The function used to convert between the THS-H16 and the THS-H40 is printed on the bottom of the figure and converts scores from one scale to the other based on that score's percentile rank. SMs: Service Members; THS-H: Tinnitus and Hearing Survey.
To find the functions that allow for a linear conversion between the THS-H16 and the THS-H40, a principal components analysis (PCA) was applied. A basic least-squares regression solution to converting between the THS-H16 and the THS-H40 is not appropriate for these data because the least-squares solution only assumes error to be present in the dependent variable. If a least-squares solution were applied, the slopes and intercepts of the line of best fit would vary slightly depending on whether the THS-H16 or the THS-H40 is the dependent variable. This is not a desirable trait for converting between the scales. PCA assumes there is error present in both the independent and dependent variable. PCA therefore ensures that the conversion from THS-H16 to THS-H40 and vice versa is symmetric.
The conversion is accomplished by converting the results of the PCA into slope-intercept form (y = b1x + b0 where b1 is the slope of the line and b0 is the y-intercept). The function for the line of best fit had a slope of 2.74 and a y-intercept of 0.65. Therefore, the equation to convert from the THS-H16 to the THS-H40 is:

Analysis
The primary goal of this study was to obtain normative data for the THS-H40 for participants as a function of hearing status. To achieve this goal, cumulative distributions of scores on the THS-H40 were examined. Because the sample was a subset of the population, there was uncertainty about the exact shape of the distribution of scores on the THS-H40. To simulate this uncertainty, a bootstrapping approach was applied to estimate the 95% confidence interval around the sample distribution. Finally, a cutoff score was chosen such that 5% of NH listeners would score above the cutoff, effectively setting the false alarm rate of the test at 5%.
In addition to the bootstrapped distribution analysis, a linear model was used to determine the impact of demographic differences on the THS-H40 scores. The independent variables were the three-way interaction between age, sex, and hearing profile; all component two-way interactions; and all main effects. The dependent variable was THS-H40 score. Age was centered before modeling and treated as a continuous variable in the model.
The linear model and the bootstrapped distribution approaches were used synergistically to determine whether any group differences observed in the linear model meaningfully affect the cutoffs for the groups.
Results
Normative Data for the THS-H
The four curves in Figure 3 show the cumulative distributions of THS-H scores for each hearing profile. The values on the x-axis represent the range of possible hearing complaint scores, with severity of the hearing complaints decreasing from the left side of the figure to the right side of the figure. At each point along the x-axis, values shown by the curves represent the proportion of participants who had hearing scores greater than or equal to that value. Each curve represents a different hearing profile. Note that these data are based on THS-H40 scores, shown at the bottom of the figure. For reference, the equivalent THS-H16 scores for each data point, as calculated with equation 2 in the previous section, are shown at the top of the figure.
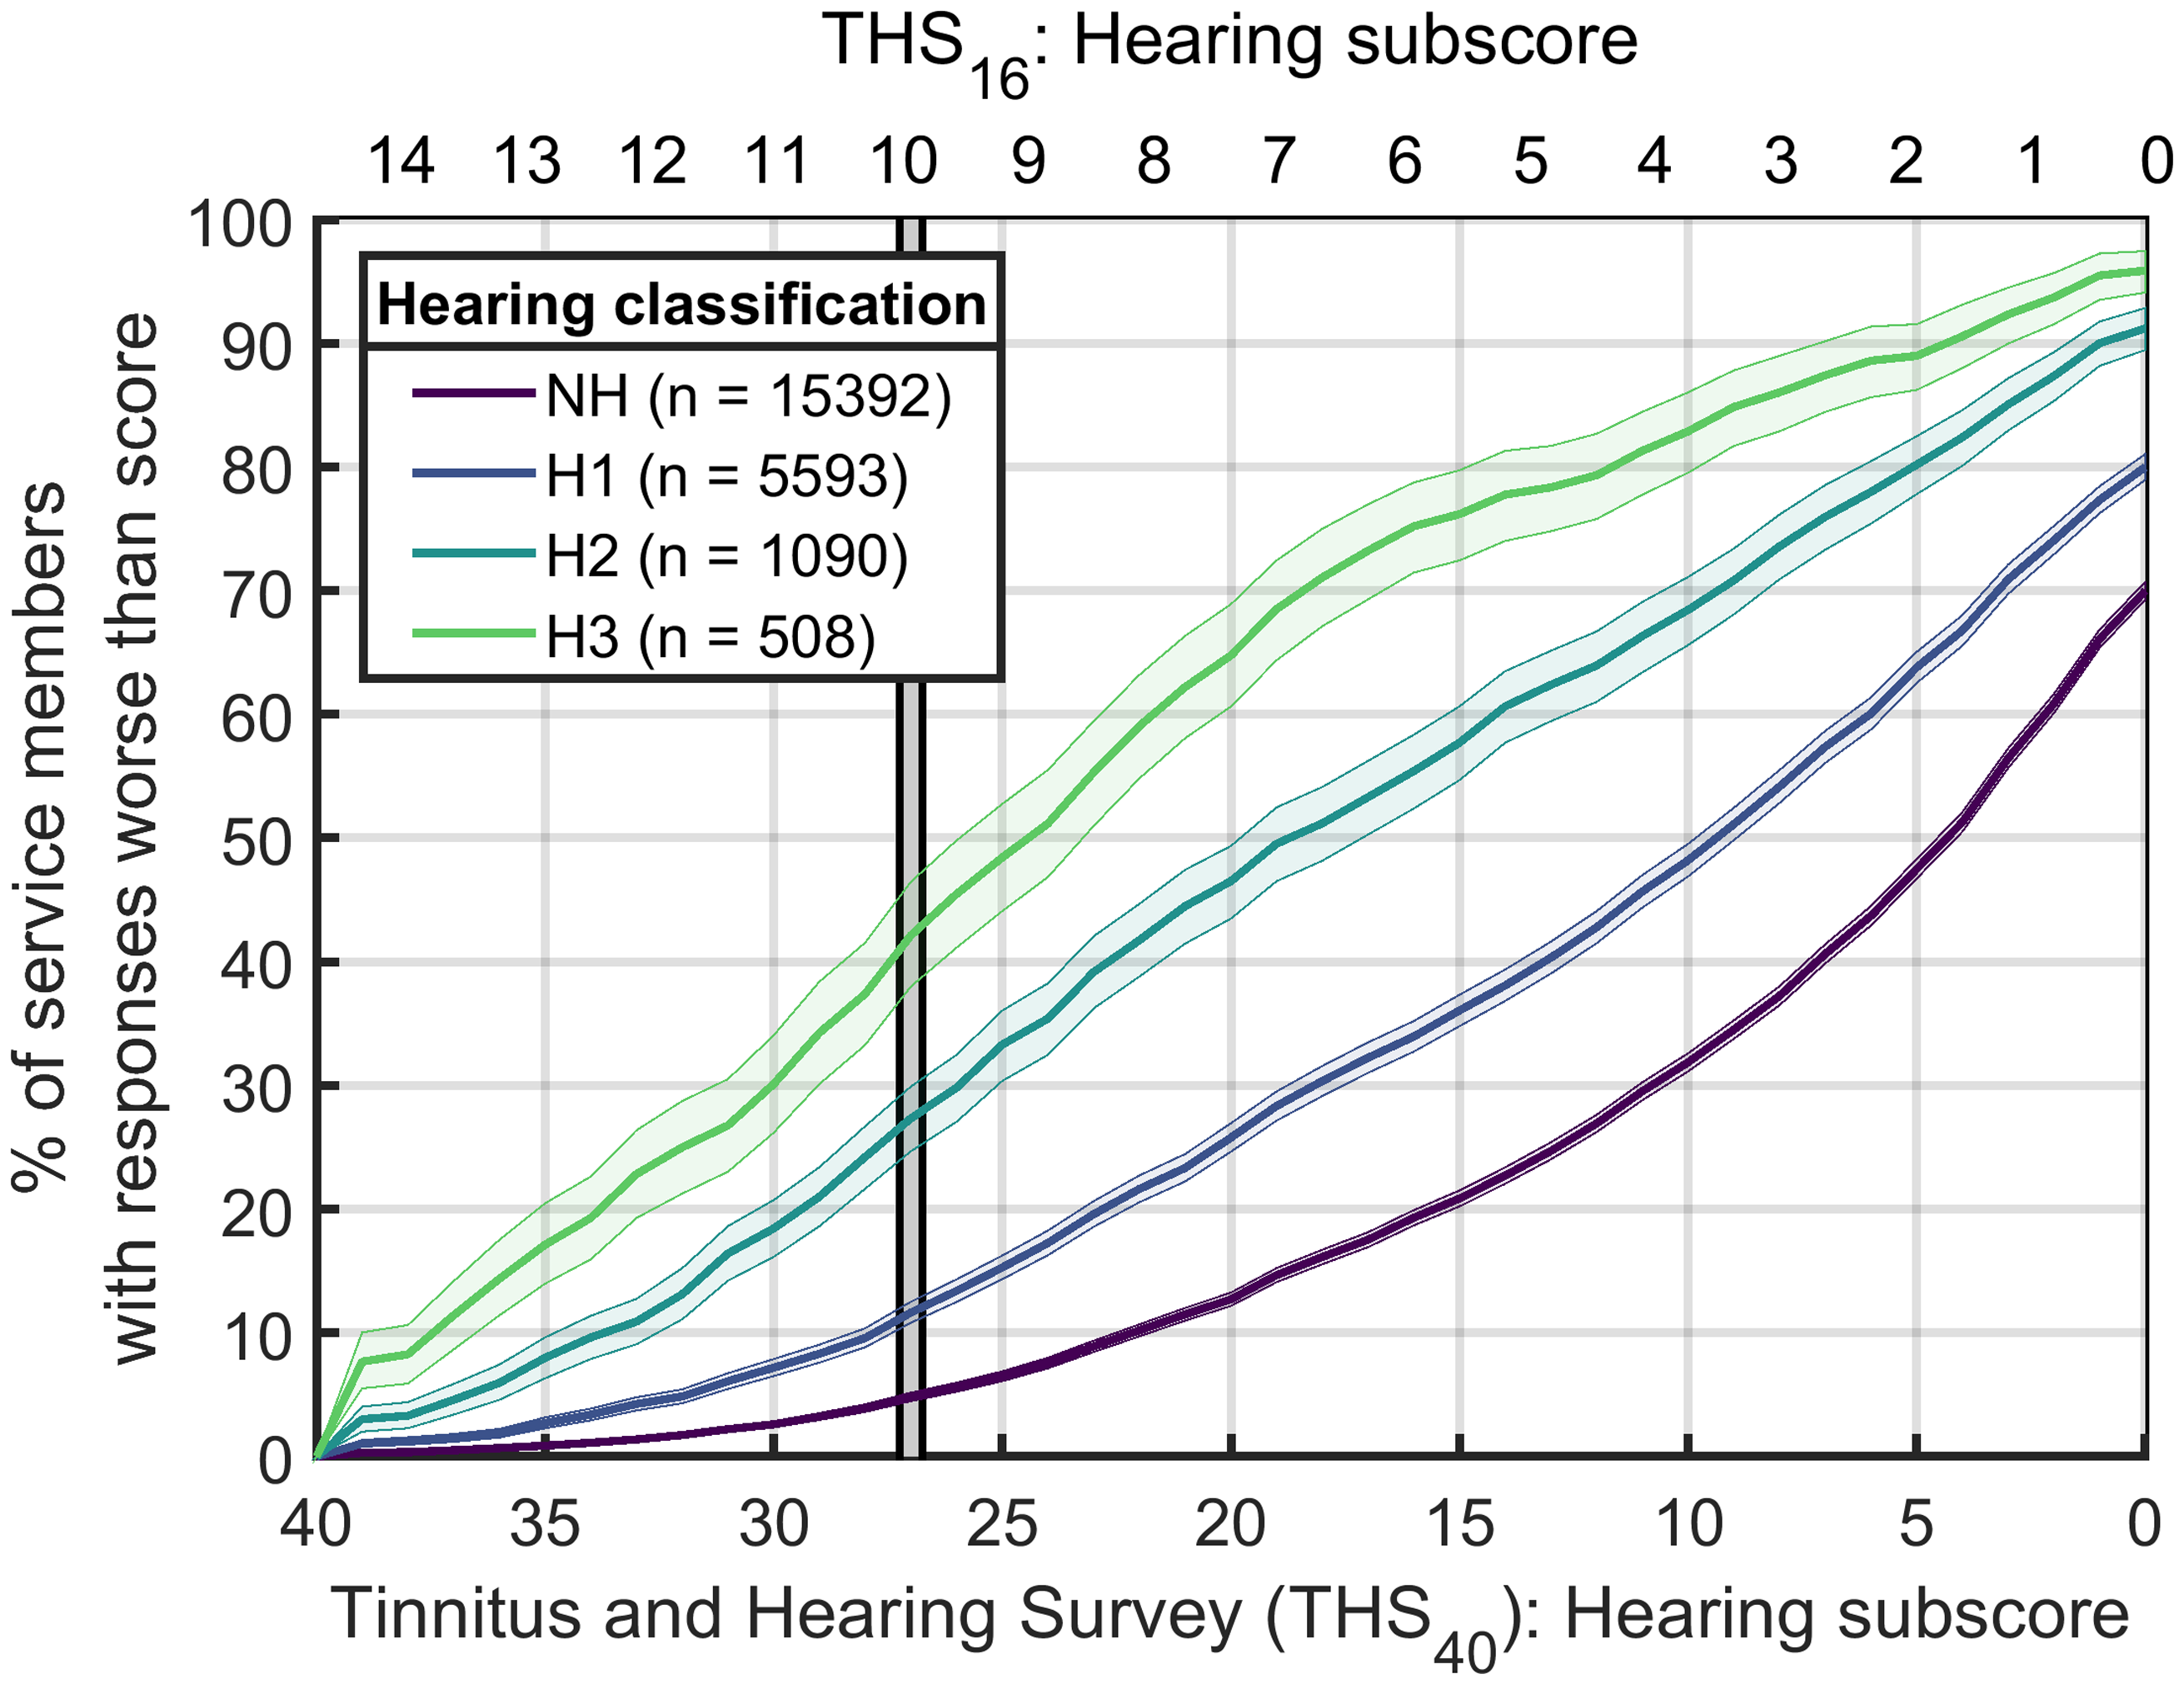
Cumulative distribution of scores for the THS-H hearing profile. The dual x-axis represents scores for THS-H40 (lower axis) and THS-H16 (upper axis). This serves to easily translate between the two scales. The y-axis shows the percentage of participants who had a THS-H score greater than the value indicated on the x-axis. The solid lines show the distribution with color representing hearing classification. The shaded regions represent the 95% bootstrap confidence intervals around the distribution (see text for details). The vertical gray bar indicates the 5th percentile cutoff of 27 for NH participants. NH: Normal Hearing; THS-H: Tinnitus and Hearing Survey.
The shaded regions around each curve represent the 95% confidence interval around the distribution. These confidence intervals were generated with a bootstrapping technique (Efron & Tibshirani, 1994; Varian, 2005) where 10,000 samples matching the size of the available dataset for each hearing profile were randomly selected, with replacement, from all possible scores within that dataset. Thus, for the NH population, 10,000 samples containing 15,392 THS-H40 scores were randomly selected, with replacement, from the THS-H40 scores of the NH participants who participated in the experiment. Each of the 10,000 samples was used to calculate the cumulative distribution value at each of the 41 possible THS-H40 scores (0–40, inclusive), and the 2.5th and 97.5th percentile values of this distribution for each possible score were used to determine the boundaries of the shaded region shown around the NH curve in Figure 3. This process was repeated for the H1, H2, and H3 groups using the sample sizes from those groups.
The vertical gray bar marks the fifth percentile cutoff point for the NH participants on the THS-H, which was 27 for the THS-H40 and 10 for the THS-H16. The cutoff scores can be used to identify individuals with THS-H scores that were worse than those for 95% of all participants with normal hearing and thus may warrant referral for audiological assessment. Roughly 14% of H1 participants, 30% of H2 participants, and 45% of H3 participants had THS-H scores indicating significant subjective hearing difficulty according to this definition.
The median values of the THS-H for each hearing profile are indicated by the points where each curve crosses the 50% point. Thus, the THS-H40 median score was five for NH, 10 for H1, 19 for H2, and 25 for H3. The mean values are not shown in the figure, but they follow a similar pattern. NH participants had a mean score of 8.2 (standard deviation [SD] = 9.2). For those with an H1 profile, the mean was 12.3 (SD = 11.0). Participants with an H2 profile had a mean of 18.4 (SD = 11.9) and those with H3 profiles had a mean of 23.5 (SD = 11.4).
Linear Model Results: Effects of Age, Sex, and Hearing Profile on Mean Performance on the THS-H40
The linear model explained a significant proportion of the variance (F(15,22567) = 199, p < 0.001, R2 = 0.117). For brevity, the analysis of variance (ANOVA) table is reported in Table 3. The ANOVA table provides significance of the model terms without examining the different slopes that result from the linear model fit. The complete linear model with slopes for individual terms is found in Table 4. In Table 3, the columns from left to right report the model terms, degrees of freedom for the model term, F statistic, p value, and effect size as measured by partial eta-squared (η2 p ). Cohen (1988) offers benchmarks for small (η2 p = 0.01), medium (η2 p = 0.06), and large effect sizes (η2 p = 0.14). By these benchmarks, the Age effect is small, the Hearing Profile effect is medium-large, and all two-way interactions are very small. In Table 4, the columns from left to right report the model terms, estimated coefficient (b), standard error of the coefficient, t statistic, and p value. Rows where p < 0.05 are bolded. The reference group is women with normal hearing. Model terms are reported relative to that group (i.e., men with normal hearing score 3.59 points lower than average on the THS-H40 than women with normal hearing). Estimated marginal means for the age × sex × hearing profile interaction are plotted in Figure 4. In order to better understand the age × sex, age × hearing profile, and sex × hearing profile interactions, post hoc testing was conducted. All post hoc testing was performed using Bonferroni correction for multiple comparisons.

Estimated marginal means and standard errors for age group, sex, and hearing profile. Each panel shows a different hearing profile (left to right: NH, H1, H2, H3). Within each panel, age group is plotted along the x-axis and THS-H40 score is plotted along the y-axis. Sex is represented by color (male: blue; female: pink). H1: Army Hearing Profile 1; H2: Army Hearing Profile 2; H3: Army Hearing Profile 3; NH: Normal Hearing; THS-H: Tinnitus and Hearing Survey.
ANOVA Table for Model Fit.

**Rows where p < 0.05 are bolded.
ANOVA: analysis of variance.
Full Linear Model Summary.

**Rows where p < 0.05 are bolded.
H1: Army Hearing Profile 1; H2: Army Hearing Profile 2; H3: Army Hearing Profile 3; SE: standard error.
The interaction between age and sex was driven by the fact that the slope of the male line was steeper than the slope of the female line (b = 0.12, t(22567) = −5.54, p < 0.001). This indicates a more rapid increase in hearing complaints as a function of age for male participants. The slope of 0.12 indicates that for each year of life, the THS-H40 scores of male participants increase roughly a tenth of a point faster than those of women. This amounts to a one-point increase over the course of a decade.
The age × hearing profile interaction was driven by a marginal, but significant, difference in the slope between NH and H1 participants (b = 0.05, t(22567) = 2.43, p = 0.02). This slight change in slope indicates that H1 participants have slightly more hearing complaints (i.e., approximately one-eighth of a point per year of age) as they get older than NH participants.
Finally, the sex × hearing profile interaction was driven primarily by the fact that men with H1 profiles scored 0.97 points lower (SE = 0.35) on the THS-H40 than women with an H1 profile (t(22567) = 2.75, p = 0.006).
Effects of Age and Sex on Normative Cutoffs for NH Participants for the THS-H
The results of the statistical analyses in Tables 3 and 4 show that there was a statistically significant interaction between participant age and sex for the THS-H40 scores. This suggests that it may be necessary to account for age and sex differences when calculating the cutoff value for clinically abnormal hearing complaint in the NH population, rather than simply applying the cutoff score of 27 that was obtained by finding the fifth percentile THS-H40 score across all NH listeners. Note that we did not examine the interactions involving hearing profile because the clinical normative value needs to be based on the population of NH listeners.
Figure 5 addresses this potential issue by showing the cumulative distribution functions of the THS-H for NH male and female listeners from each of the three age groups. The left panel shows results for the 18 to 22 age group, the middle panel shows results for the 23 to 31 age group, and the right panel shows results for the 32 + age group. Within each panel, confidence intervals have been drawn around the distributions of the male and female responses using the same bootstrapping technique as for Figure 3. The vertical gray bars in each panel show the fifth percentile cutoff values for each distribution, with the male cutoff value surrounded by a solid line and the female cutoff value surrounded by a dashed line. In each case, the nominal fifth percentile cutoff THS-H40 value for the female population was slightly higher (poorer, by 1–2 points) than for the male population. However, the zoomed panels at the bottom of the figure show that there was overlap in the 95th percentile confidence intervals for the male and female participants, suggesting that this sex difference may not have been statistically significant in the tails. More precisely, the cutoff THS-H40 value for men under 23 years was 25 (CI95 = [24 26]) and the cutoff THS-H40 value for women under 23 years was 27 (CI95 = [25 28]). The cutoff THS-H40 value for men aged 24 to 31 years was 27 (CI95 = [26 27]) and the cutoff THS-H40 value for women aged 24 to 31 years was 28 (CI95 = [26 29]). Finally, the cutoff THS-H40 value for men 32 + years was 28 (CI95 = [28 29]) and the cutoff THS-H40 value for women 32 + years was 29 (CI95 = [27.75 30]). Because all of the confidence intervals above overlap, we can infer that the cutoff values for males and females are not significantly different from one another for any of the three age groups. This suggests that sex can be safely collapsed within each age group. On the basis of these results, we do not believe there is justification for using different cutoff values for evaluating the hearing complaint scores of male and female patients with clinically normal hearing.

Cumulative distributions for sexwithin each age group for NH listeners only. Each panel shows the cumulative distribution for one age group (from left to right: 18–22, 23–31, and 32+) and men and women within that age group. As in Figure 3, the dual x-axis represents scores on the THS-H40 (lower axis) and THS-H16 (upper axis); y-axis represents the percentage of participants who achieved greater than a given score; solid lines show the distribution, with color representing hearing classification; shaded regions represent 95% bootstrap confidence intervals around the distribution (see text for details). Sexis shown within each panel. Men are shown by the darker, solid line. Women are shown by the lighter, dotted line. Insets show detail at the 5th percentile cutoff point. Note the overlapping shaded regions, indicating no statistical difference between the populations at the cutoff. NH: Normal Hearing; THS-H: Tinnitus and Hearing Survey.
There may, however, be some justification for using different cutoff values for individuals in different age groups. Figure 6 shows the cumulative distributions for all study participants with NH for each of the three age categories, along with the 95% confidence intervals determined from bootstrapping. In this case, the three vertical bars show that the fifth percentile cutoff THS-H40 value was 25 for the 18 to 22 age group, 27 for the 23 to 31 age group, and 28 for the 32 + age group. Moreover, examination of the zoomed inset shows that the 95% confidence intervals of the distributions of these three age groups did not overlap at these fifth percentile values. Thus, we can conclude that there is a slight but statistically significant difference in the THS-H40 cutoff values for these age groups.

Cumulative distributions for each age group for NH listeners only. The x-axis, y-axis, solid lines, and shaded regions represent the same features as for Figures 3 and 5. The distribution of scores for each age group is shown in the different lines and colors (black: 18–22; magenta: 23–31; yellow: 32+). Cutoffs for each group are represented by the vertical gray bars outlined in that group's color. Insets show detail at the 5th percentile cutoff point. Note the nonoverlapping shaded regions indicating statistically significant differences between the populations at the cutoff. NH: Normal Hearing.
Although there was a statistically reliable difference in the cutoff THS-H40 values for the three age groups, the differences were modest, and a strong argument can still be made for using a single THS-H40 for all NH listeners regardless of age. Most participants who scored above the nominal overall cutoff value of 27 for the THS-H40 had scores above 28, and most who scored below this cutoff value had scores below 25. Consequently, changing from the single age-independent THS-H40 cutoff score of 27 to the three different age dependent THS-H40 cutoff scores of 25, 27, and 28 only changed the normal/abnormal hearing complaint classification of 259 of the 22,583 SMs in this study (1.1% of the sample). For many applications, it may be sufficient to use a single cutoff value to classify individuals regardless of age, at least for the age range tested in this study.
Discussion
This study examined responses on the THS-H from a large cohort of participants with different hearing profiles. In general, the results indicate that the THS-H has several characteristics that support its use as a method for rapidly assessing and documenting subjective hearing complaints. First, the results indicate that the THS-H is sensitive to subjective hearing difficulties reported by participants with elevated audiometric thresholds. There was no overlap in the cumulative distributions of the four different hearing profiles shown in Figure 3, and both the mean and median values of the THS-H scores systematically increased with increasing hearing loss. This increase was particularly dramatic for the median THS-H40 value for each hearing profile, which increased from 5 for the NH participants to 10 for the H1 participants, 19 for the H2 participants, and 24 for the H3 participants. Almost half of all H3 participants had THS-H scores that were in the bottom fifth percentile of the scores for NH participants. The results leave no doubt that the THS-H is able to capture many of the hearing difficulties associated with reduced audibility secondary to elevated audiometric thresholds.
Second, the THS-H produces relatively stable distributions of responses across a wide range of participants with normal audiometric thresholds. There was essentially no difference in the distributions of scores for male and female NH participants. There was a small difference in the distributions of scores for NH participants in different age groups, but this difference was small relative to the differences that occurred with relatively minor changes in hearing acuity. For example, the fifth percentile THS-H40 cutoff score changed by 3 points from 25 to 28 across the three NH age groups tested in the experiment, but changed by six points from 27 to 33 for participants when the hearing profile increased from NH to a relatively mild H1 hearing loss.
Third, the THS-H takes relatively little time to administer and score. If the four items from the THS-H are embedded with other questions in an electronic survey, the additional time required to administer the THS-H is minimal. To verify rapid administration, we used the electronic data records recorded by the tablet computer to analyze the time taken by a subset of 2000 participants to respond to each of the four THS-H40 items. The results show that participants took an average of 7.4 s to respond to the first item and 4.1 s to respond to each of the next three items. Including the time required to display the pages, this means that the participants spent an average of about 20 s responding to all of the THS-H40 questions.
Collectively, the results provide evidence to support the use of the THS-H as a tool for quantifying and comparing hearing difficulties across patients, rather than simply as a tool to compare within-patient complaints related to subjective hearing difficulty for people with tinnitus. Scores for the THS-H40 had notable separation by hearing profiles with a justifiable cutoff for the values considered to be within normal limits. Healthcare providers who treat patients with auditory complaints can use this information to identify individuals who have elevated THS-H40 scores and to determine the percentile values of individual scores relative to the population who have normal audiometric thresholds. They can also use the percentile values provided for individuals with different degrees of hearing loss to compare the severity of the hearing complaints of individuals to those for other patients with similar audiometric thresholds.
Systematic documentation of THS-H40 scores could also significantly enhance the ability of hearing conservation programs to track changes in hearing performance over time, and to identify trends suggesting that certain subpopulations may be at an increased risk of long-term hearing difficulties as a result of their occupational noise exposure. For example, Brungart et al. (2019) conducted a study comparing THS-H40 scores to scores on a noise history questionnaire for 3,330 SMs and found that individuals who reported experiencing temporary changes in hearing after exposure to loud noises reported more subjective hearing difficulty than those who did not experience a temporary change in hearing, even when controlling for age, hearing thresholds, and overall noise exposure. Current hearing conservation programs only track hearing thresholds, which may fail to capture the subjective hearing difficulties that many noise-exposed individuals appear to experience even in the absence of audiometric threshold shifts.
It is likely that systematic documentation of the THS-H40 score could have other benefits. For example, it might provide an objective way to monitor changes in subjective hearing complaints over time for a given patient and for assessing the benefits provided by clinical intervention for hearing loss. THS-H40 scores, alone or in combination with the audiogram, might also provide a better way of predicting speech-in-noise performance than the audiogram alone. Further research is now underway to evaluate how the THS-H40 score changes over time for individual patients and to determine how the THS-H40 scores correlate with speech-in-noise scores and with performance on other real-world listening tasks. With regard to other functional auditory abilities, a recent publication found that the THS-H40 score was significantly related to the Binaural Masking Level Difference as well as the N0Sπ component, measures of binaural listening advantage (Davidson et al., 2023).
Although the data described in this paper were collected on a population of SMs, there is reason to believe that the THS-H could be a valuable tool for assessing subjective hearing difficulty in the general population. Most clinical protocols for screening hearing loss in large populations (such as in public schools) or for monitoring populations for hearing loss (as occurs in occupational audiology clinics) focus almost exclusively on audiometric thresholds and do not assess subjective hearing complaints. However, recent studies indicate that individuals with normal audiometric thresholds may have subjective hearing difficulty (Koerner et al., 2020; Musiek et al., 2017). The prevalence of subjective hearing complaints in patients with normal audiometric thresholds has been estimated in a number of studies. The reported prevalence is consistently between 10% and 25% in the general adult population based on clinical referrals and questionnaires (Jerger et al., 1990; Parthasarathy et al., 2020; Quaranta et al., 2015; Spehar & Lichtenhan, 2018). Thus, the collection of data from a questionnaire like the THS-H could provide a valuable supplement to the audiogram for spotting preclinical changes in hearing that might identify individuals who are at risk for long-term hearing problems. The availability of cutoff values for individuals with normal hearing thresholds may make the THS-H40 particularly valuable for this type of screening protocol.
Using a questionnaire to assess listening difficulties, even for those with normal audiograms, is not a novel idea. In fact, one study including 164 adults with auditory processing disorder (APD) and 70 adults without found 93.9% sensitivity and 82.9% specificity for their 16-item questionnaire in identifying APD (Obuchi & Kaga, 2020). Notably, three of the four item topics on the THS-H are represented in the Obuchi and Kaga questionnaire and the THS-H takes a quarter of the time to administer. This provides support that the items asked in the THS-H to develop the score cutoff of 27 are generalized to more than just the military population, as the situations described pertain to all individuals.
Study Limitations
The main limitation of this study is that the normative values were derived from active duty SMs, a demographic group that may not represent the general population. This group has a much higher proportion of males than the general population, and tends to be younger and healthier, at least in terms of physical activity. It is also likely that a higher proportion of this population is exposed to hazardous noise than for the general population. This raises the question of whether it is reasonable to use the normative cutoff values obtained in this study to assess the hearing problems of civilians in the general population.
While it is difficult to answer this question authoritatively without a similar dataset collected on the civilian population, there are some indications that the results obtained in this study might be generalizable to the civilian population. First, there were relatively small differences in the hearing complaints of males and females. When comparing the potential occupational noise exposures of SMs to civilians, the primary fields that don't overlap between the two groups are those in the “Combat Arms” specialties (defined within the US Army as infantry, air defense artillery, armor, aviation, engineers, field artillery, and special forces). Although all these specialties are now open to women in the US armed forces, as of 2022 women were only filling 4.2% of the Combat Arms roles in the Army (compared to 15.6% of the active-duty Army force overall). If the unique exposures of the Combat Arms personnel were a major driver of hearing complaints in the military, one might expect a larger discrepancy between the male and female hearing complaints than the one found in this sample of US SMs.
Another indicator that, in the aggregate, US military personnel with NH thresholds do not give substantially different hearing complaint scores than the civilian population with normal hearing comes from comparisons of the Speech and Spatial Qualities Questionnaire (SSQ) data that Grant et al. (2021) collected on military personnel and Zahorik and Rothpletz (2014) collected from civilians. The SSQ is frequently used to assess hearing difficulties in auditory research studies (Gatehouse & Noble, 2004). Grant et al. used methods similar to those of this study to test a sample of 2,491 SMs who had NH thresholds with a six-question subset of the SSQ and found an average score of 7.35 out of 10. In a separate study, Zahorik and Roethpletz tested a group of 221 college students with normal hearing on the full SSQ and found that the average score on the six SSQ questions tested by Grant et al. was 7.45. The average scores across the six questions were not statistically different for the military and civilian samples (two-tailed t-test, p = 0.35). While not definitive, these results suggest that it may not be unreasonable to use normative hearing complaint data collected on a large sample of NH SMs as a way to assess the hearing complaints of civilian audiology patients. Further research is underway to conduct a more detailed comparison of the differences between the responses that military and civilian personnel make on subjective hearing difficulty questionnaires.
Another potential limitation of the study, for some applications, is that the data were primarily collected with an 11-point Likert scale (THS-H40) rather than the five-point Likert scale associated with the original version of the THS (THS-H16). There was a high correlation between the percentile scores for the THS-H16 and THS-H40, so for most purposes we believe the results of this study could be applied to THS-H16 scores that are transformed using the linear equations provided in the methods section. However, the finer-grained quantization of scores on the THS-H40 makes it a better option than the THS-H16. The normative data presented suggest there are some cases where a single point change in one of the four items on the THS-H16 can lead to as much as a 15-point change in the percentile score. Thus, the advantages of improved response resolution obtained by using the THS-H40 outweigh the disadvantages of changing the response scale from the original version of the test. If the THS is used for its original purpose of comparing complaints related to hearing problems to those related to tinnitus, this comparison could still be done if both the tinnitus and hearing subscales were scored with an 11-point scale. Work is currently underway to provide normative cutoff values for an 11-point version of the tinnitus subscale of the THS, along with a method for transforming scores between the five-point and 11-point versions.
Conclusions
The THS is well established as a clinical screening tool for separating hearing and tinnitus problems. This study collected normative data that make it possible to use the hearing subscale of the THS (the THS-H) as a way to compare the hearing complaints of an audiology patient to those of other individuals with normal hearing thresholds or, alternatively, to those of other individuals with similar levels of hearing impairment. We are currently making an electronic version of the THS available to audiologists within the DoD with the recommendation to administer it to all patients as part of the general patient history. The results are recorded in the patient note as a mean THS-H40 score with a percentile value indicating where the score ranks among other SMs with NH. If this is done consistently, we think it will assist military audiologists in separating individuals who have hearing problems that require intervention from the “worried well” who report subjective hearing difficulty but have hearing performance that falls in the normal range. We also think it will help audiologists track changes in subjective hearing difficulty over time, and to track the effectiveness of clinical interventions. Although the data in this study were obtained exclusively from US SMs, there is reason to believe they may be helpful for the assessment of civilian clinical patients as well. Overall, we are confident that the THS-H could become a useful clinical tool for rapidly assessing and documenting the subjective hearing complaints of audiology patients and of individuals enrolled in civilian and military hearing conservation programs.
Footnotes
Acknowledgements
The authors would like to thank the audiologists and audiology technicians across the hearing conservation clinics who collected data for this protocol. The views expressed in this article are those of the authors and do not necessarily reflect the official policy of the Department of Defense, Department of the Army, U.S. Army Medical Department, or the U.S. Government.
Declaration of Conflicting Interests
The authors declared no potential conflicts of interest with respect to the research, authorship, and/or publication of this article.
Funding
The authors disclosed receipt of the following financial support for the research, authorship, and publication of this article: This work was supported by the Defense Health Program, Congressionally Directed Medical Research Programs Joint Program Committee.