
Abstract
The present study compared elderly hearing aid (EHA) users (n = 20) with elderly normal-hearing (ENH) listeners (n = 20) in terms of isolation points (IPs, the shortest time required for correct identification of a speech stimulus) and accuracy of audiovisual gated speech stimuli (consonants, words, and final words in highly and less predictable sentences) presented in silence. In addition, we compared the IPs of audiovisual speech stimuli from the present study with auditory ones extracted from a previous study, to determine the impact of the addition of visual cues. Both participant groups achieved ceiling levels in terms of accuracy in the audiovisual identification of gated speech stimuli; however, the EHA group needed longer IPs for the audiovisual identification of consonants and words. The benefit of adding visual cues to auditory speech stimuli was more evident in the EHA group, as audiovisual presentation significantly shortened the IPs for consonants, words, and final words in less predictable sentences; in the ENH group, audiovisual presentation only shortened the IPs for consonants and words. In conclusion, although the audiovisual benefit was greater for EHA group, this group had inferior performance compared with the ENH group in terms of IPs when supportive semantic context was lacking. Consequently, EHA users needed the initial part of the audiovisual speech signal to be longer than did their counterparts with normal hearing to reach the same level of accuracy in the absence of a semantic context.
Introduction
In daily face-to-face conversation, listeners benefit from combined auditory and visual speech signals that facilitate the identification of speech stimuli in comparison with auditory-only or visual-only presentation (Erber, 1969; Sumby & Pollack, 1954). The audiovisual presentation of speech stimuli is particularly important for hearing-impaired individuals, who, even when using their hearing aids, have greater difficulties in perceiving auditory speech stimuli compared with normal-hearing listeners (Dimitrijevic, John, & Picton, 2004; Moradi, Lidestam, Hällgren, & Rönnberg, 2014a). Walden, Grant, and Cord (2001) reported that the addition of visual cues to amplified auditory signals by hearing aids resulted in better identification of speech stimuli relative to unaided audiovisual or aided auditory-only conditions. An important question that remains unexplored is whether hearing aid users have the same level of ability for audiovisual speech recognition as their age-matched normal-hearing counterparts.
A few studies have attempted to compare the audiovisual speech abilities of hearing-impaired and normal-hearing listeners; all were conducted under unaided conditions, in which the auditory component of audiovisual stimuli was delivered to the ear(s) of listeners (Baskent & Bazo, 2011; Bernstein & Grant, 2009; Tye-Murray, Sommers, & Spehar, 2007a). Bernstein and Grant (2009) and Baskent and Bazo (2011) found that hearing-impaired listeners performed more poorly than normal-hearing listeners in both auditory-only and audiovisual conditions. In addition, Tye-Murray, Sommers, & Spehar (2007a) found that the benefit of the additional visual information was approximately the same in both normal hearing and hearing-impaired groups, once performance in the auditory-only condition was equated across the two groups. The auditory component of audiovisual speech signals is a key variable in audiovisual speech performance in hearing-impaired (Corthals, Vinck, De Vel, & Van Cauwenberg, 1997; Picou, Ricketts, & Hornsby, 2013) and normal-hearing (Baart, Vroomen, Shaw, & Bortfeld, 2014) listeners. As the clarity of the auditory component of the audiovisual speech signal is reduced, performance in audiovisual speech identification is decreased as well. Therefore, it seems that poorer auditory coding by hearing-impaired individuals (relative to normal-hearing listeners) results in inferior performance for these individuals in the audiovisual identification of speech stimuli presented at a constant signal-to-noise ratio (SNR) or sound pressure level (SPL; see Baskent & Bazo, 2011; Bernstein & Grant, 2009). However, by individually setting SPL or SNR across the groups, there would be no difference between hearing-impaired and normal-hearing groups in the audiovisual identification of speech stimuli (see Tye-Murray, Sommers, & Spehar, 2007a). This is supported by studies that found no differences between hearing-impaired and normal-hearing listeners in lip-reading ability (Lyxell & Rönnberg, 1989; Tye-Murray, Sommers, & Spehar, 2007a) and audiovisual integration ability (Tye-Murray, Sommers, & Spehar, 2007a).
The present study extends a previous study by Moradi et al. (2014a) by investigating the audiovisual rather than just the auditory modality. Specifically, this study aimed to compare elderly hearing aid (EHA) users and elderly normal-hearing (ENH) individuals in terms of isolation points (IPs, Grosjean, 1980; the shortest time from the onset of a speech stimulus required for correct identification of that speech stimulus) and accuracy (in identification) for different types of audiovisual speech stimuli (consonants, words, and final words in less predictable, LP, and highly predictable, HP, sentences) presented at the same SPL in silent conditions. Another aim was to investigate the extent to which adding visual cues would impact the IPs for different types of speech stimuli in EHA users and ENH individuals. To this end, we compared audiovisual IPs and accuracies of different speech stimuli from the present study with auditory IPs and accuracies extracted from Moradi et al. (2014a). Moradi et al. (2014a) reported that EHA users needed longer IPs for the auditory identification of consonants, words, and final words in LP sentences than ENH individuals, although there was no difference between the two groups in terms of IPs for final word identification in HP sentences. With regard to accuracy, the EHA users had lower accuracy for the auditory identification of consonants and words than the ENH individuals, but no difference was observed between the two groups either in LP or HP sentences.
Since the addition of visual cues to auditory speech stimuli greatly helps the identification of speech stimuli in terms of both IP and accuracy (see Moradi, Lidestam, & Rönnberg, 2013), we assumed that the EHA users may reach similar performance as ENH individuals, in terms of both IPs and accuracy, in audiovisual identification of speech stimuli presented at the same SPL in silent conditions. In addition, we predicted that the audiovisual IPs of different types of speech stimuli will be shorter than auditory IPs (extracted from Moradi et al., 2014a) either in EHA and ENH groups.
Methods
Participants
We recruited two groups of participants in the present study: EHA users and ENH individuals.
EHA users
A total of 20 native Swedish speakers (13 men and 7 women) with a symmetrical bilateral mild-to-moderate hearing impairment took part in this study. The participants were experienced hearing aid users selected from an audiology clinic patient list at Linköping University Hospital, Sweden. Their ages ranged from 69 to 77 years (M = 73.1 years) at the time of testing. They had been habitual hearing aid users for at least 1 year. On average, the participants reported having had hearing loss for 6.2 years (SD = 5.5; range, 1 year and 1 month to 14 years and 7 months). In Moradi et al. (2014a), the average duration of hearing loss was 5.4 years (SD = 3.4; range, 2 years to 13 years and 10 months). There was no significant difference in the duration of hearing loss between the EHA group in the present study and the EHA group in Moradi et al. (2014a), t(30.64) = 0.56, p = .58. In addition, when comparing pure-tone average thresholds of the across seven frequencies (PTA7) for the EHA users in the present study and Moradi et al. (2014a), there were no significant differences neither in the PTA7 left ear, t(42) = 0.04, p = .97, nor in the PTA right ear, t(42) = 0.80, p = .43.
Brands and Models of Hearing Aids Used by EHA Users.
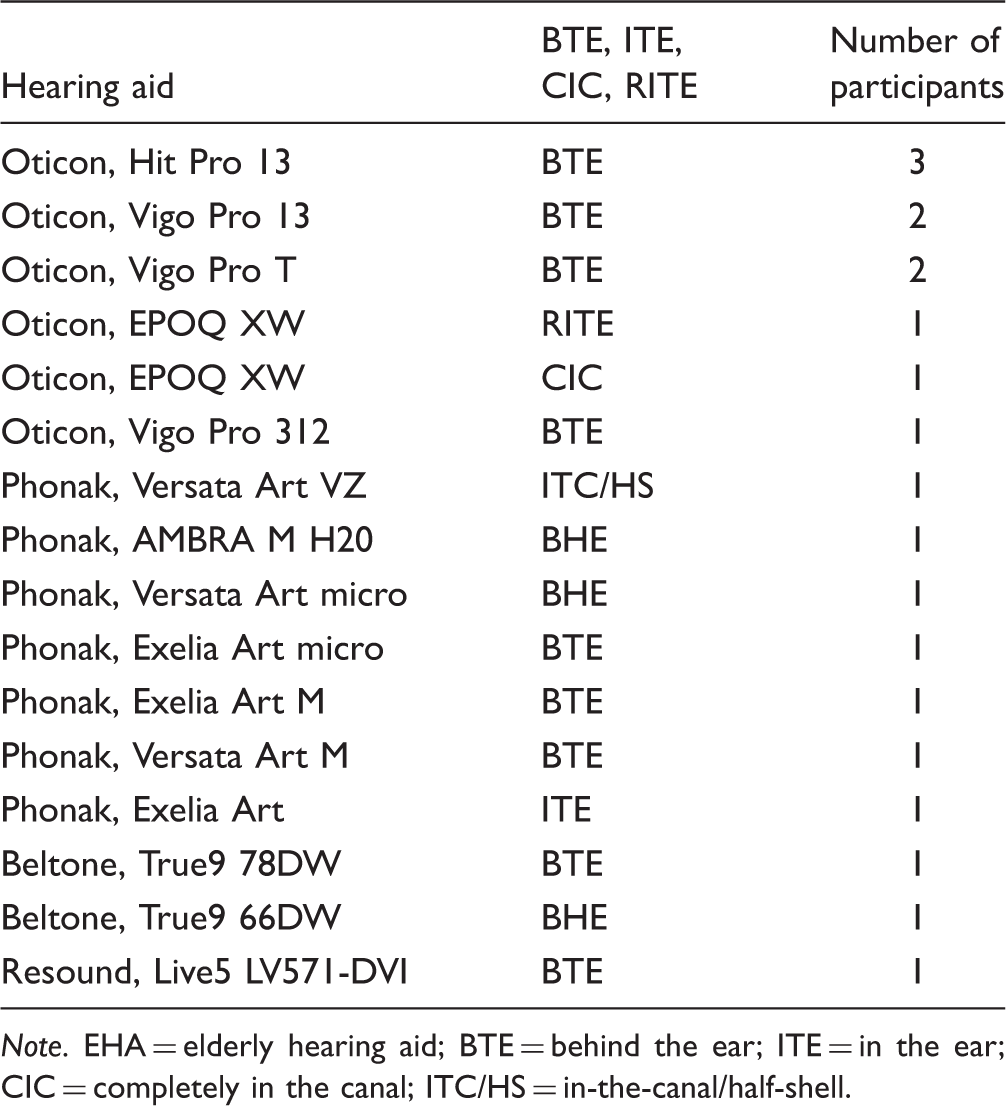
Note. EHA = elderly hearing aid; BTE = behind the ear; ITE = in the ear; CIC = completely in the canal; ITC/HS = in-the-canal/half-shell.
As in Moradi et al. (2014a), the EHA users wore their own hearing aids, and the amplification settings of their hearing aids were not changed throughout the testing in order to prevent a novelty effect that might impact on their performance in the speech tasks.
The study inclusion criteria were as follows: (a) age over 65 years, (b) Swedish as the native language, and (c) bilateral hearing impairment with an average threshold of > 35 dB for pure-tone frequencies of 500, 1,000, 1,500, and 2,000 Hz.
Elderly people with normal hearing
A total of 20 native Swedish speakers with age-appropriate normal hearing (9 women and 11 men) took part in the present study. Their ages ranged from 67 to 76 years (M = 71.7 years). These individuals were from the general population living within the hearing clinic catchment area. They were recruited primarily via invitation letters sent to their addresses and via flyers.
The inclusion criteria for this group were the following: (a) age over 65 years, (b) Swedish as the native language, and (c) a mean threshold of < 20 dB for pure-tone frequencies of 500, 1,000, 1,500, and 2,000 Hz.
Pure-tone thresholds
Mean and Standard Deviations (in Parentheses) of Audiometric Thresholds for EHA Users and ENH Individuals.

Note. EHA = elderly hearing aid; ENH = elderly normal-hearing.
Participant characteristics
Participants in both groups (ENH and EHA groups) reported themselves to be in good health. They did not suffer from tinnitus, middle-ear pathology, dementia, seizures, Parkinson’s disease, or psychological disorders that might compromise their ability to perform the speech and cognitive tasks.
The participants in both groups completed the Mars Letter Contrast Sensitivity Test (Arditi, 2005) and a word comprehension test (Järpsten, 2002) to measure their visual acuity and vocabulary knowledge, respectively. To be included in this study, the participants’ scores in the Mars Letter Contrast Sensitivity Test had to be within age-appropriate ranges (i.e., above 1.52 contrast sensitivity log), according to the test manual (Mars Perceptrix, n.d.), and the participants had to score over 30 in the word comprehension test.
Means, Standard Deviations and Significance Levels for EHA and ENH Groups for the Age, Years of Formal Education, Word Comprehension Test, Mars Letter Contrast Sensitivity Test, and PTA7 for the Right and Left Ears.

Note. EHA = elderly hearing aid; ENH = elderly normal-hearing.
Ethical Considerations
All participants were fully informed about the study and gave written consent for their participation. The Linköping regional ethical review board approved the study, including the informational materials and consent procedure.
Stimuli
Talker
A female native talker with a general Swedish dialect read all of the speech stimuli at a natural articulation rate in a quiet studio while looking straight into the camera. The talker maintained a neutral facial expression, avoided blinking, and closed her mouth before and after articulation. Each target speech stimulus was recorded several times, and the best of the video and audio items recorded were selected.
Video recording
Visual speech stimuli were recorded with a RED ONE digital camera (RED Digital Cinema Camera Company, CA, USA) at a rate of 120 frames per second (each frame = 8.33 ms, see Figure 1), in 2,048 × 1,536 pixels. Note that at this frame rate, the camera cannot record sound; therefore, the auditory component of the audiovisual speech signal had to be recorded separately. The video recording was segmented into separate target speech items using Final Cut Pro software, version 7.0.3 (Apple Inc., CA, USA). In the next step, the video files were cropped so that the number of pixels to be processed was reduced to 600 × 670 pixels, and then saved as non-compressed “.mov” files. The reducing of pixels of the recorded stimuli had two aims. First, it lowered the processing demands for playback, ensuring that presentation could be executed without synchronization errors according to Psychophysics Toolbox (Brainard, 1997; Kleiner, Brainard, & Pelli, 2007; Pelli, 1997). Second, it matched the pixels of “.mov” files with the settings of the screen used for presentation (i.e., no loss in spatial resolution). Each video file on the testing computer monitor showed the hair, face, and top part of the talker’s shoulders against a dark gray background. The video files were inspected for anything that may distract the participants. The start and end frames of each video file showed a still face.
An illustration of gating for audiovisual identification of consonants.
Audio recording
The auditory speech stimuli were recorded with a directional electret condenser stereo microphone at 16 bits and a sampling rate of 48 kHz. The recorded auditory stimuli were segmented into separate auditory target speech stimuli using Sound Studio 4 software (Felt Tip Inc., NY, USA). The onset and offset of each auditory speech stimulus were set carefully according to inspection of the speech waveform (using Sound Studio 4) and auditory feedback by the first two authors. Each auditory speech stimulus was then saved as a “. wav” file. The root mean square value was calculated for each speech stimulus, and the stimuli were then rescaled to equate levels across the speech stimuli. The audio speech stimuli were inspected for clicks, noise, and phonemic distinctiveness.
Measures
A detailed description of the gated speech tasks employed in the present study is available in Moradi et al. (2013, 2014a). We provide a brief description of the gated tasks below. Note that the gated speech tasks in the present study used exactly the same speech stimuli employed by Moradi et al. (2014a) in auditory identification of different types of speech stimuli. In the present study, we presented the same speech stimuli audiovisually.
Consonants
A total of 18 Swedish consonants, structured in a vowel-consonant-vowel syllable format (/aba, ada, afa, aga, aja, aha, aka, ala, ama, ana, aŋa, apa, ara, aʈa, asa, aʃa, ata, and ava/) were employed in the present study. The phonemic context /aCa/ was used to minimize coarticulation effects. The gate size for consonants was set at 16.67 ms. Gating started after the first vowel, /a/, immediately at the start of the consonant onset. Thus, the first gate included the vowel /a/ plus the initial 16.67 ms of the consonant, the second gate added a further 16.67 ms of the consonant (total of 33.33 ms), and so on. The consonant-gating task took 10–15 minutes per participant to complete. Figure 1 shows an example of audiovisual gating presentation for consonant identification.
Words
We employed 23 Swedish monosyllabic words in a consonant-vowel-consonant format (CVC, all nouns). These words were selected from 46 Swedish monosyllabic words used in the study by Moradi et al. (2013). Each word used in the present study had a small-to-average number of neighbors (i.e., three to six alternative words with the same pronunciation of the first two phonemes). The gate size for words was set at 33.3 ms, as used by our previous studies. The explanation for this gate size was based on our pilot studies showed that the identification of words with the gate size of 16.67 ms started from the first phoneme in CVC format lead to exhaustion and loss of motivation. Hence, a double gate size (33.3 ms) started from the onset of second phoneme has been used to avoid fatigue in participants. The word-gating task took around 15 to 20 minutes to complete.
Final words in sentences
There were two sentence types in this study; the types differed according to how predictable the last word in each sentence was. The sentences ended with either an HP word, for example, “Lisa gick till biblioteket för att låna en bok” (“Lisa went to the library to borrow a book”), or an LP word, for example, “I förorten finns en fantastisk dal” (“In the suburb there is a fantastic valley”). The final (target) word in each sentence was always a monosyllabic noun. The gate size for identification of final words in sentences was set at 16.67 ms. In total, there were 22 sentences (11 HP sentences and 11 LP sentences). The sentence-gating task took around 10 to 15 minutes to complete.
Procedure
An iMac (OS X 10.8.5) running MATLAB (R2013b) and Psychophysics Toolbox (version 3.0.11) were used to synchronize the audio and video speech stimuli and to present the audiovisual gated stimuli. Details about the synchronization of audio and video stimuli, and about the MATLAB script used to gate the speech stimuli, are available in Lidestam (2014). The iMac was equipped with a fast solid-state hard drive (Pegasus J2), and a fast interface to ensure adequate speed for video rendering and playback. The iMac was configured for dual-screen presentation. The visual stimuli were displayed on a 21” CRT monitor (DELL UltraScan P1110, 120-Hz refresh rate, 800 × 600 pixel resolution) inside the sound booth and viewed from a distance of 70 cm. The audio stimuli were delivered via the iMac, which was routed to the input of two loudspeakers (Genelec 8030A) located to the right and left of the CRT monitor. The experimenter used the iMac outside the sound booth to present the gated stimuli, monitor the participants’ progress, and record the participants’ responses. A microphone (in the sound chamber, routed into the audiometry device) delivered the participants’ verbal responses to the experimenter through a headphone connected to the audiometry device. The average overall SPL for the audiovisual gated speech stimuli was 65 dB SPL (as in Moradi et al., 2014a) for both EHA and ENH groups. This was measured in the vicinity of the participant’s head with a Larson-Davis System 824 (UT, USA) sound level meter in free field.
The testing procedure was similar to that described by Moradi et al. (2014a); however, the current study additionally included the Mars Letter Contrast Sensitivity Test, which was utilized to assess participants’ visual contrast sensitivity. Participants were tested individually in a sound booth. Initially, pure-tone hearing thresholds (125–8000 Hz) were obtained (using an Interacoustics AC40 audiometer) and then the visual contrast sensitivity scores were acquired (using the Mars Letter Contrast Sensitivity Test).
The participants underwent a practice session to become familiarized with the gated presentation of stimuli, which involved completing some trial runs. The practice session comprised three gated consonants (/v k ŋ/) and two gated words (/tum [inch]/ and /bil [car]/). Feedback was provided during the training session but not during the experiment. After the practice, the gating paradigm started.
All participants began with the consonant identification task, followed by the words task, and ending with the final words in sentences task. There were short rest periods to prevent fatigue. The order of item presentation within each gated task (i.e., consonants, words, and final words in sentences) varied among the participants. Participants gave their responses orally and the experimenter wrote these down.
The presentation of gates continued until the target item was correctly recognized on six consecutive presentations; this meant that random guessing was avoided. If the target item was not correctly recognized, presentation continued until the end of the stimulus. When a target was not correctly identified, its entire duration plus one gate size was calculated as the IP for that item (this scoring method corresponds to our previous studies and to other studies that have employed the gating paradigm; Elliott, Hammer, & Evan, 1987; Hardison, 2005; Lidestam, Moradi, Petterson, & Ricklefs, 2014; Metsala, 1997; Moradi et al., 2013, 2014a; Moradi, Lidestam, Saremi, & Rönnberg, 2014; Walley, Michela, & Wood, 1995).
The word comprehension test (a measure of vocabulary knowledge) was administered in a second session with the other cognitive and speech-in-noise tests. In the present study, we only report the results for the gated speech stimuli.
Results
Group Comparison of Gated Audiovisual Speech Task Results
Mean IPs, SD (in Parentheses), and Significance Levels for the Identification of Different Types of Speech Stimuli in EHA Users and ENH Individuals Presented Audiovisually and Auditorily (Moradi et al. 2014a).

Note. EHA = elderly hearing aid; ENH = elderly normal-hearing; LP = less predictable; HP = highly predictable; IP = isolation points.
Descriptive Statistics for the Accuracy of Consonants, Words, and Final Words in HP and LP Sentences in the EHA Users and the ENH Individuals Presented Audiovisually (present study) and Auditory (Moradi et al. 2014a).
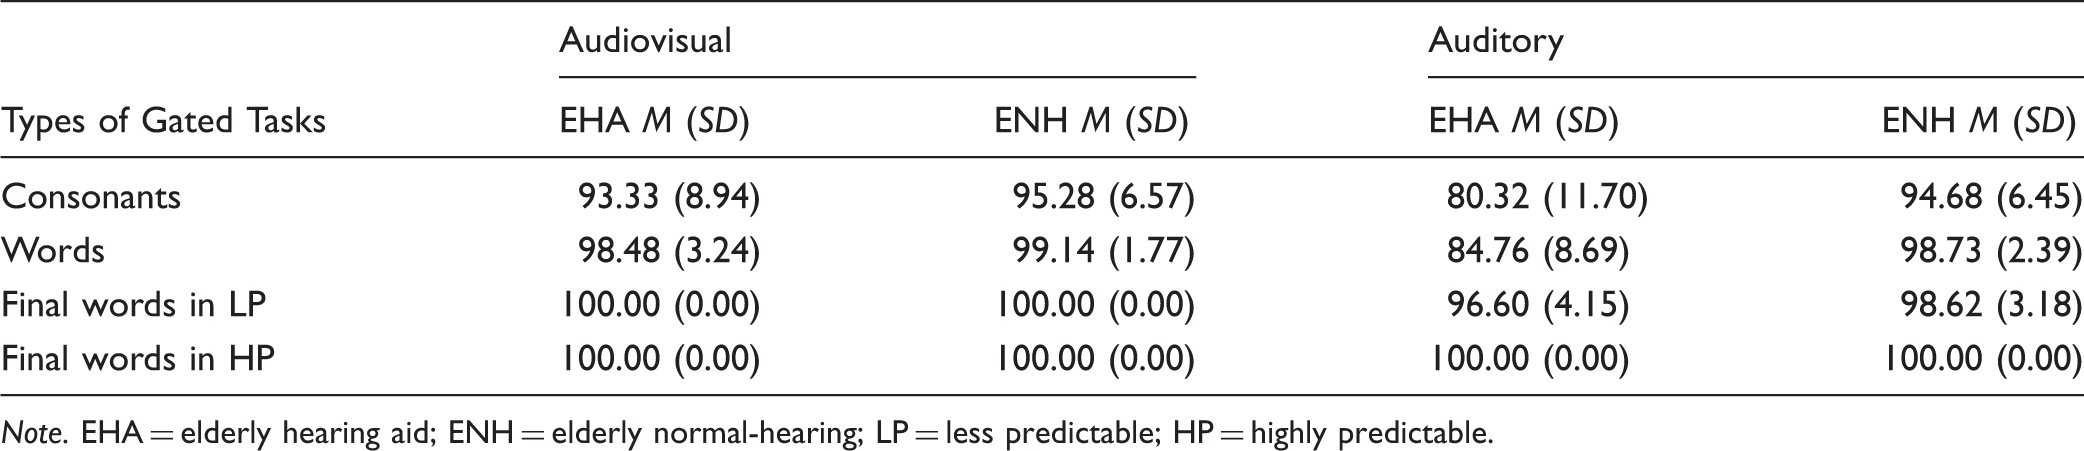
Note. EHA = elderly hearing aid; ENH = elderly normal-hearing; LP = less predictable; HP = highly predictable.
Thus, the results showed that the EHA users needed longer IPs for the identification of speech stimuli when a supportive semantic context was lacking. In terms of accuracy, the EHA users and ENH individuals demonstrated a similar level of performance for the identification of different types of audiovisual speech stimuli.
Comparison of Gated Audiovisual Versus Auditory Speech Task Results
In the next step, we compared the IPs and accuracies for different types of audiovisual speech tasks in the present study with those for different auditory speech tasks observed in our previous study (Moradi et al., 2014a). This comparison (Table 4) enabled us to investigate the extent to which the addition of visual cues on the auditory speech stimuli affected the IPs and accuracy with different types of speech stimuli. A 2 (Modality: audiovisual, auditory) × 2 (Aided hearing loss: EHA, ENH) × 4 (Gated task: consonants, words, final words in HP and LP sentences) mixed ANOVA with repeated measures on the third factor was computed to examine the effects of presentation modality and aided hearing loss on the mean IPs for different types of gated task. The results showed a main effect of modality, F(1, 84) = 128.62, p < .001,
Consonants
Descriptive and Inferential Statistics for IPs of Consonants for EHA Users and ENH Individuals Presented Audiovisually and Auditorily (Moradi et al. 2014a).
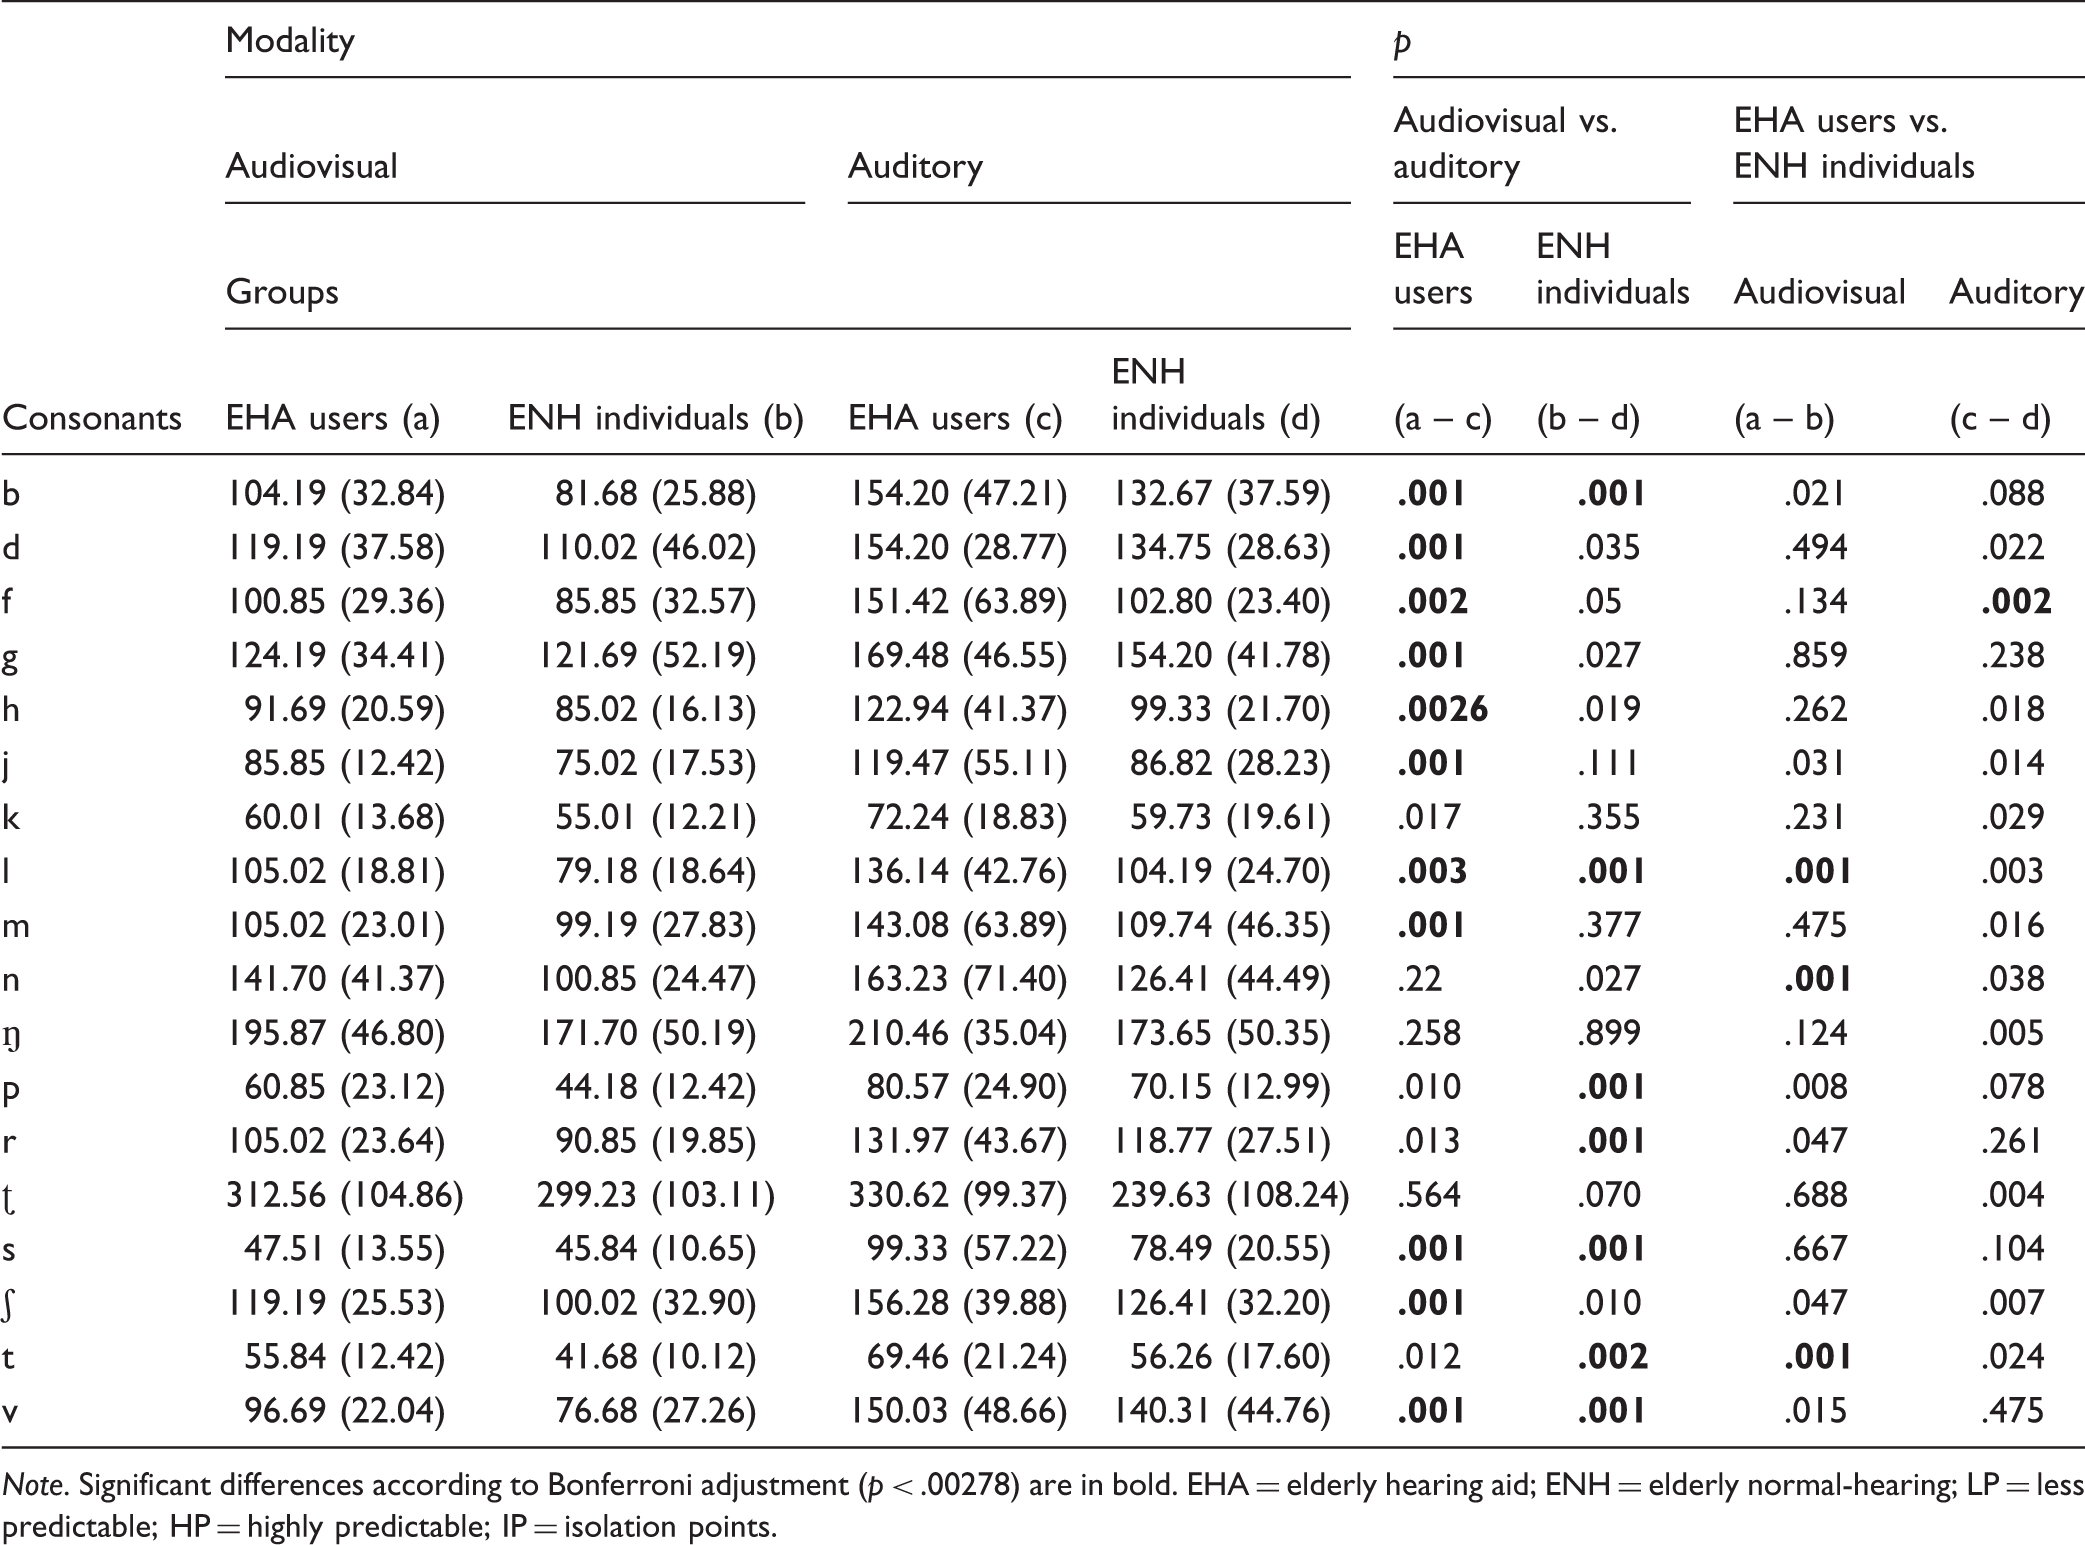
Note. Significant differences according to Bonferroni adjustment (p < .00278) are in bold. EHA = elderly hearing aid; ENH = elderly normal-hearing; LP = less predictable; HP = highly predictable; IP = isolation points.
Words
A 2 (Modality: audiovisual, auditory) × 2 (Aided hearing loss: EHA, ENH) ANOVA was conducted to examine the effects of modality and aided hearing loss on the mean IPs for Swedish monosyllabic words (Table 4). The results showed a main effect of modality, F(1, 84) = 184.77, p < .001,
Final words in sentences
A 2 (Modality: audiovisual, auditory) × 2 (Aided hearing loss: EHA, ENH) × 2 (Sentence predictability: high, low) mixed ANOVA with repeated measures on the third factor was computed to examine the effects of modality and aided hearing loss on the mean IPs for final words in sentences (Table 4). The results showed that the main effect of modality was not significant, F(1, 84) = 2.51, p = .117. However, the main effect of aided hearing loss, F(1, 84) = 9.07, p = .003,
Discussion
The goals of the current study were (a) to compare the IPs and accuracies of different types of audiovisual speech stimuli (consonants, words, and final words in LP and HP sentences) between EHA users and ENH individuals and (b) to compare audiovisual IPs for different types of speech stimuli from the present study with auditory IPs for those speech stimuli extracted from Moradi et al. (2014a).
Main Findings
The results reveal that the EHA group needed longer IPs than the ENH group for the audiovisual identification of speech stimuli in the absence of a prior semantic context. In terms of accuracy, the two groups reached ceiling, and there was no difference between the two groups in the audiovisual identification of different types of speech stimuli. The addition of visual cues to auditory speech stimuli (when comparing audiovisual IPs with auditory IPs) shortened the IPs for consonants, words, and final words in LP sentences in the EHA group. In the ENH group, the addition of visual cues only shortened IPs for consonants and words.
Consonants
In the present study, the EHA users needed longer IPs than the ENH individuals for the identification of Swedish consonants (113 vs. 98 ms), while there was no difference in terms of accuracy between the two groups. The correspondence between the visual and auditory components of consonants is not one-to-one as some consonants look the same during visual articulation, such as /b p m/, /v f/, /k g/ /r l/, and /d t s/. While visual cues provide information about the place of articulation, auditory cues provide information about the manner of articulation. Visual cues are almost always available earlier than auditory cues during the audiovisual articulation of speech stimuli (Chandrasekaran, Trubanova, Stillittano, Caplier, & Ghazanfar, 2009; Smeele, 1994). According to the predictive coding hypothesis (Friston & Kiebel, 2009; see also the on-line prediction hypothesis, van Wassenhove, Grant, & Poeppel, 2005), initial visual articulation activates some phonological representations (predictions or residual errors) in the brain regarding the identity of a given audiovisual phoneme that is matched with earlier visual cues. These predictions are constantly updated as more visual and auditory inputs are received; this decreases the number of predictive phonological representations (and/or residual errors) until a phonological representation is left that matches with the incoming visual and auditory cues.
As mentioned earlier, the clarity of the audio component of the audiovisual speech signal is crucial to the audiovisual identification of speech stimuli (Baart et al., 2014; Corthals et al., 1997). As the EHA users had inferior performance compared with the ENH group in the auditory coding of consonants (see Moradi et al. 2014a), we assume that the hearing-impaired individuals, even with their own hearing aids, suffered from poor auditory coding also during the audiovisual presentation of consonants. As a consequence, they had larger residual errors than the ENH group that required extended gated presentation of consonants (as indicated by delayed IPs) to view a coherent audiovisual speech signal for recognition. For instance, the EHA users are likely to have needed more gated presentations than the ENH individuals to discriminate between /t k/ or /l r/ (see Table 6 for comparison of audiovisual IPs in EHA and ENH groups). In addition, we suggest that the initial visual presentation of some consonants, such as /t/, likely activated more phonological candidates in the EHA users than the ENH individuals, which necessitated more gated presentations for correct identification. However, there was no difference between the two groups in terms of accuracy for the audiovisual identification of consonants. This finding suggests that although EHA users needed longer IPs for consonants, they were eventually able to correctly recognize consonants, at the same level as their age-matched counterparts with normal hearing.
When comparing audiovisual to auditory presentation, the results indicate that audiovisual presentation speeds up the identification of consonants relative to auditory-only presentation, regardless of whether an individual has hearing loss. However, the addition of visual cues to the auditory speech signal (representing a complementary effect) benefited the EHA group more than the ENH group. As shown in Table 6, audiovisual presentation (compared with auditory-only presentation) significantly shortened the IPs for seven voiced (/b, d, g, j, l, m, v/) and four fricative (/f, h, s, ʃ/) consonant types in the EHA group, while in the ENH group audiovisual presentation shortened the IPs for five voiced (/b, l, p, r, v/), one fricative (/s/), and one plosive (/t/) consonant type. There was less benefit from the combination of video and audio (representing a redundancy effect) for 7 consonants in EHA group and 11 consonants in the ENH group in the silent condition. This finding is in line with the notion that the benefits of audiovisual presentation over auditory presentation are greatest under degraded listening conditions, such as noise (see Moradi et al., 2013) or hearing loss (see Sheffield, Schuchman, & Bernstein, 2015), when access to critical auditory cues for the identification of consonants is impoverished by background noise or a reduction in auditory acuity due to hearing loss. The addition of visual cues to a degraded auditory signal is a major source of disambiguation, as it provides complementary cues about the place of articulation (Summerfield, 1987) and indicates where and when to expect the onset and offset of a given consonant (see Best, Ozmeral, & Shinn-Cunningham, 2007).
Overall, our findings corroborate those of prior studies by showing that the audiovisual compared with auditory-only presentation of consonants improves performance in people with hearing loss in both aided and unaided conditions (Grant, Walden, & Seitz, 1998; Tye-Murray, Sommers, & Spehar, 2007a; Walden et al., 2001; Walden, Prosek, & Worthington, 1975) and in people with normal hearing (Sommers, Tye-Murray, & Spehar, 2005). Further, the greatest benefit of the audiovisual over auditory presentation of consonants in the EHA group was at the accuracy level, since accuracy improved to the same level as the ENH group.
Words
The results of the present study show that EHA users needed longer IPs relative to ENH individuals for the identification of Swedish monosyllabic words (449 vs. 407 ms), while the participants in both groups achieved ceiling levels in terms of accuracy. Word recognition occurs when the incoming speech signal maps with a lexical representation in the mental lexicon (Lively, Pisoni, & Goldinger, 1994). According to the cohort model of word recognition (Marslen-Wilson, 1993; Marslen-Wilson & Welsh, 1978), the initial presentation of a given speech signal activates particular lexical candidates in the mental lexicon. As more of the speech signal is acquired, the number of activated lexical candidates is decreased, until one lexical candidate remains that matches with the incoming speech signal. The number of activated lexical candidates is greatly dependent on lexical frequency and phonological neighborhood density (Dufor & Frauendelder, 2010; Luce & Pisoni, 1998), and modality presentation (i.e., auditory, visual, or audiovisual; see Tye-Murray, Sommers, & Spehar, 2007b). In addition, the presentation of words under degraded listening conditions (background noise or hearing loss) results in longer IPs for the identification of stimuli presented in either auditory or audiovisual modalities (Moradi et al., 2013; Moradi, Lidestam, Hällgren, et al., 2014, Moradi, Lidestam, Saremi, et al., 2014). This is most likely due to difficulty in moving from one lexical candidate to the target lexical item (see Singer, Bronstein, & Miles, 1981).
As noted earlier, the words in our study had average-to-high frequencies, with a small-to-average number of neighbors (three to six alternative words with the same pronunciation of the first two phonemes). The longer IPs in the EHA group relative to the ENH group may be due to poor auditory coding of words during processing of the incoming audiovisual speech signal, which activates a greater number of similar phonological-lexical candidates, or leads to a persistent focus on a non-target lexical item during the gated presentation of words in the EHA group. As a consequence, the EHA group required more of the incoming audiovisual lexical signal (as indicated by IPs) to correctly map the audiovisual speech signal onto the target lexical item in the mental lexicon. The increase in the length of the incoming audiovisual lexical signal required by the EHA group (as indicated by IPs) eventually enabled the group to correctly map the incoming signals onto their corresponding lexical representation in the mental lexicon, which resulted in the same level of accuracy as the ENH group.
When comparing audiovisual to auditory presentation, the results of our study suggest that audiovisual presentation significantly speeds up the identification of consonants compared with auditory-only presentation. In fact, the addition of visual cues to a poor auditory lexical signal may facilitate the lexical access by amplifying bottom-up processing (viewing the initial articulation of the lexical signal to discriminate stimuli, e.g., /bar/ and /far/) and by reducing the number of phonological-lexical candidates as a result of the overlap of words presented visually and aurally as opposed to aurally only (see Tye-Murray, Sommers, & Spehar, 2007b). As a consequence, the accurate mapping of lexical signals with corresponding lexical representations in the mental lexicon is less difficult in an audiovisual relative to an auditory-only modality, and this resulted in shortened IPs in the audiovisual relative to the auditory modality in both the EHA and ENH groups. This finding is in agreement with prior studies showing that the addition of visual cues to auditory lexical signals expedites lexical access in correctly identifying words (see de la Vaux & Massaro, 2004; Moradi et al., 2013).
Final words in sentences
The results of the present study revealed no difference between the EHA group and the ENH group in the identification of final words in sentences, in either LP or HP sentences, both in terms of IPs and accuracy.
Prior semantic context facilitates the identification of target words embedded in congruent sentences compared with the presentation of words alone, particularly under degraded listening conditions (Boothroyd & Nittrouer, 1988; Grant & Seitz, 2000; Salasoo & Pisoni, 1985). Prior semantic context activates only lexical candidate(s) in the mental lexicon that are congruent with the meaning of a given sentence, which facilitates the identification of final words in sentences. The facilitative effect of semantic context greatly depends on the degree of predictability provided by the prior semantic context (see Bradlow & Alexander, 2007; Molis et al., 2015; Moradi, Lidestam, Hällgren, et al., 2014, Moradi, Lidestam, Saremi, et al., 2014). A highly predictable sentence may activate only one lexical candidate (i.e., “a pigeon is a kind of bird”), whereas a sentence with less predictability will activate a set of lexical candidates that are compatible with the meaning of the sentence (i.e., “bird” in “she pointed at the xxxx”). In young normal-hearing listeners, the addition of visual cues to semantic context resulted in faster and more accurate identification of speech stimuli than auditory-alone presentation of sentences, particularly under degraded listening conditions (Moradi et al., 2013; Van Engen, Phelps, Smiljanic, & Chandrasekaran, 2014).
Moradi et al. (2014a) reported that EHA users needed longer IPs than ENH individuals for the auditory identification of target words in LP sentences, but there was no difference between the two groups in terms of accuracy for LP sentences. The results of the present study indicate that the EHA group additionally benefited from the combination of prior context and visual cues, helping the individuals in this group to disambiguate the target words in the LP sentences, resulting in the same level of performance between the EHA and ENH groups both in terms of IPs and accuracy. The explanation for the non-significant differences in final words is that prior semantic context restricts the number of activated lexical candidates in the mental lexicon and visual cues by discriminating the initial phonemes of target words in sentences (e.g., “bet” vs. “pet”), and by reducing the number of phonological neighbors as a result of the overlap of auditory and visual speech cues (see Tye-Murray, Sommers, & Spehar, 2007b), making the identification of target words at the end of LP sentences less difficult for the EHA group. Jesse and Janse (2012) reported that the benefit obtained from adding visual cues to meaningful sentences in a phoneme-monitoring task was more evident in older listeners with hearing loss than in younger adults with normal hearing.
The effect of prior semantic context is stronger for final words in HP sentences than for final words in LP sentences. Moradi, Lidestam, Hällgren, et al. (2014) and Moradi, Lidestam, Saremi, et al. (2014) showed that listeners are able to correctly guess the identity of final words in HP sentences between the first and second gates for speech stimuli presented in an auditory modality. Visual information has little or no effect on the identification of final words in HP sentences compared with LP sentences because of the strength of the semantic context effects in HP sentences. This explains why the EHA and ENH groups performed similarly, in terms of both IP and accuracy, when identifying final words in HP sentences.
The present study findings (with the exception of EHA users’ results for the LP sentences task) indicated no beneficial effects for elderly people of adding visual cues to semantic context (as supported by EHA users’ results for the HP sentences task, and the ENH group’s results for both the LP and HP sentence tasks). This finding is not in agreement with prior studies on young normal-hearing persons, where it was reported that the presentation of both semantic context and visual cues improved the intelligibility of target words in meaningful sentences (Moradi et al., 2013; Van Engen et al., 2014). One explanation might be that older adults generally have a greater reliance on the semantic context than younger adults (see Rogers, Jacoby, & Sommers, 2012) and seemingly the benefit from congruent semantic context is greater in elderly people (see Pichora-Fuller, 2008; Rogers et al., 2012; Sheldon, Pichora-Fuller, & Schneider, 2008). Similarly, Sommers and Danielson (1999) reported that although older adults had greater difficulty than younger adults in identifying low-frequency words with similar phonological neighbors, the effect was eliminated when these words were embedded in a congruent semantic context. In fact, because of experiences accumulated over time, elderly people are more skilled than younger adults to benefit from semantic context, since they need to compensate for their sensory and cognitive decline in identification of target speech signal (see Aydelott, Leech, & Crinion, 2010; Frisina & Frisina, 1997; Pichora-Fuller, Schneider, & Daneman, 1995). We argue that because of the greater benefit from semantic context in elderly people (compared with young normal-hearing listeners), lexical candidates that are not matched to prior sentential context will quickly be dropped, and no further aid can be attained from visual cues. However, the additive effect of visual cues and semantic context was observable in LP sentences for the EHA group only and not for the ENH group. Thus, it can be argued that the additive effect of visual cues and semantic context was evident under degraded listening conditions (i.e., noise or hearing loss) in the current study, whereby visual cues in combination with semantic context facilitated the identification of target words at the end of sentences.
The interplay between semantic context and visual cues in the identification of embedded words in sentences needs further research. We suggest that the interactive effects of visual cues and semantic context greatly depend on the sentence level of predictability, the population of listeners being assessed (e.g., young vs. elderly people), and the listening conditions (e.g., clear vs. degraded). For instance, the predictability of sentences is a key factor, as when predictability is highest (e.g., final words in HP sentences), there would be less or even no benefit from the addition of visual cues to speech stimuli. However, when the sentence predictability level is decreased (e.g., final words in LP sentences), visual cues can be extremely beneficial, and, when combined with semantic context, they can facilitate target word identification in sentences. Furthermore, the addition of visual cues to semantic context is more evident under degraded listening conditions, particularly for elderly people (see Pichora-Fuller, 2008); the reduced clarity of semantic context (by noise or hearing loss) can highlight the contribution of visual cues in the disambiguation of a target signal.
Sensitivity of the Measures
Psycholinguistic research has demonstrated that the latency measures such as response time are more sensitive than accuracy because measurement for each item is continuous whereas accuracy is discrete (i.e., correct or not). For instance, response times were generally much shorter with use of hearing aids, whereas accuracy was not affected nearly as much (Gatehouse & Gordon, 1990). Adverse listening conditions (e.g., background noise) affected intelligibility of speech tasks in Houben, van Doorn-Bierman, and Dreschler (2013) and in Huckvale and Leak (2009). Phonemes could be better categorized based on response times than on accuracy (Pisoni & Tash, 1974). Similarly, IP (by measuring the shortest time required for identification of a speech stimulus from the onset of a speech signal) is another latent measure that provides a great range of responses even in optimum listening conditions, unlike performance accuracy that can reach ceiling levels (e.g., Moradi et al., 2013). The results of the present study demonstrated the sensitivity of IPs over accuracy in revealing differences between the EHA and ENH groups in the identification of speech stimuli. Although there was no difference between the two groups in terms of accuracy, as both groups performed at ceiling, EHA users needed longer audiovisual IPs for consonants and words. That is, the IP reflects that EHA users need a longer amount of signal than ENH individuals to map the sensory signal onto corresponding phonological and lexical representations. This can reflect the established sensory disadvantage at the phonological and lexical levels in aided hearing-impaired listeners than their counterparts with normal hearing (Ahlstrom, Horwitz, & Dubno, 2014; Dimitrijevic et al., 2004; Moradi, Lidestam, Hällgren, et al., 2014), even in audiovisual modality.
Limitations and Future Considerations
One limitation of the present study is that we compared ENH individuals with EHA users who wore their own hearing aids, with no changes in the settings of their hearing aids. It is probable that some signal processing (e.g., noise reduction algorithms) might have affected the performance of EHA users, particularly IPs when supportive semantic context was lacking. We suggest that future studies compare audiovisual performance under simple linear amplification conditions and when some signal processing is active during the experiment. This may elucidate the extent to which advanced signal processing positively or negatively influences IPs at phonemic and lexical levels.
The between-subject comparison of IPs in audiovisual and auditory modalities seems to be a second limitation of the present study, as individual differences across participants (between-group comparisons) for stimuli presented in auditory and audiovisual modalities may influence IPs to some extent. A within-subject experimental design may provide more robust interpretations by controlling for individual differences. Nevertheless, within-group comparison of audiovisual and auditory speech stimuli may have its own drawback, as for instance, early exposure to multisensory stimuli subsequently boost unisensory processing of stimuli (for a review, see Shams, Wozny, Kim, & Seitz, 2011). In speech perception, evidence supporting this notion comes from our previous studies on young normal-hearing listeners (Lidestam et al., 2014; Moradi et al., 2013) showing that prior exposure to audiovisual speech stimuli subsequently facilitated the auditory performance of participants, whereas prior exposure to auditory speech stimuli did not. We hypothesize that if the present study had been a within-subject design and the modality of presentation had been randomized across participants (e.g., half of the participants started with gated auditory task and the other half with gated audiovisual task), those who had been tested first in the audiovisual modality subsequently would have had shorter IPs and improved accuracy in the auditory modality. This improvement in auditory IPs and accuracies (caused by perceptual doping) may create a Type II error by generating non-significant differences in comparing IPs of a given speech task between the audiovisual and auditory modalities (unless the sample size had been increased). We suggest that future studies should consider these limitations caused by between-subject and within-subject experimental designs when comparing audiovisual and auditory speech stimuli.
Conclusions
The addition of visual cues to an amplified speech signal in the EHA group resulted in the same level of performance in terms of accuracy as the ENH group. However, in terms of IPs, the EHA users had inferior performance than their age-matched counterparts with normal hearing when a supportive semantic context was lacking. In addition, audiovisual presentation greatly speeded up the identification of speech stimuli relative to auditory-only presentation in the absence of a semantic context, in both the EHA and ENH groups. Nevertheless, the effect of audiovisual presentation was more evident in the EHA group as the accompanying visual cues (see Moradi et al. 2014a) helped the EHA users to disambiguate the speech signal.
Footnotes
Acknowledgments
The authors thank Carl-Fredrik Neikter, Amin Saremi, and Niklas Rönnberg for their technical support; Mathias Hällgren and Helena Torlofson for their assistance during this study; and Katarina Marjanovic for speaking the recorded stimuli. The authors also thank Prof. Andrew Oxenham and two anonymous reviewers for their comments on this manuscript.
Declaration of Conflicting Interests
The authors declared no potential conflicts of interest with respect to the research, authorship, and/or publication of this article.
Funding
The authors disclosed receipt of the following financial support for the research, authorship, and/or publication of this article: This research was supported by a grant from the Swedish Research Council (349-2007-8654).