
Abstract
Background:
Orthopaedic surgeons treating skeletally immature patients with knee pathology rely on an accurate evaluation of skeletal age. Although the Greulich and Pyle atlas remains the gold standard for bone age estimation, it requires additional hand imaging and radiation exposure for patients who already have readily available knee imaging.
Purpose:
To develop a deep learning (DL) model for bone age estimation based on knee radiographs.
Study Design:
Cohort study (diagnosis); Level of evidence, 3
Methods:
This was an institutional review board-approved study. A total of 2374 cropped knee images—80% for training and 20% for a test set—from patients aged ≤18 years at an orthopaedic specialty hospital with paired hand films obtained within 3 months of knee imaging were used. Patients with previous physeal trauma about the knee, genetic disorders including skeletal dysplasias and endocrinopathies affecting maturation, were excluded. A ConvNeXT model was trained on sex, skeletal age, and chronological age as input values using 5-fold validation. Model performance was evaluated using mean absolute error (MAE) and gradient-based saliency maps to assess model interpretability.
Results:
The model achieved an MAE of 5.02 months relative to the assigned ground-truth bone ages, nearly half that of the abbreviated Fels method (9.59 months). An even lower MAE of 3.43 months was observed relative to the pretrained pseudo-labels generated by a hand DL model used to annotate the training set. Bland-Altman analysis revealed near-zero bias, indicating close agreement between predicted and ground truth bone age. This model outperformed both prior simple and artificial intelligence-based skeletal maturity estimation tools of the knee.
Conclusion:
This highly accurate DL model for knee skeletal maturity estimation demonstrates that automated bone age estimation from routine knee radiographs is feasible. We anticipate that this model can serve as a valuable diagnostic assistant for orthopaedic surgeons and radiologists evaluating skeletally immature patients and help to augment their clinical decision-making. External validation and model refinement are important for adoption into everyday practice.
Skeletal (or bone) age for skeletally immature patients dictates appropriate surgical management for many orthopaedic surgeons treating children. In pediatric sports medicine, the decision to perform physeal-sparing anterior cruciate ligament (ACL) reconstruction, medial patellofemoral ligament reconstruction, or growth modulation is usually based on bone age determination using the Greulich and Pyle (GP) atlas from hand radiographs.6,13 However, this method is time-consuming,4,12 prompting development of other simpler shorthand bone age estimation tools of the hand, albeit with lower accuracy. 16 A variety of skeletal estimation methods have been developed based on knee imaging with variable reliability and clinical applicability.1,29 These various tools additionally lack the accuracy and precision observed with the GP bone age due to fewer evaluable radiographic markers (ie, physes and apophyses) compared with the hand. 11
Artificial intelligence (AI) and machine learning (ML) are already valuable tools in orthopaedic surgery. They have gained mainstream use for answering patient questions, as clinical decision support tools, and for implant recognition.5,25,26,38 While useful for a broad range of orthopaedic conditions, in patients with knee pathology, hand-based ML models still require additional radiation exposure and health care expenditure. Numerous models have been generated for hand bone age determination.15,30 However, few studies have applied ML to knee radiographs, and none have utilized newer transformer-inspired models or transfer learning. 8 Additionally, these previous knee-based ML skeletal maturity staging models have demonstrated low accuracy and largely evaluated patients at or beyond skeletal maturity (>14 years for females, >16 years for males) given their primary use for estimation of age in the forensics literature.
Therefore, this study sought to develop a highly reliable deep learning (DL) model to determine skeletal age based on routinely available knee radiographs. This would have the potential to eliminate the requirement for hand radiographs in planning surgeries about the knee in skeletally immature patients while dramatically reducing the time required for skeletal age determination. We hypothesized that a DL model can reliably determine skeletal age from knee radiographs as accurately as from gold standard hand imaging.
Methods
Patient Population
All patients ≤18 years of age treated at our institution between January 2005 and April 2024 with both (1) hand bone age films and (2) anteroposterior (AP) and/or lateral (LAT) knee radiographs (including hip-to-ankle standing alignment films) within 3 months of the hand imaging were identified. Patients with a prior physeal injury about the knee, genetic disorders, skeletal dysplasias, endocrinopathies or other diseases affecting skeletal maturation, or retained hardware preventing evaluation of the physis were excluded through manual chart review. Additionally, for patients with bilateral imaging and unilateral growth anomalies (eg, neonatal osteomyelitis), only the contralateral healthy knee was used.
Data Preprocessing and Model Development/Training
The original data set comprised various types of radiographic images—including AP/LAT views and hip-to-ankle images (Figure 1). To eliminate irrelevant portions of the images and only focus on the knee, a preprocessing stage was used. A total of 1500 films were selected, with annotations restricted to cases where the knees were fully visible, in line with previous ML bone age studies (Figure 2).8,36,42 In cases where both knees were visible in the image, the one without pathology was selected. If both knees were clearly visible and unaffected, both were included. Next, the YOLOv8 model 18 was used to train an object detection model on the 1500 annotated images, split into 1200 for training and 300 for validation. The model was trained for 120 epochs, achieving a mean average precision (mAP50) of 0.994 and an mAP50-95 of 0.873 on the validation set (Figure 3). Then, we used a histogram equalization technique to improve image contrast. The entire preprocessing step is presented in Figure 4.

Demonstration of radiographs available in the included data sets.

Radiographs with annotated bounding boxes. Some images feature both knees, requiring 2 bounding boxes, while other images, like the one shown in the bottom middle, do not contain any knees.

Cropped images generated by the object detector model for the validation set.

Preprocessing pipeline. First, the knee is extracted from the raw radiograph, and its contrast is improved using histogram equalization.
After inclusion of 1 or both knees from the 1500 films, the final data set comprised 2734 cropped knee images with corresponding hand images, along with information on chronological age and sex. The data set was divided into 2 subsets: a training set and a test set, with a ratio of 80% and 20%, respectively. Some patients had multiple knee images due to the presence of left/right or AP/LAT views. To prevent data leakage, each patient's images were assigned to only 1 subset. We used the model from our previous work to predict bone age from hand radiographs and assign a ground-truth bone age to each knee image. 3 This was based on the patient's corresponding hand radiograph as well as sex and chronological age (Figure 5). However, these pseudo-labels were used exclusively for the training set, while the ground-truth labels for the test set were assigned by a chief orthopaedic surgery resident (J.T.B.) using the GP atlas. 13 Bone age was also separately determined on the test set using the abbreviated Fels method to compare our model's performance with a commonly-used bone age estimation tool based on knee films. 41 The abbreviated Fels is an adaptation of the modified Fels (7 discrete radiographic parameters) that utilizes segmented linear modeling and computerized adaptive testing principles to identify a smaller number of parameters (2-3 discrete radiographic parameters) that allows for faster estimation of bone age.

Knee bone age model development, incorporating estimated bone age from hand radiographs using a previously developed hand bone age model.
Given the limited size of the training set, 5-fold cross-validation was employed. The training set was split into 5 parts, with 1 part used as a validation set and the remaining 4 used for training, ensuring that each patient's images appeared in only 1 set. This process resulted in training 5 models with the same architecture but different training subsets. This ensemble approach enabled the incorporation of uncertainty estimates based on the variability of model predictions across folds. Additionally, it improved the model's performance because the final predictions are the aggregate of 5 models.
The ConvNeXt architecture was employed as the vision encoder. 24 Knee radiographs were processed through the ConvNeXt model to extract image-specific features, which were then combined with sex and chronological age representing features. This unified representation was subsequently passed through a fully connected layer to predict bone age (see Figure 6). Using the mean absolute error (MAE) loss function, the model was trained for 100 epochs. To improve performance and generalization, data augmentation methods, similar to those employed by Rassmann et al, 30 were applied. The bone age predictions were then averaged and reported.

Knee model architecture. Knee radiographs were passed through the ConvNeXt model to extract image-specific features. These features were then combined with chronological age and sex-representing features and passed through a fully connected layer to estimate bone age.
Model Evaluation/Interpretability
To evaluate the performance of the model, 2 metrics were used: MAE and root mean squared error (RMSE). To understand which parts of the input most influenced the model's outputs, 2 common techniques were employed: gradient-based saliency maps 35 and perturbation-based occlusion analysis. 43 These techniques highlight the key regions that drive the model's predictions.
Statistical Analysis
In ML, models are trained to make predictions based on the available data. However, the models are not always certain about their predictions. This quantifiable uncertainty is critical in medical applications. The use of 5-fold models enabled uncertainty assessment for each image. Each model predicted bone age, and the mean and sample standard deviation were also calculated. This model's prediction was reported as the mean ± standard deviation, with the standard deviation indicating uncertainty. Higher values reflected greater variability and less confidence in the model's estimate. To incorporate confidence intervals into the evaluation metrics, a bootstrapping approach was employed. 10 The test set was repeatedly resampled 3000 times, and each iteration involved computing the evaluation metric. Using the percentile method, 9 the upper and lower bounds of the intervals were subsequently derived.
Results
Table 1 provides an overview of patient characteristics—including the distribution of male and female patients, chronological age (mean ± SD), and the number of AP and LAT images. Each ensemble of 5 individual models was trained on NVIDIA A40 GPUs, and test set evaluation metrics were calculated. Table 2 provides a detailed comparison of the model's performance using ground-truth labels versus the labels generated by the pretrained hand model (used for the training set) and the estimates from the abbreviated Fels. As presented in Table 2, the MAE for both conditions (ground-truth and pseudo-labels) remained <6 months. Furthermore, the lower error observed when using pseudo-labels can be attributed to the fact that these labels were generated by the same model used to annotate the training set, resulting in a more consistent distribution between the training and evaluation data. Compared with the abbreviated Fels estimation, the model had lower MAE (5.02 [95% CI, 4.46-5.61] vs 9.59 months [95% CI, 8.71-10.48]) and RMSE (6.81 [95% CI, 5.84-7.98] vs 12.01 [95% CI, 10.95-13.12]) relative to the ground-truth bone age. This was largely due to decreased Fels performance for ages at or above skeletal maturity.
Summary of Patient Characteristics and Imaging Data a
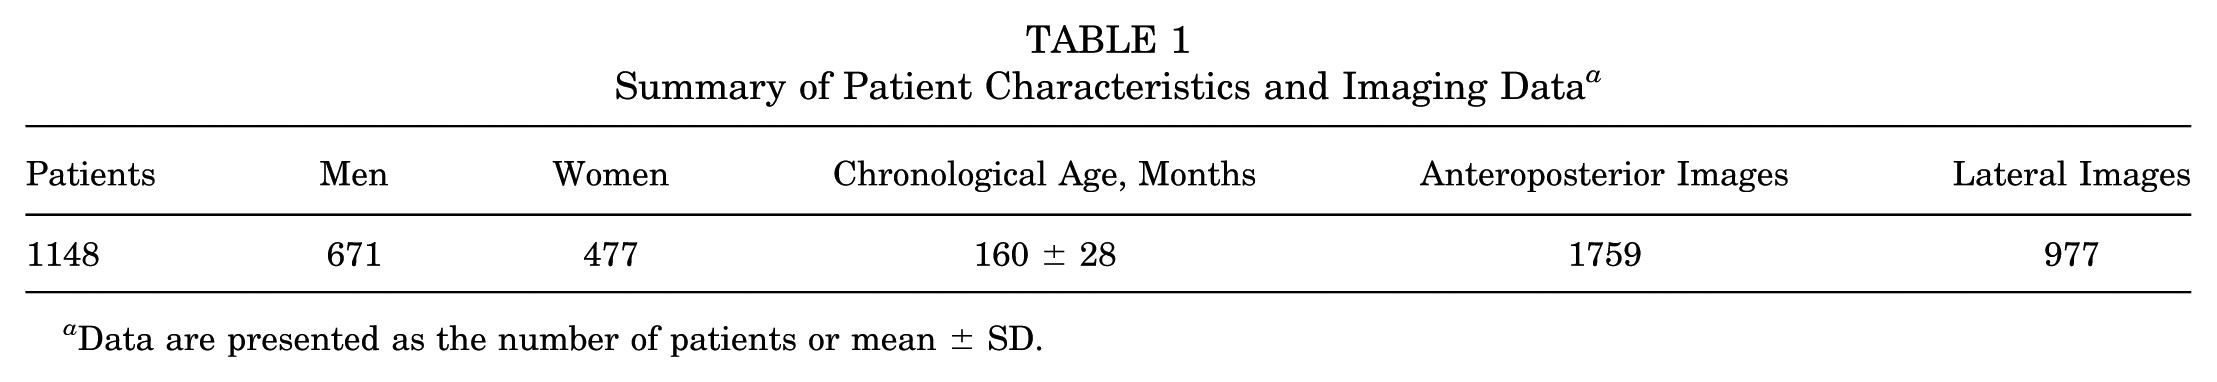
Data are presented as the number of patients or mean ± SD.
Evaluation of Model Performance on the Test Data Using Ground-Truth Annotations, Pseudo-Labeled Data, and Estimates Derived From the Abbreviated Fels Method a

MAE, mean absolute error. RMSE, root mean squared error.
Figure 7 presents scatter plots that compare the model's predictions with the actual values in the test set. These visualizations highlight deviations between the predicted and true values, providing a clear assessment of the model's accuracy and reliability. Figure 8 demonstrates a Bland-Altman plot with near-zero bias, indicating close alignment between predictions and ground truth. Interpretability analysis (Figure 9) reveals that the model focused on the physes and apophysis of the knee. Figure 10 illustrates the model's uncertainty for a patient with AP and LAT radiographs. Overall, the uncertainty values for cases in the test set range from 0.27 (the lowest) to 5.32 (the highest).

Scatter plots showing the model's performance on the test set using the ground-truth labels.

Bland-Altman plot. It illustrates the agreement between ground-truth labels and predictions. The center dashed line shows the mean difference (bias), and the units on both the x- and y-axes are in months. The top and bottom dashed lines denote 95% CIs (1.96 SD above and below the mean difference).

Interpretability plots. On the right, the interpretability plots for a lateral knee image are displayed, while the left side shows the plots for an AP knee image. The heatmaps emphasize the regions of each image that highly affect the model in predicting bone age, with brighter areas indicating stronger contributions to the prediction. AP, anteroposterior; LAT, lateral.

Each image is processed individually by each model fold. The results from these images are then averaged to obtain the final output for each fold model. From these models’ outputs, the sample standard deviations are computed, which provide a measure of uncertainty.
Building upon the method proposed by Leibig et al 23 with slight modifications, the model's uncertainty was quantified as σpred—the sample standard deviation of predictions produced by different folds of the model—and corresponding analyses were conducted (Figure 11). As shown, when the models include more uncertain samples, the MAE increases.

(A) The image displays the relationship between MAE and uncertainty, illustrating that as the model tolerates more uncertainty, that is includes samples with higher uncertainty, the error increases. (B) The image illustrates the relationship between the fraction of retained data and MAE. The blue line shows the MAE when data are kept based on uncertainty, whereas the red line shows the MAE for data selected at random. For instance, in the case of the blue line, keeping 80% of the data corresponds to excluding the 20% with the highest uncertainty, whereas the red line reflects selecting 80% of the data randomly. Overall, the blue line tends to have lower MAE values than the red line, suggesting that removing data informed by uncertainty results in lower error compared with random data removal. MAE, mean absolute error.
Discussion
This study reports the successful development of a state-of-the-art DL model to determine bone age from routinely available knee imaging, achieving accuracy and precision comparable to those of expert orthopaedic surgeons. By using chronological age and sex with both AP and lateral radiographs, this model broadens the scope of AI capabilities for skeletal maturity estimation and offers a promising clinical tool for pediatric orthopaedic surgeons treating knee pathologies. The collective impact of this model is substantial, setting a new standard for pediatric bone age assessment for knee surgeons that can aid in the reliable assessment of bone age to guide appropriate intervention for common orthopaedic conditions. Additionally, this tool may decrease health care expenditure by reducing extra imaging 17 and the time spent on radiologist evaluation, as well as eliminating extra radiation (albeit small, it is not absent 28 ) associated with additional hand radiographs. Ultimately, this novel tool will help deliver more personalized and effective treatment strategies for young patients with knee injuries. 34
Historical gold standard skeletal maturity estimation is based on the GP atlas, which was developed 13 from a longitudinal series of children from Cleveland, Ohio, in the 1930s and 1940s. Extrapolation to the knee by Pyle and Hoerr (PH) utilized the same cohort of patients and was based on the 3 physes/epiphyses (distal femur, proximal tibia, and proximal fibula) and apophysis (tibial tubercle) of the knee. 27 Both schemas use qualitative descriptions and subjective visual comparison to representative radiographs. While highly reliable among raters, 33 the PH atlas may overestimate bone age compared with the GP atlas. 14
Other knee-based skeletal maturity rating systems rely on more methodical, quantitative evaluation of knee radiographs. Based on the original Roche-Wainer-Thissen method from the Fels longitudinal study,21,31 these incorporate discrete radiographic parameters on AP radiographs.1,41 Interrater reliability for individual parameters in these systems is variable, ranging from moderate to excellent, and estimating the modified Fels still takes 1 to 2 minutes per individual. Additionally, these do not include lateral imaging, failing to utilize the consistent ossification pattern of the tibial tubercle apophysis. 7 More rapid evaluation tools—such as the preadolescent Fels (epiphyseal-metaphyseal ratio) 2 and central peak value 19 are less accurate than the GP atlas, and the preadolescent Fels may be less useful in specific instances including fibular hemimelia. Our study demonstrated nearly 2-fold improved accuracy compared with the abbreviated Fels bone age estimation tool, which is an adaptive algorithm that requires only 2 to 3 parameters to develop bone age. 41
The above limitations of other knee bone age tools make ML-based estimation attractive. Automated bone age estimation has been reported for nearly 10 years. The Radiological Society of North America conducted an ML channel in 2017 to estimate skeletal age from hand radiographs. 20 Skeletal age was determined for >12,000 hand films with 6 paired radiology reads. The winning model built a convolutional neural network (CNN) that achieved an MAE of 4.2 months on the test set relative to the ground truth estimation.
Despite many hand-based models, 30 few other studies have successfully applied ML to bone age estimation using knee radiographs. Demircioğlu et al 8 used the ResNet-34 classic CNN architecture to build a DL model in a cohort of largely skeletally mature patients with the primary goal of application to forensics settings. They reported an MAE of 10.3 months, well below the standards of hand-based imaging models and the previously described non-AI knee tools. By leveraging a transformer-inspired CNN, our model achieved an MAE of 5.02 months compared with the manually assigned ground-truth bone age and 3.43 months compared with the pseudo-labels generated by the pretrained hand model, which are comparable with, or better than, traditional estimates based on the knee. This modern type of architecture allows the model to capture more global, complex morphological features to achieve precise predictions.
Limitations
Although these results are promising, there are limitations to the study. DL models can only be as good as the ground truth measurements on which they are trained. In the hand, Halabi et al 15 reported a mean difference from the true bone age of just under 3 months using the GP method, which provides representative images only at 1-year intervals, suggesting a maximum cap in any study using GP as the gold standard of 3 months. Our model used hand estimates generated by a previously published hand-based DL model for training, resulting in a higher MAE on the ground-truth estimates compared with those determined by the previous model. Despite this, the MAE remained excellent at <6 months. Also, the radiographs were obtained at a specialized orthopaedic hospital in the affluent American Northeast, which may limit model generalizability to other regions of the world with different demographic compositions. 22 Previous studies on stress application to DL models demonstrate that small transformations or alterations can lead to significant changes in bone age estimation.32,40 Additionally, while these models certainly improve accuracy and decrease variability, they may even generate reads based on nonradiographic inputs.37,39 Further development and validation of these models in external populations would corroborate their performance and ensure easier adoption in clinical settings. While radiographs with hardware that prevents evaluation of the physis or those that cause premature physeal closure (eg, epiphysiodesis screws) were excluded, the model can be used in the presence of other implants, such as suspensory implants, for patients with a previous ACL reconstruction. Also, although the inclusion of different types of knee imaging (ie, dedicated knee radiographs, hip-to-ankle radiographs) may have decreased model performance, this likely improves the model's overall generalizability. Lastly, most patients with available imaging were >10 years old, limiting the evaluation of model performance in the youngest group of patients.
Conclusion
Our highly accurate DL model for knee skeletal maturity estimation demonstrates that automated bone age estimation from routine knee radiographs is feasible. We anticipate that this model can serve as a valuable diagnostic assistant for orthopaedic surgeons and radiologists evaluating skeletally immature patients and augment their clinical decision-making. External validation and model refinement are important for adoption into everyday practice.
Footnotes
Final revision submitted January 16, 2026; accepted January 28, 2026.
The authors declared that they have no conflicts of interest in the authorship and publication of this contribution. AOSSM checks author disclosures against the Open Payments Database (OPD). AOSSM has not conducted an independent investigation on the OPD and disclaims any liability or responsibility relating thereto.
Ethical approval for this study was obtained from the Hospital for Special Surgery.