
Abstract
Background:
Surgeons treating skeletally immature patients use skeletal age to determine appropriate surgical strategies. Traditional bone age estimation methods utilizing hand radiographs are time-consuming.
Purpose:
To develop highly accurate/reliable deep learning (DL) models for determination of accurate skeletal age from hand radiographs.
Study Design:
Cohort Study.
Methods:
The authors utilized 3 publicly available hand radiograph data sets for model development/validation from (1) the Radiological Society of North America (RSNA), (2) the Radiological Hand Pose Estimation (RHPE) data set, and (3) the Digital Hand Atlas (DHA). All 3 data sets report corresponding sex and skeletal age. The RHPE and DHA also contain chronological age. After image preprocessing, a ConvNeXt model was trained first on the RSNA data set using sex/skeletal age as inputs using 5-fold cross-validation, with subsequent training on the RHPE with addition of chronological age. Final model validation was performed on the DHA and an institutional data set of 200 images.
Results:
The first model, trained on the RSNA, achieved a mean absolute error (MAE) of 3.68 months on the RSNA test set and 5.66 months on the DHA. This outperformed the 4.2 months achieved on the RSNA test set by the best model from previous work (12.4% improvement) and 3.9 months by the open-source software Deeplasia (5.6% improvement). After incorporation of chronological age from the RHPE in model 2, this error improved to an MAE of 4.65 months on the DHA, again surpassing the best previously published models (19.8% improvement).
Conclusion:
Leveraging newer DL technologies trained on >20,000 hand radiographs across 3 distinct, diverse data sets, this study developed a robust model for predicting bone age. Utilizing features extracted from an RSNA model, combined with chronological age inputs, this model outperforms previous state-of-the-art models when applied to validation data sets. These results indicate that the models provide a highly accurate/reliable platform for clinical use to improve confidence about appropriate surgical selection (eg, physeal-sparing procedures) and time savings for orthopaedic surgeons/radiologists evaluating skeletal age.
Clinical Relevance:
Development of an accurate DL model for determination of bone age from the hand reduces the time required for age estimation. Additionally, streamlined skeletal age estimation can aid practitioners in determining optimal treatment strategies and may be useful in research settings to decrease workload and improve reporting.
Orthopaedic surgeons treating skeletally immature patients rely on assessment of skeletal (bone) age to determine appropriate and safe surgical strategies. The gold standard method of skeletal maturity estimation is the Greulich and Pyle (GP) atlas based on hand radiographs. 11 Unfortunately, the variability of bone age estimates using the GP atlas from radiologist-determined consensus bone age (ie, ground truth) approaches 6 months. Additionally, this method is time-consuming (approximately 90 seconds to 2 minutes per assessment2,9), and there are concerns with the accuracy of the GP method when applied to modern-day pediatric populations owing to its development in a homogeneous cohort of patients. 12
These concerns have prompted the development of other shorthand methods for skeletal age determination, although these are limited by focus on 1 or 2 radiologic parameters for estimation. 14 As skeletal age in adolescent patients can greatly influence the determination of appropriate orthopaedic intervention (eg, anterior cruciate ligament reconstruction strategy and hemi-epiphysiodesis timing), more reliable, automated methods of determining skeletal age are needed.
Deep learning (DL), a branch of machine learning (ML), has been successfully applied to assist with the detection of common orthopaedic implants 18 as well as for bone age estimation of the hand. 19 In 2017, the Radiological Society of North America (RSNA) conducted an ML competition to create a model that could rapidly and accurately identify pediatric bone age. 13 They provided >14,000 bone age radiographs with patient sex as well as a weighted bone age estimate to all entrants. The winner of this competition utilized a convolutional neural network (CNN) in addition to patient sex to achieve a mean absolute difference from the radiologist-determined ground truth of 4.2 months on the RSNA test data. Several more recent models have approached or achieved similar accuracy thresholds.17,26
None of these previously published models have utilized newer DL technologies or included chronological age despite its obvious clinical utility. Therefore, this study sought to develop a highly accurate and reliable artificial intelligence model for the determination of skeletal age based on standard hand radiographs. We hypothesized that a state-of-the-art DL model could determine skeletal age from hand radiographs as accurately as orthopaedic surgeons or musculoskeletal radiologists.
Methods
Study Design and Data Sets
This retrospective study evaluated bone age using hand radiographs, utilizing 3 public (RSNA, Radiological Hand Pose Estimation [RHPE], and DHA) and 1 institutional (Hospital for Special Surgery) hand radiograph data set for model development and evaluation. The RSNA data set contains 12,611 training, 1425 validation, and 200 test hand radiographs from Stanford Medical Center and Children’s Hospital Colorado, including sex and weighted skeletal age estimates across 6 radiology reads (the clinical radiology report at each institution, 4 pediatric radiologists with 2 from each institution, and a second read by one of the pediatric radiologists 1 year after initial review). Thirty-five abnormal radiographs (partial hands, evidence of injury or disease, both hands, and incorrect posturing or finger positions) (Appendix Figures A1 and A2, available in the online version of this article) were excluded from the RSNA training/validation sets. The RHPE data set includes 5491 training, 713 validation, and 79 test hand radiographs. Each radiograph in the training and validation sets includes sex, skeletal age (3 radiologists), and chronological age. 5 The test set contains similar information, but excludes bone age, and therefore model performance was determined using the provided evaluation server. 6 Because the RHPE radiographs feature both hands, bounding boxes from Escobar et al 5 were used to crop only left hands. Additionally, 45 images were excluded from the RHPE training/validation sets using similar exclusion criteria. The Digital Hand Atlas (DHA) contains 1390 hand films, of which 1384 are labeled, from a diverse population (Caucasian, Asian, Black, and Hispanic), with corresponding sex, chronological age, and skeletal age (single radiologist). These radiographs were collected from 1997 to 2008. 9 Three of the 1384 images lacked the corresponding chronological ages, so they were removed during the evaluation of the model with chronological age.
Finally, our institutional data set, included as external validation, contains de-identified radiographs obtained in patients at the study institution. Estimated bone ages, extracted from the picture archiving and communication system (PACS) radiology reports, were used to match images to the RSNA test set based on sex and bone age within 6 months. A fellowship-trained attending sports surgeon, fellowship-trained attending pediatric radiologist, and chief orthopaedic surgery resident pursuing a pediatric orthopedics fellowship (A.P., J.T.B.) then independently determined corresponding bone ages for all institutional radiographs with consensus determined through discussion for any discrepancies.
Data Preprocessing and Model Development/Training
A preprocessing pipeline, partially based on the methodology by Iglovikov et al, 15 was applied to standardize and enhance radiographs, ensuring consistency across images (Figure 1). We then developed 2 models using the PyTorch Lightning framework 8 to predict skeletal age from hand radiographs. The primary distinction between the models is that the second model incorporates chronological age as an additional input.
Model 1: The first model was trained on the RSNA training and validation sets using 5-fold cross-validation, which provided 5 trained models for ensemble predictions with better generalizability and the ability to measure uncertainty. The model’s performance was evaluated on the RSNA test set, along with the RHPE test, DHA, and institutional data sets. The ConvNeXt architecture served as a vision encoder. 22 Input hand radiographs were processed by the ConvNeXt model to extract image-specific features, which were then concatenated with sex-related features. This combined representation was fed into a fully connected layer to predict bone age (Figure 2). The model was trained for 100 epochs with the mean absolute error (MAE) loss function. To achieve optimal performance, a variety of models were trained using different hyperparameter configurations, such as weight decay values from [0, 0.1, 0.01, 0.001, 0.0001], learning rates from [0.0001, 0.00005, 0.00001], dropout rates from [0, 0.1, 0.2]. The best-performing settings were then chosen for the final model. Data augmentation techniques, most similar to those used by Rassmann et al, 27 were used to enhance performance and generalization. The effect of preprocessing and augmentation techniques on model 1 is evaluated through an ablation study (later presented in the Results section).
Model 2: To improve the first model’s predictions, we chose to incorporate chronological age as an additional input feature in the second model—with similar overall architecture—given its utility in clinical settings. As the RSNA data set lacked chronological age data, the second model was trained solely on the RHPE data set using 5-fold cross-validation. Each fold’s vision encoder was initialized with weights from the corresponding fold of the previous stage, leveraging features from RSNA radiographs. Other initializations, hyperparameters, augmentation, and optimization were consistent with the first model. Figure 3 depicts the complete training and validation process for both models.
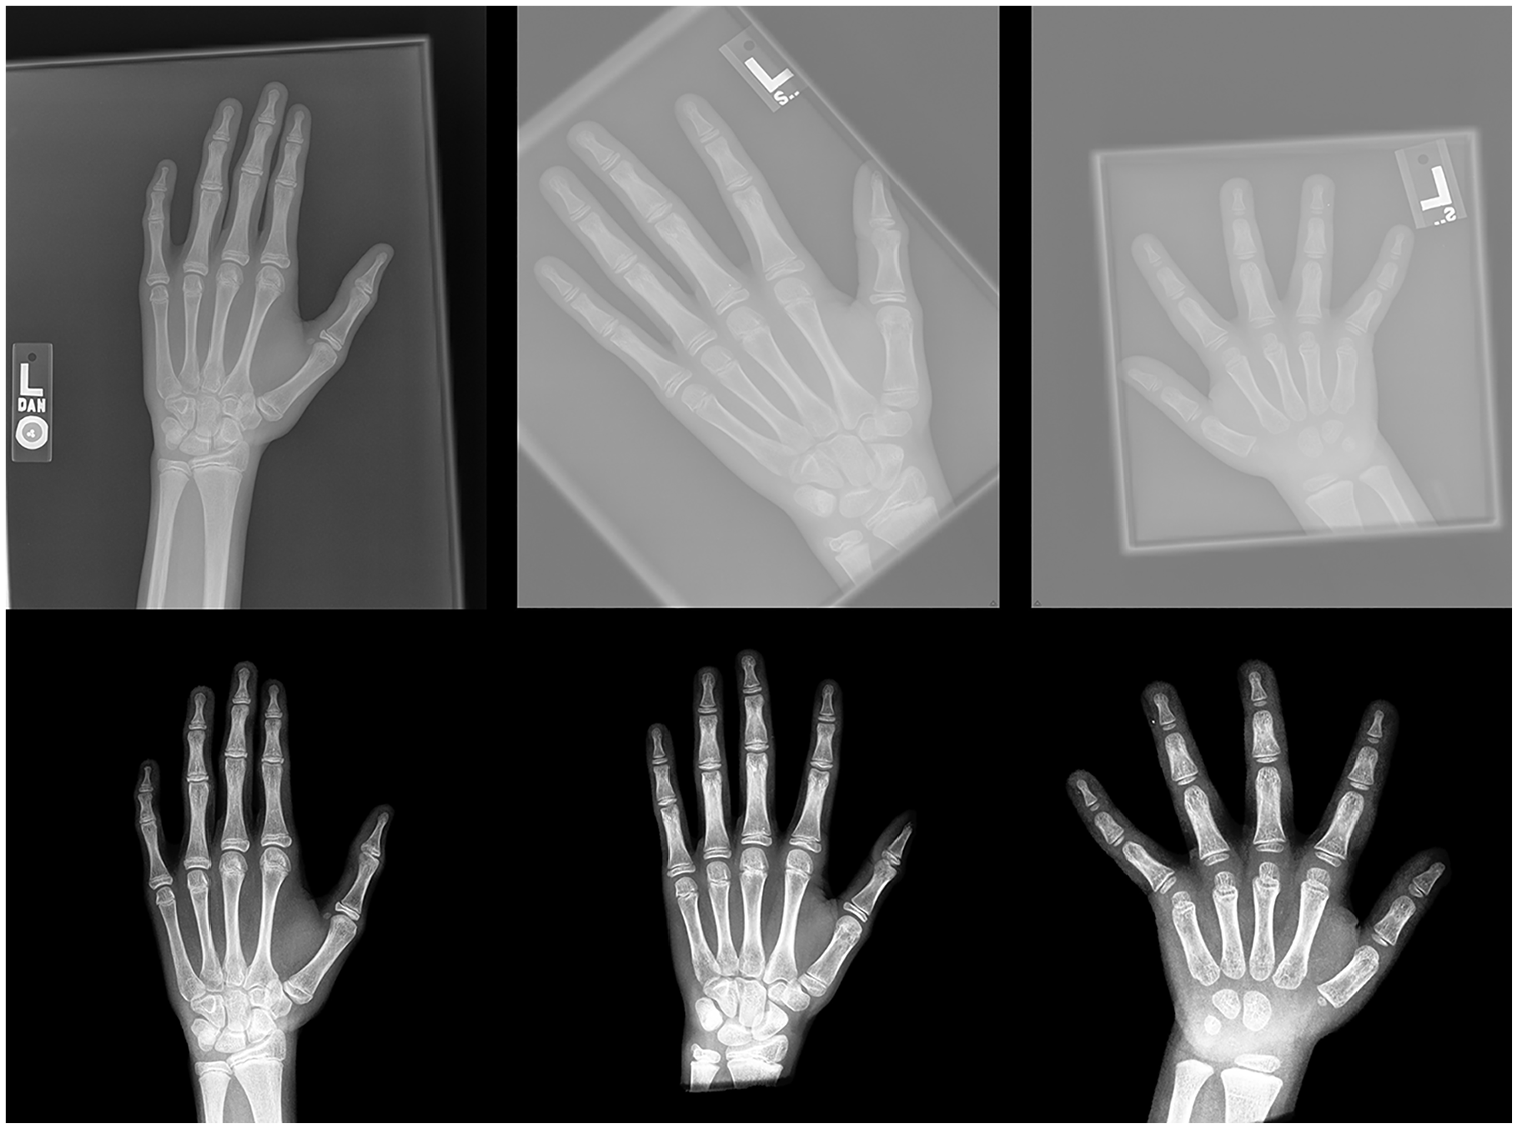
Representative raw and preprocessed images. Based on similar work by Iglovikov et al, 15 a preprocessing pipeline was developed to standardize and enhance radiographs, ensuring consistency across images. The images at the top display the raw versions, while the corresponding preprocessed versions are shown below.
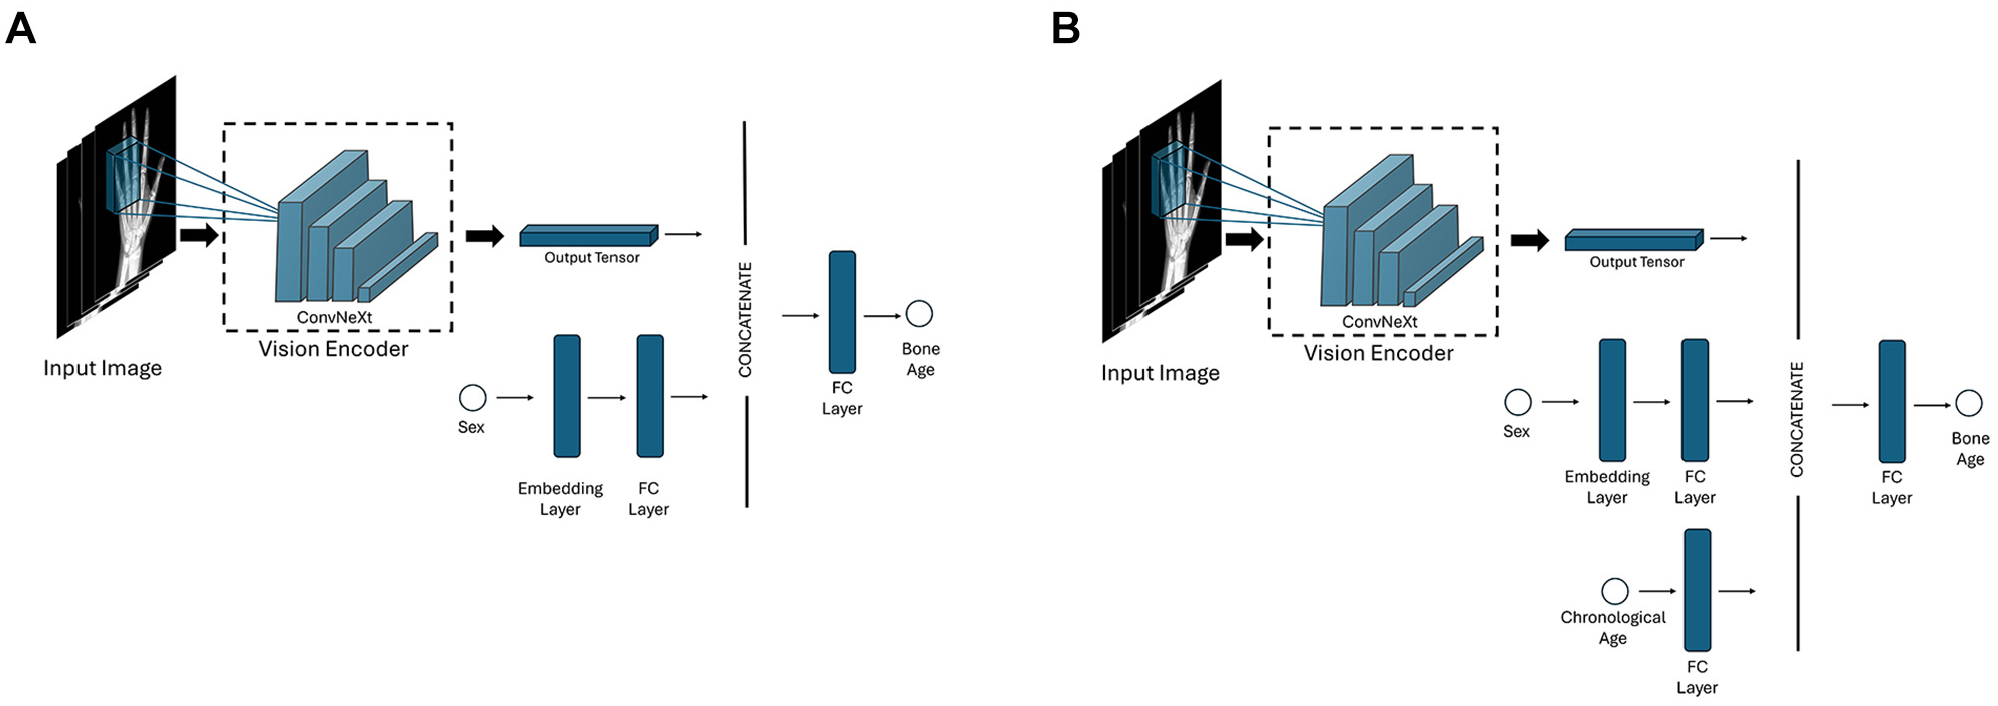
Schematics of the first and second model architectures. (A) First model architecture. (B) Second model architecture with incorporation of chronological age. FC, fully connected.
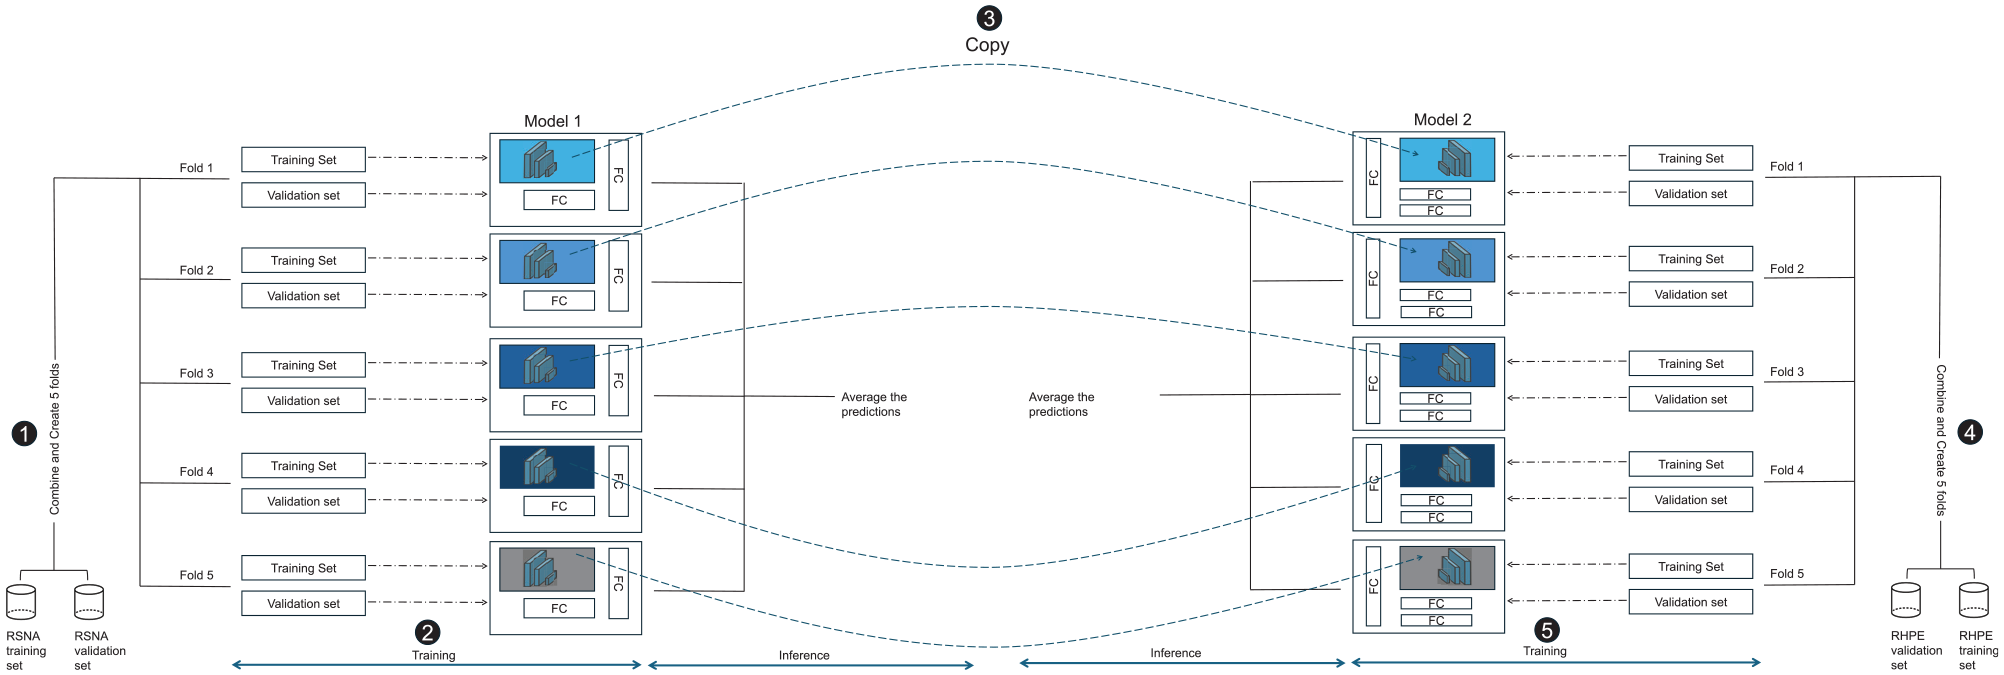
The process of training and validating the 2 models. (1) The folds are initially created from the Radiological Society of North America (RSNA) data set. (2) Next, 5 different models are trained, and the mean of their results is used as the final prediction value. (3) Through use of the vision encoder derived from the previous step, (4 and 5) the second model is trained on the Radiological Hand Pose Estimation (RHPE) data set using similar steps to 1 and 2, incorporating the chronological set. FC, fully connected.
Model Evaluation/Interpretability
Model performance was assessed using 2 metrics: MAE and root mean square error (RMSE). To explore model interpretability, we employed 2 common techniques: gradient-based saliency maps 30 and perturbation-based occlusion analysis. 32 While no gold standard exists for evaluating explanation fidelity, 25 these methods offer straightforward insights into image regions contributing to model predictions.
Statistical Analysis
ML models are not always certain about their predictions. This quantifiable uncertainty is critical in medical applications. The use of 5-fold models enables uncertainty assessment for each input image. Bone age is predicted by each model, and the mean and sample standard deviation are calculated. This model’s prediction is then represented as mean ± standard deviation, where standard deviation denotes the uncertainty.
Bootstrapping was used to add confidence intervals to evaluation metrics. 4 Each test set was resampled 3000 times: the evaluation metric was calculated, and the percentile method then allowed for determination of upper and lower bounds. 3 Bland-Altman comparisons were used to assess agreement between ground truth and predicted bone ages from models 1 and 2 for all the test sets. Scatterplots, by sex and age category, 33 were generated. Moreover, to investigate potential biases across different races and sexes, the error of model 1 was assessed within these categories using the DHA test set. The DHA set was specifically chosen because it is the only data set that provides detailed information on the different races.
Intraclass correlation coefficients (ICCs) were calculated for bone age on the institutional data set across the 3 raters using 2-way random-effects models and absolute agreement (reported as the single measure outcome). This demonstrated excellent interrater reliability (ICC, 0.986; 95% CI, 0.983-0.989; P < .001).
Results
The baseline characteristics of study patients are summarized in Table 1. Models 1 and 2, each an ensemble of 5 single models, were trained on NVIDIA A40 graphics processing units, and test set evaluation metrics were calculated. Table 2 presents the comprehensive results of both models. First, model 1’s MAE on the RSNA test set was 3.68 months, lower than all previously reported errors (Table 3). Inclusion of chronological age in model 2 improved performance evaluation metrics for the DHA, as MAE decreased from 5.66 months in model 1 to 4.65 months in model 2.
Split, Bone Age, and Sex in Different Hand Data Sets a
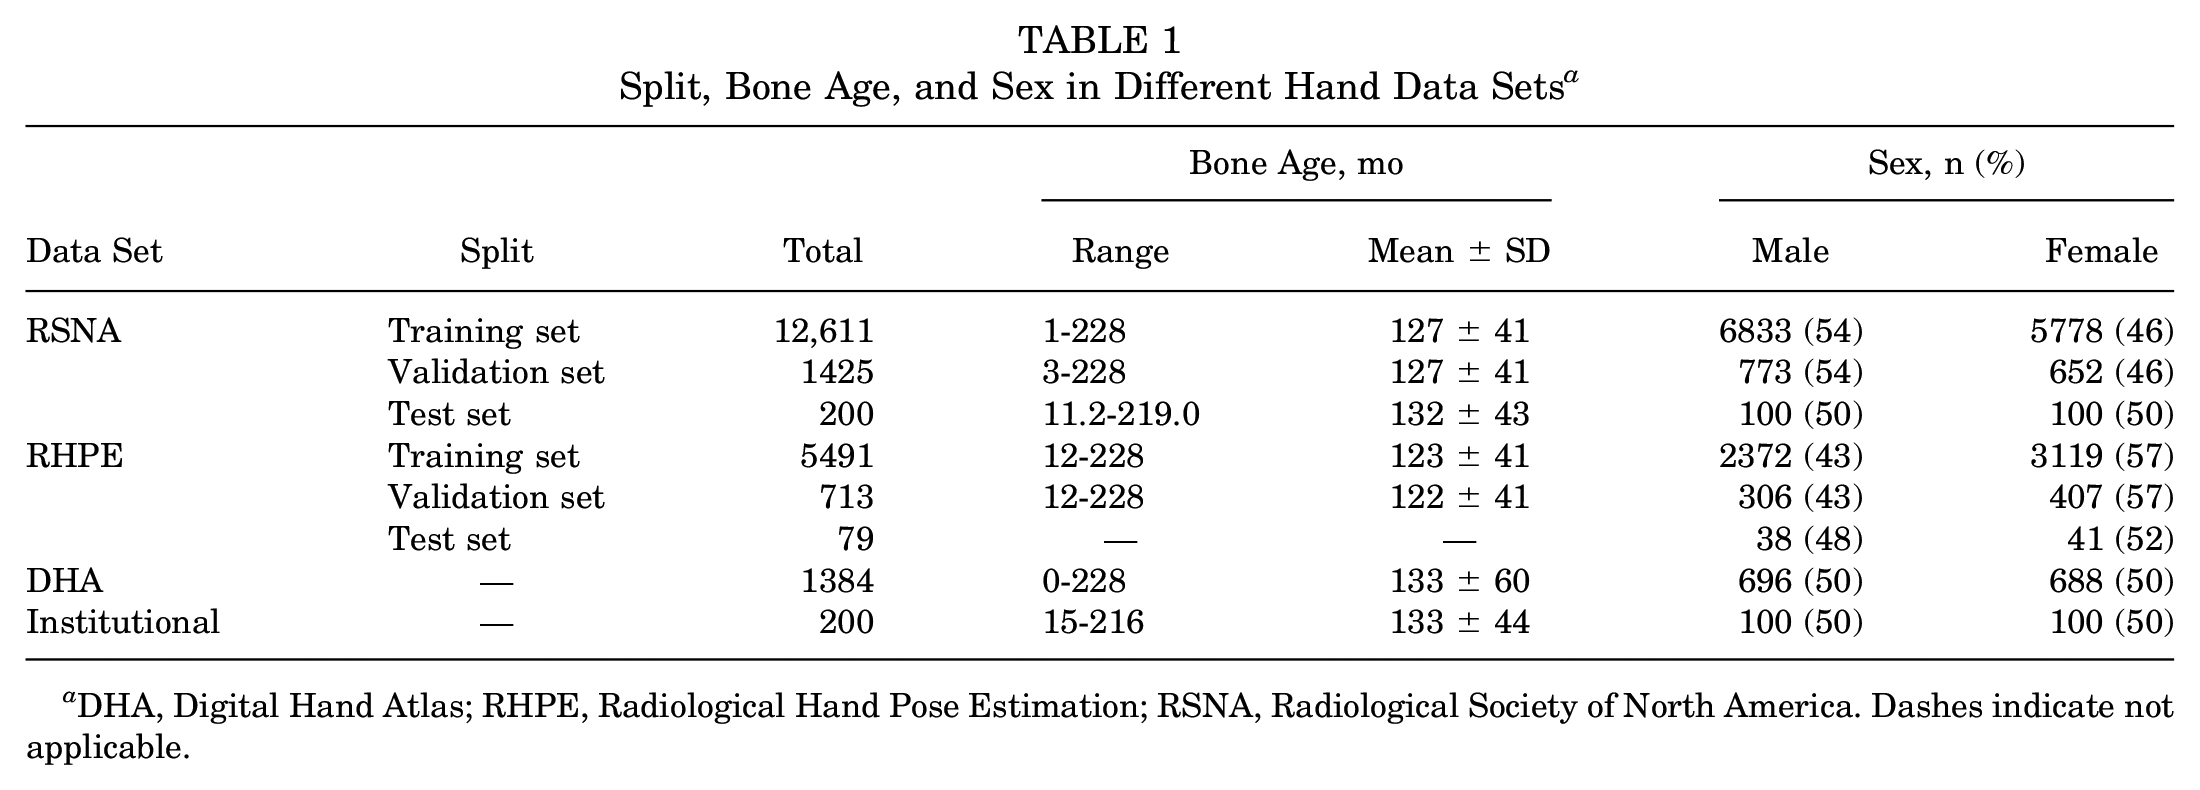
DHA, Digital Hand Atlas; RHPE, Radiological Hand Pose Estimation; RSNA, Radiological Society of North America. Dashes indicate not applicable.
Models Results on the Test Sets a
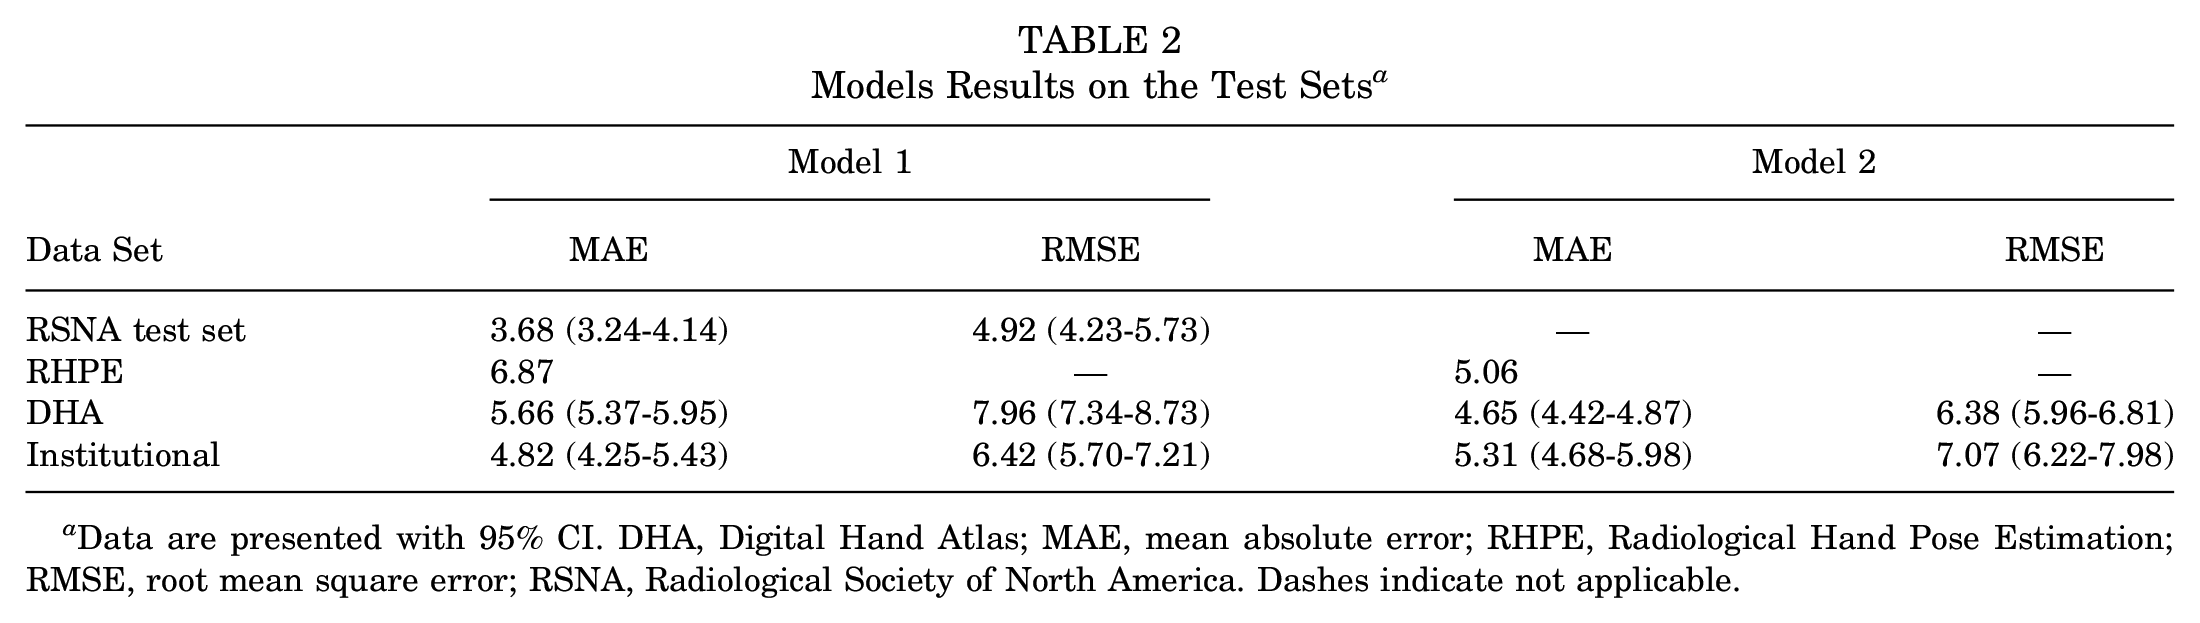
Data are presented with 95% CI. DHA, Digital Hand Atlas; MAE, mean absolute error; RHPE, Radiological Hand Pose Estimation; RMSE, root mean square error; RSNA, Radiological Society of North America. Dashes indicate not applicable.
Comparison of the MAE of Models 1 and 2 Against the State-of-the-Art Methods on the RSNA Test Set, DHA, and RHPE Data Sets a
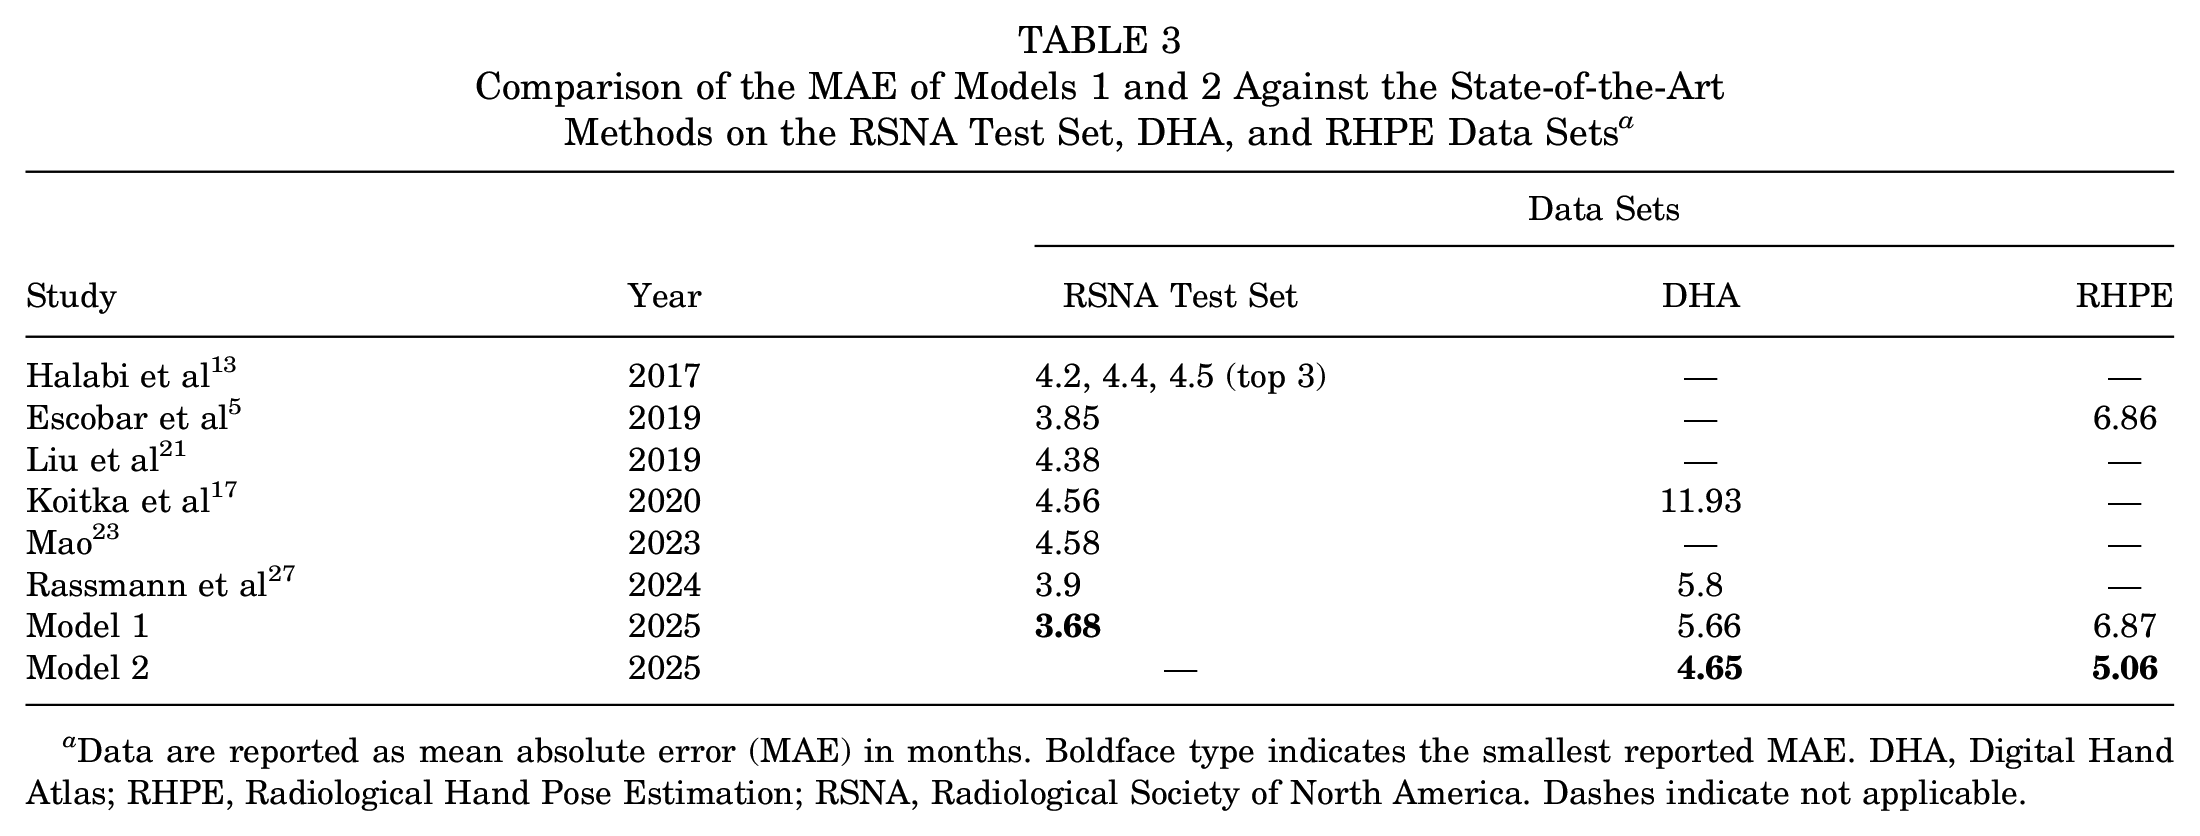
Data are reported as mean absolute error (MAE) in months. Boldface type indicates the smallest reported MAE. DHA, Digital Hand Atlas; RHPE, Radiological Hand Pose Estimation; RSNA, Radiological Society of North America. Dashes indicate not applicable.
On the institutional data set, the MAE increased from model 1 to model 2 (4.82 and 5.31 months, respectively). However, the confidence intervals of the MAE for both models overlap, suggesting that model 1 does not significantly outperform model 2 on this data set. Additionally, the broad confidence intervals indicate that the data size may not have been sufficient to draw definitive conclusions about the performance of both models on the institutional data set. To further investigate the effect of sample size, we recalculated the confidence intervals for the DHA test set by sampling 200 examples with replacement for 3000 iterations. The resulting confidence intervals for the MAE were 4.35 to 5.60 for model 1 and 3.87 to 5.08 for model 2, suggesting that the discrepancy in model performance may be secondary to sample size. Nonetheless, the relatively low MAE values for both models still support their good performance.
An ablation study was also conducted to assess the effects of preprocessing, augmentation, and ensembling, as shown in Table 4. As illustrated in the table, preprocessing reduced the error by approximately 10.1%, augmentation further reduced the error by 16.1%, and the ensembling approach achieved an additional reduction of 1.6%. Additionally, to capture potential biases of model 1 across different sexes and races, the MAE of model 1 on the DHA test set was calculated for each category and is presented in Appendix Table A1 (available online). The error for females was lower than that for males (5.41 vs 5.91 months). Additionally, the Asian group showed the lowest error (5.27), whereas the Black group (6.18) exhibited the highest error. A deeper analysis of these disparities is limited by the lack of race-related demographic information in the RSNA training set.
Effect of Preprocessing, Augmentation, and Ensembling Techniques on the MAE of Model 1 Evaluated on the RSNA Test Set a
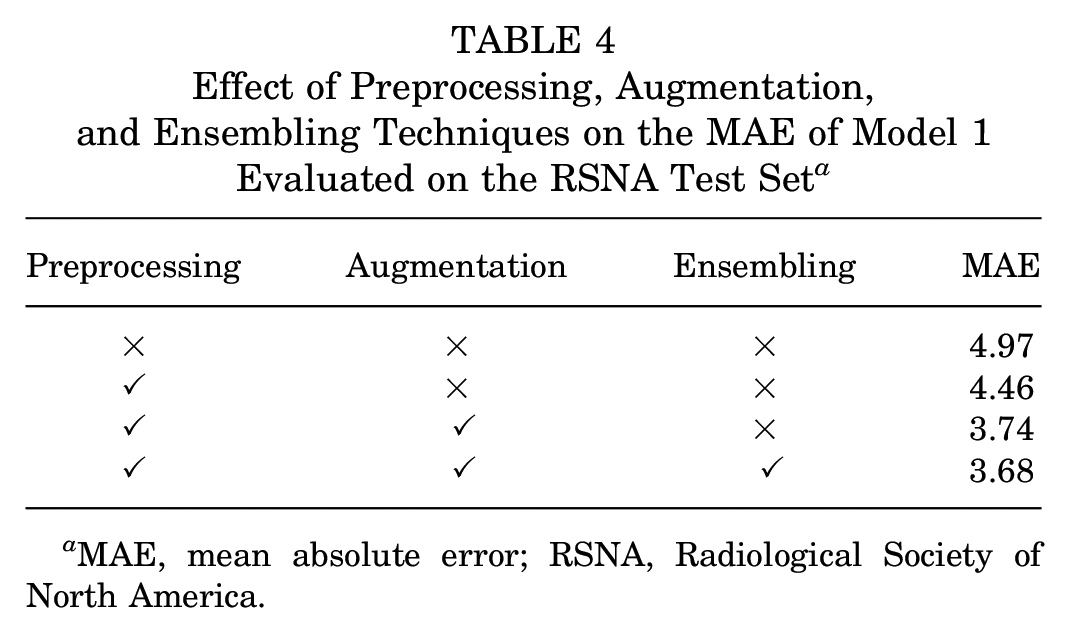
MAE, mean absolute error; RSNA, Radiological Society of North America.
Figure 4 displays scatterplots for both models 1 and 2 with limited discrepancies and high correlation between the ground truth and both the predictions of the first model (Figure 4, A and B) and the second model (Figure 4, C and D) for the DHA and institutional data sets. Both models demonstrate strong predictive capabilities, and in general, they do not show a clear tendency toward either overestimating or underestimating bone age when comparing the predictions to the identity line. Figure 5 demonstrates Bland-Altman plots with near-zero bias, indicating close alignment between predictions from the model and ground truth bone age. Greater dispersion in the middle range suggests more pronounced differences between predictions and ground truth for middle bone ages. Interpretability analysis in the form of gradient-based saliency maps (Figure 6) reveals that both models focus on areas that radiologists typically emphasize (digital physes/epiphyses, carpal bones, and distal radius and ulna physes/epiphyses).
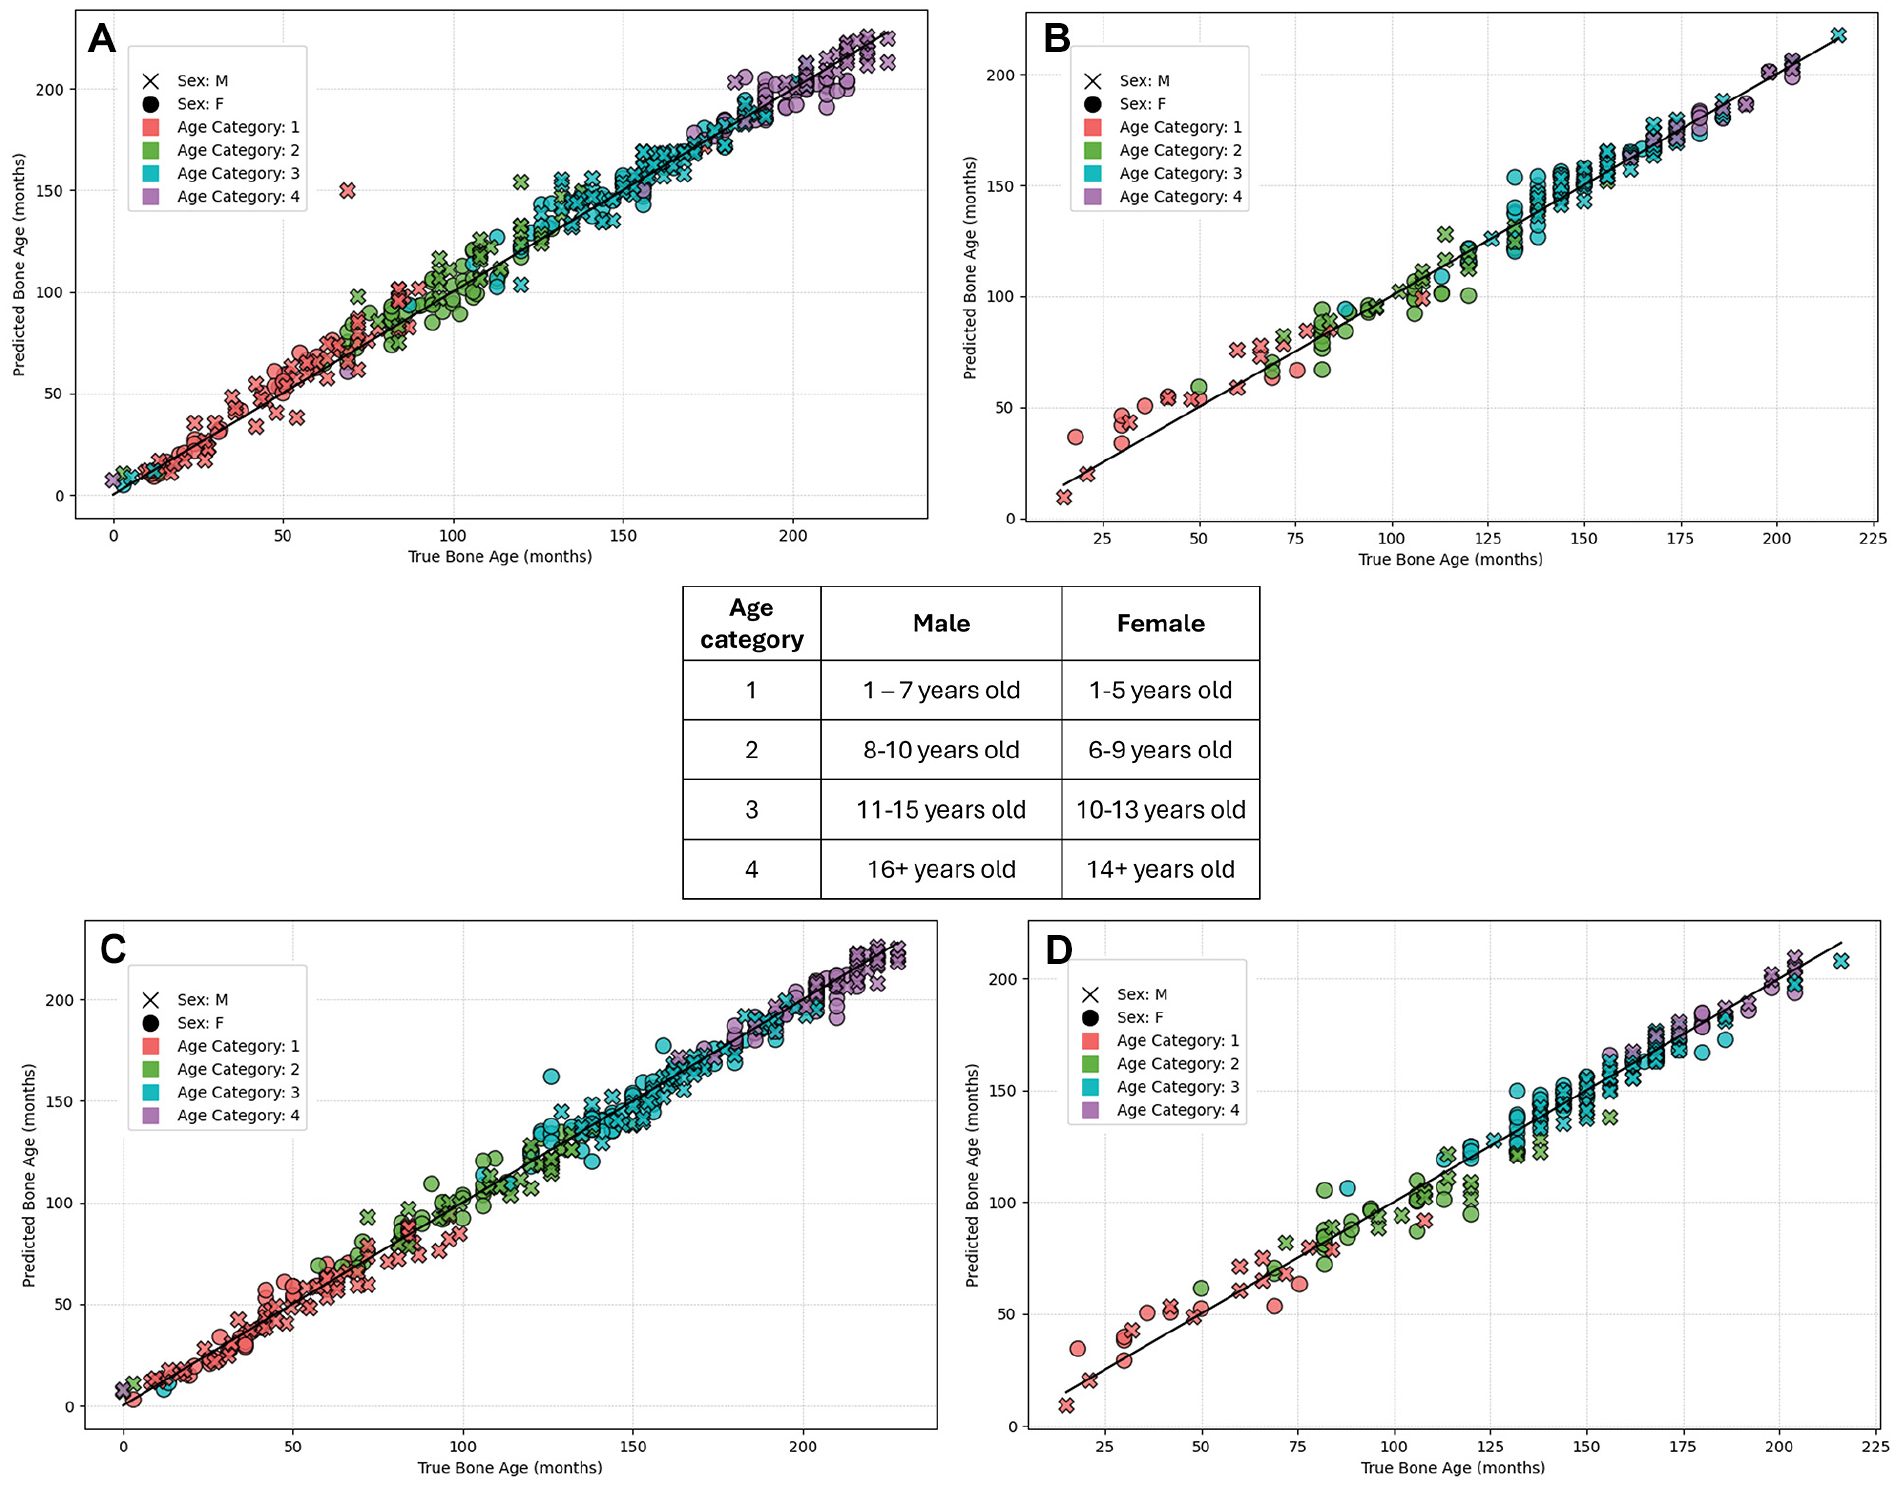
Scatterplots displaying the outcomes of the 2 models. (A and B) Results of model 1 applied to the Digital Hand Atlas (DHA) and institutional test sets, respectively. (C and D) Results of model 2 applied to the same DHA and institutional test sets. To improve the clarity of the DHA plots, only a portion of the DHA data were used. Because ground truth bone age was unavailable for the Radiological Hand Pose Estimation test set, and chronological age was missing from the Radiological Society of North America test set, scatterplots for these data sets were not included.
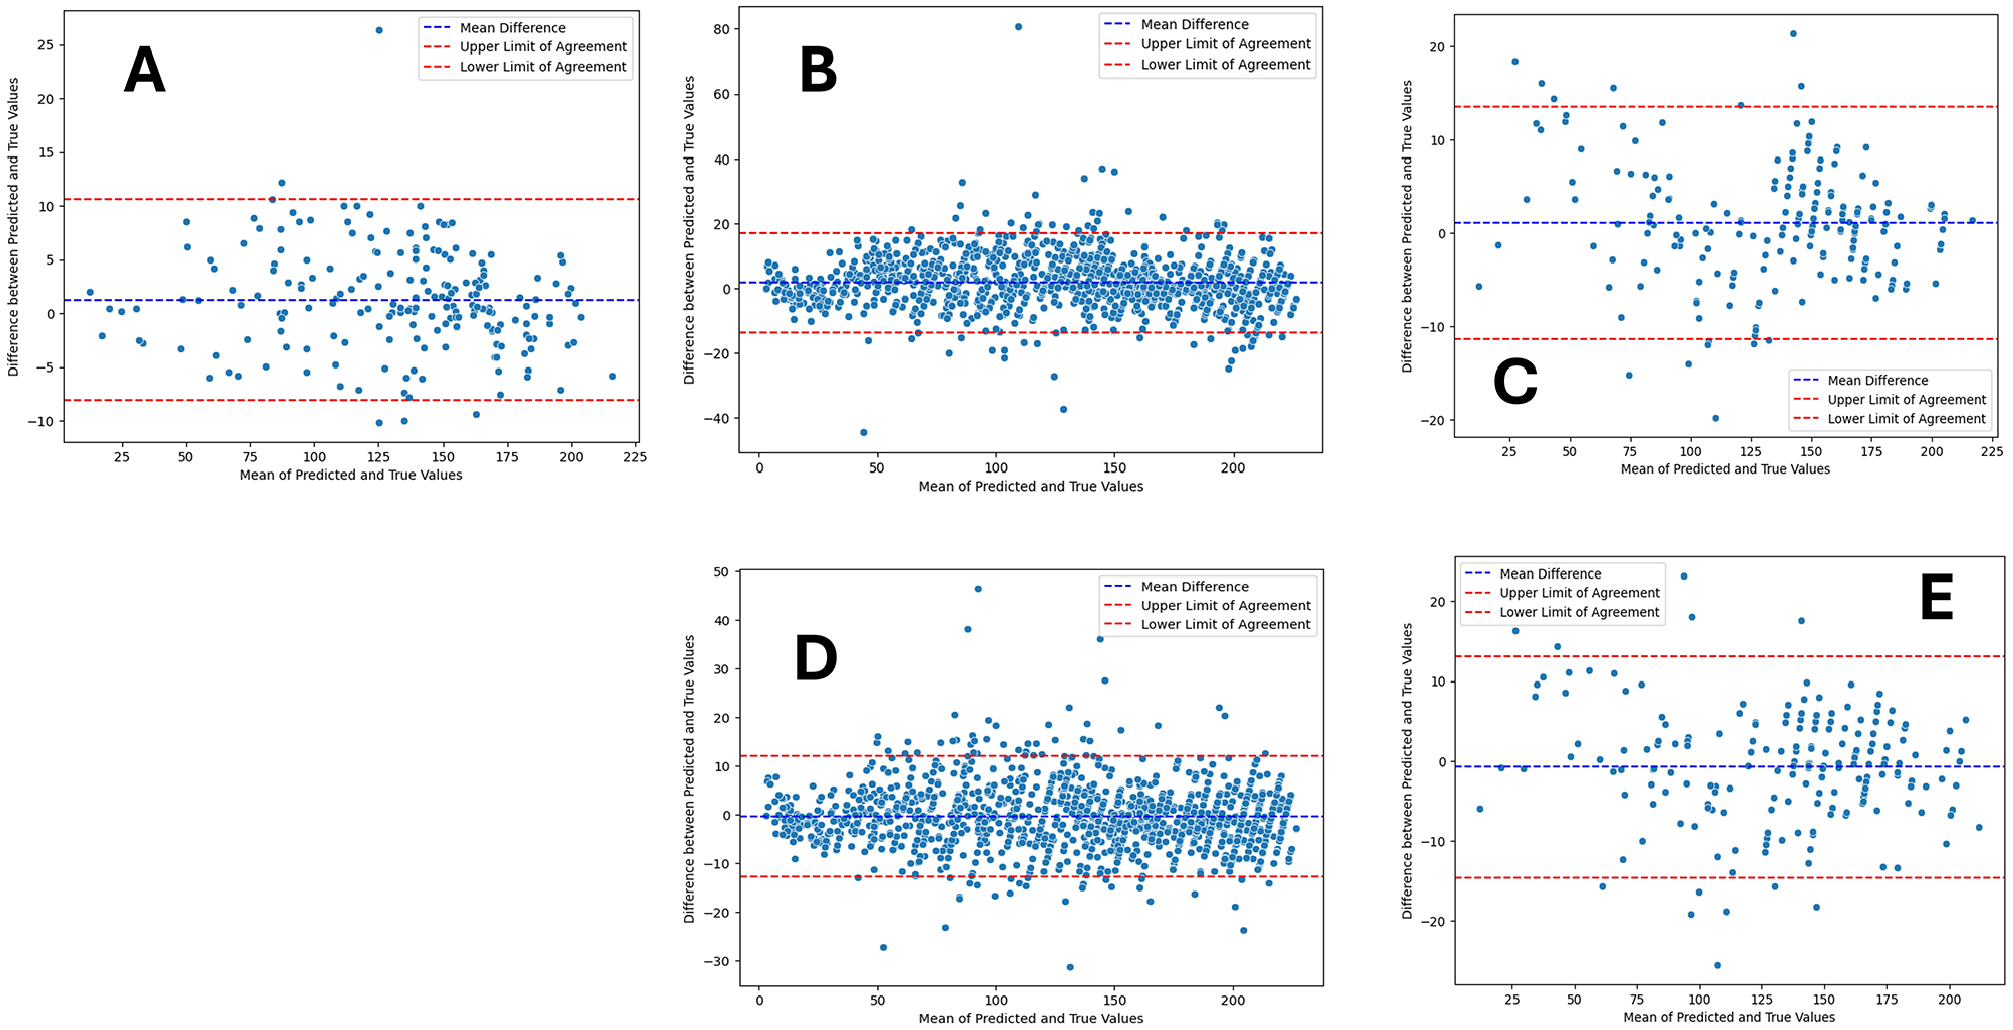
Bland-Altman plots illustrating the agreement between ground truth values and the predictions. The center dashed line displays the mean difference (bias). The top and bottom dashed lines denote 95% confidence intervals (1.96 SD above and below the mean difference). (A-C) Respective plots comparing ground truth values with model 1 predictions on the Radiological Society of North America, Digital Hand Atlas (DHA), and institutional data sets. (D and E) Corresponding plots comparing ground truth values with model 2 predictions on the DHA and institutional data sets.
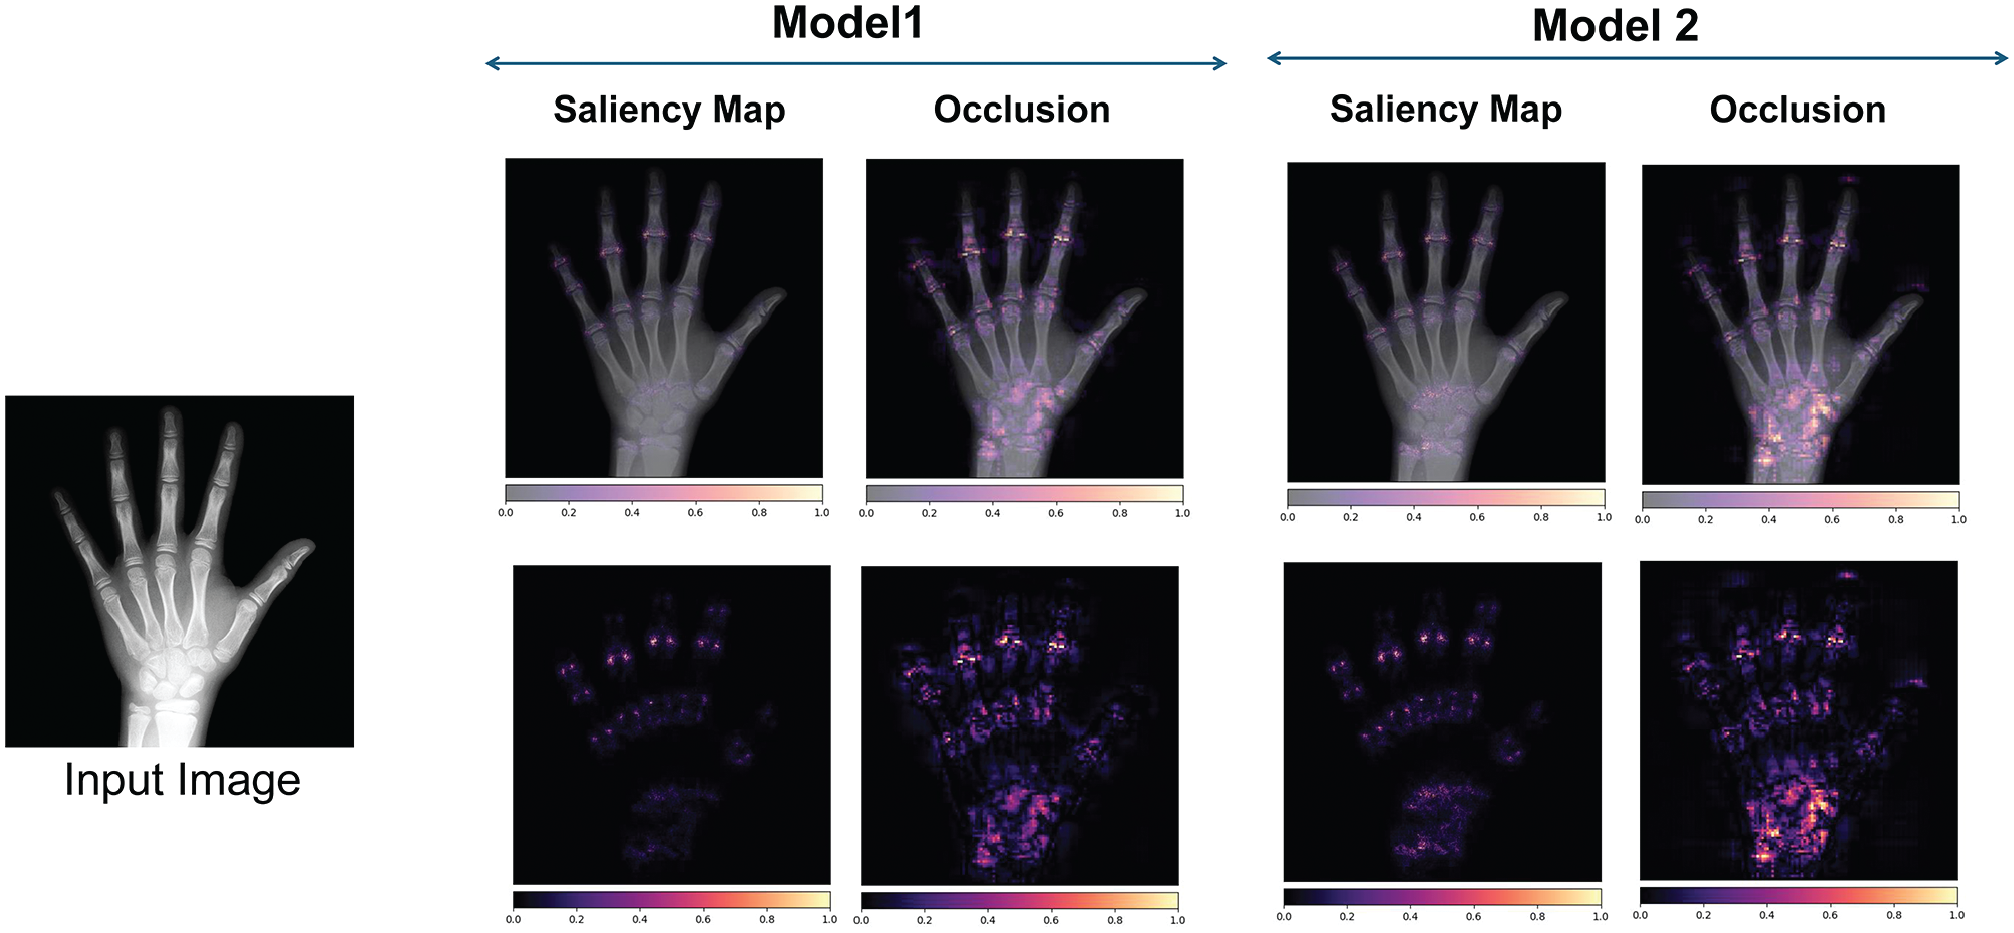
Gradient-based saliency maps. The heatmaps highlight the areas of the image that contribute most to predicting bone age, with brighter regions indicating greater contribution.
In a clinical setting, it is crucial to understand how certain the model is about its predictions. As discussed previously, model uncertainty for a sample is defined as the sample standard deviation of its 5-fold predictions, where a higher standard deviation indicates greater uncertainty. Figure 7 shows the first model’s uncertainty for 2 images: the top estimation, with higher uncertainty (6.65 months), has an unreliable prediction. Similar to the approach used by Leibig et al, 20 we quantified the model’s uncertainty as σpred, which we redefined to represent the sample standard deviation of the predictions produced by different folds of the model and conducted corresponding analyses (Figure 8). All test sets were combined: model 1 included the RSNA, DHA, and institutional data, while model 2 consisted of the DHA and institutional data. As shown, when the models include more uncertain samples, the MAE increases. This means that our uncertainty metric aligns with the clinical workflow, allowing radiologists to disregard images with high uncertainty.
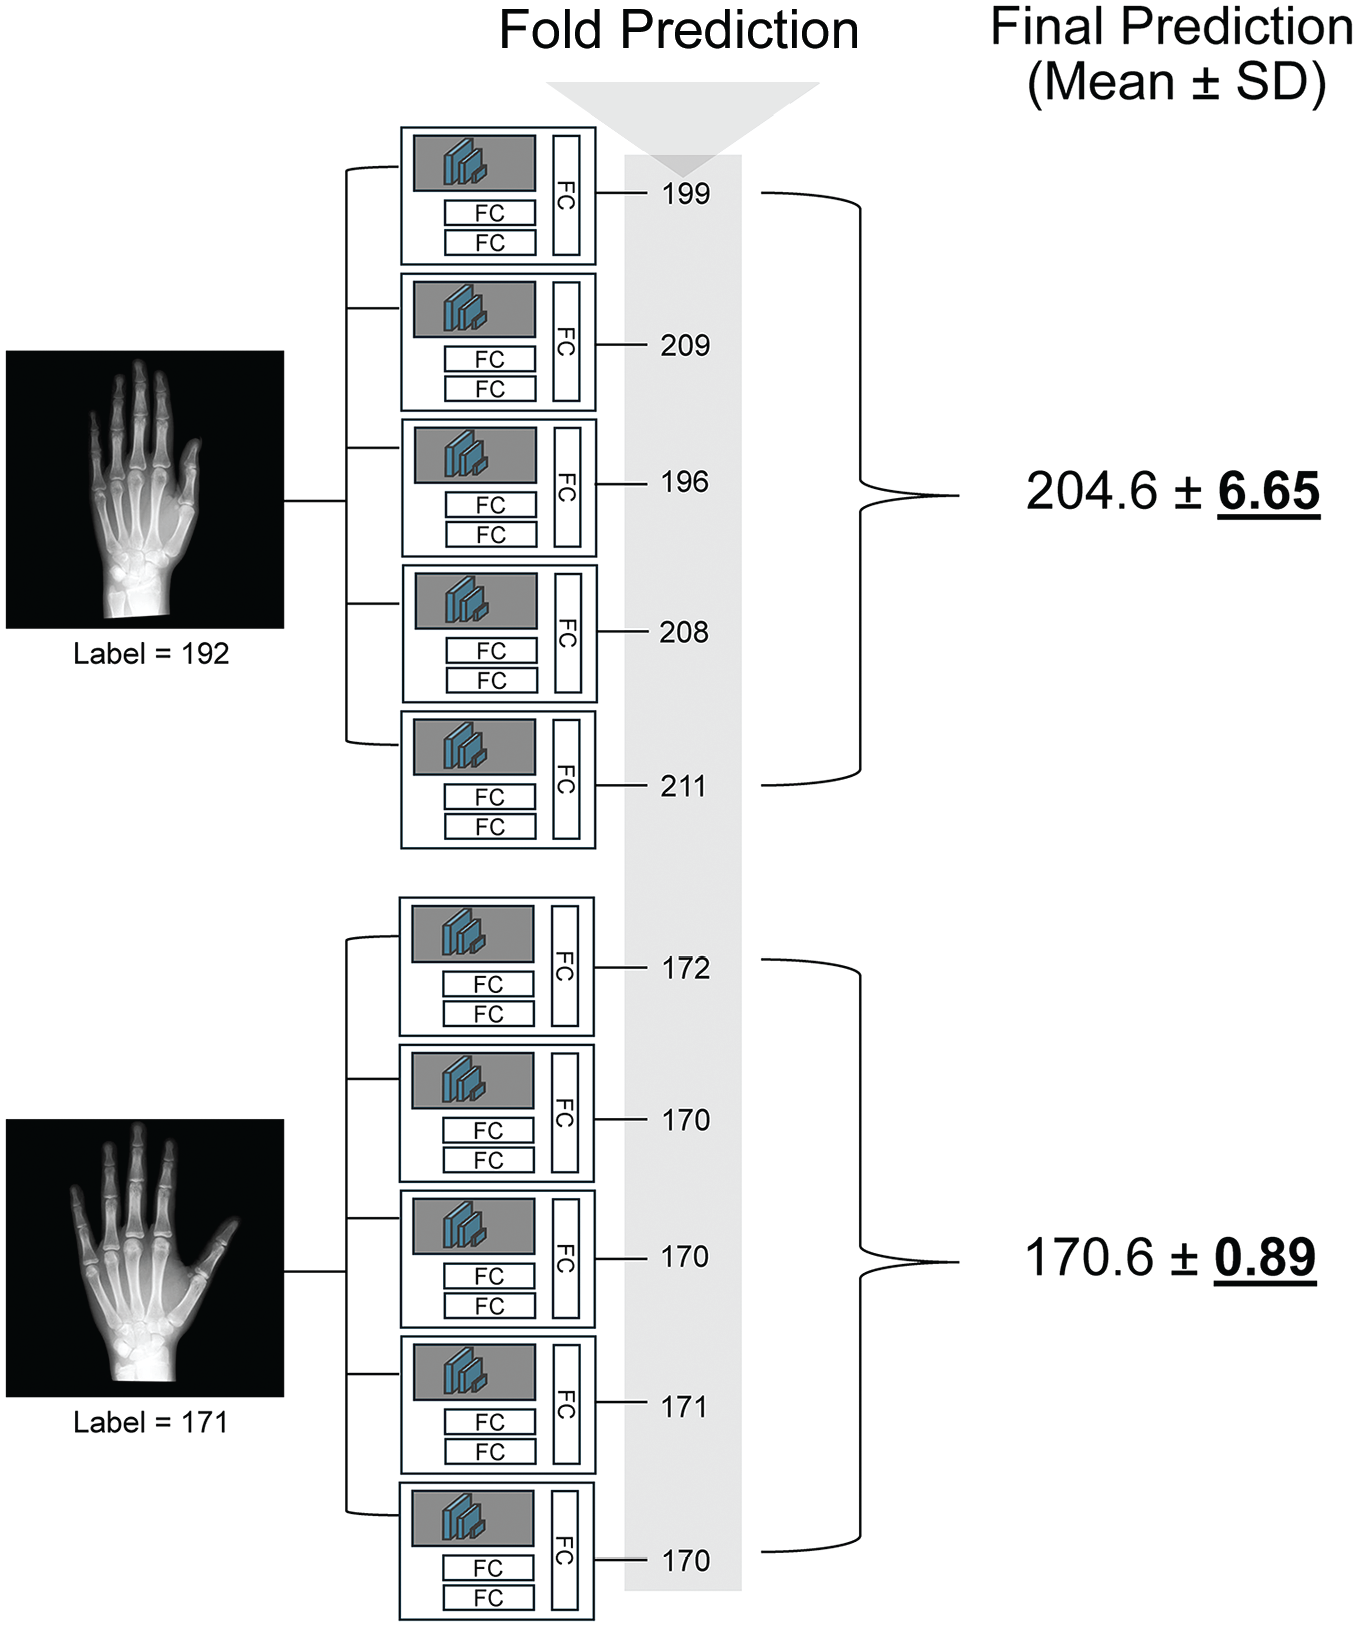
Representative final predictions and corresponding uncertainties. The final predictions and their corresponding uncertainties (standard deviations) for 2 different images are shown. The error between the label and the prediction is high (12.6 months) for the upper image, which is validated by its high uncertainty (6.65). Conversely, the error for the bottom image is low (0.4 months) and is accompanied by lower uncertainty (0.89). FC, fully connected.
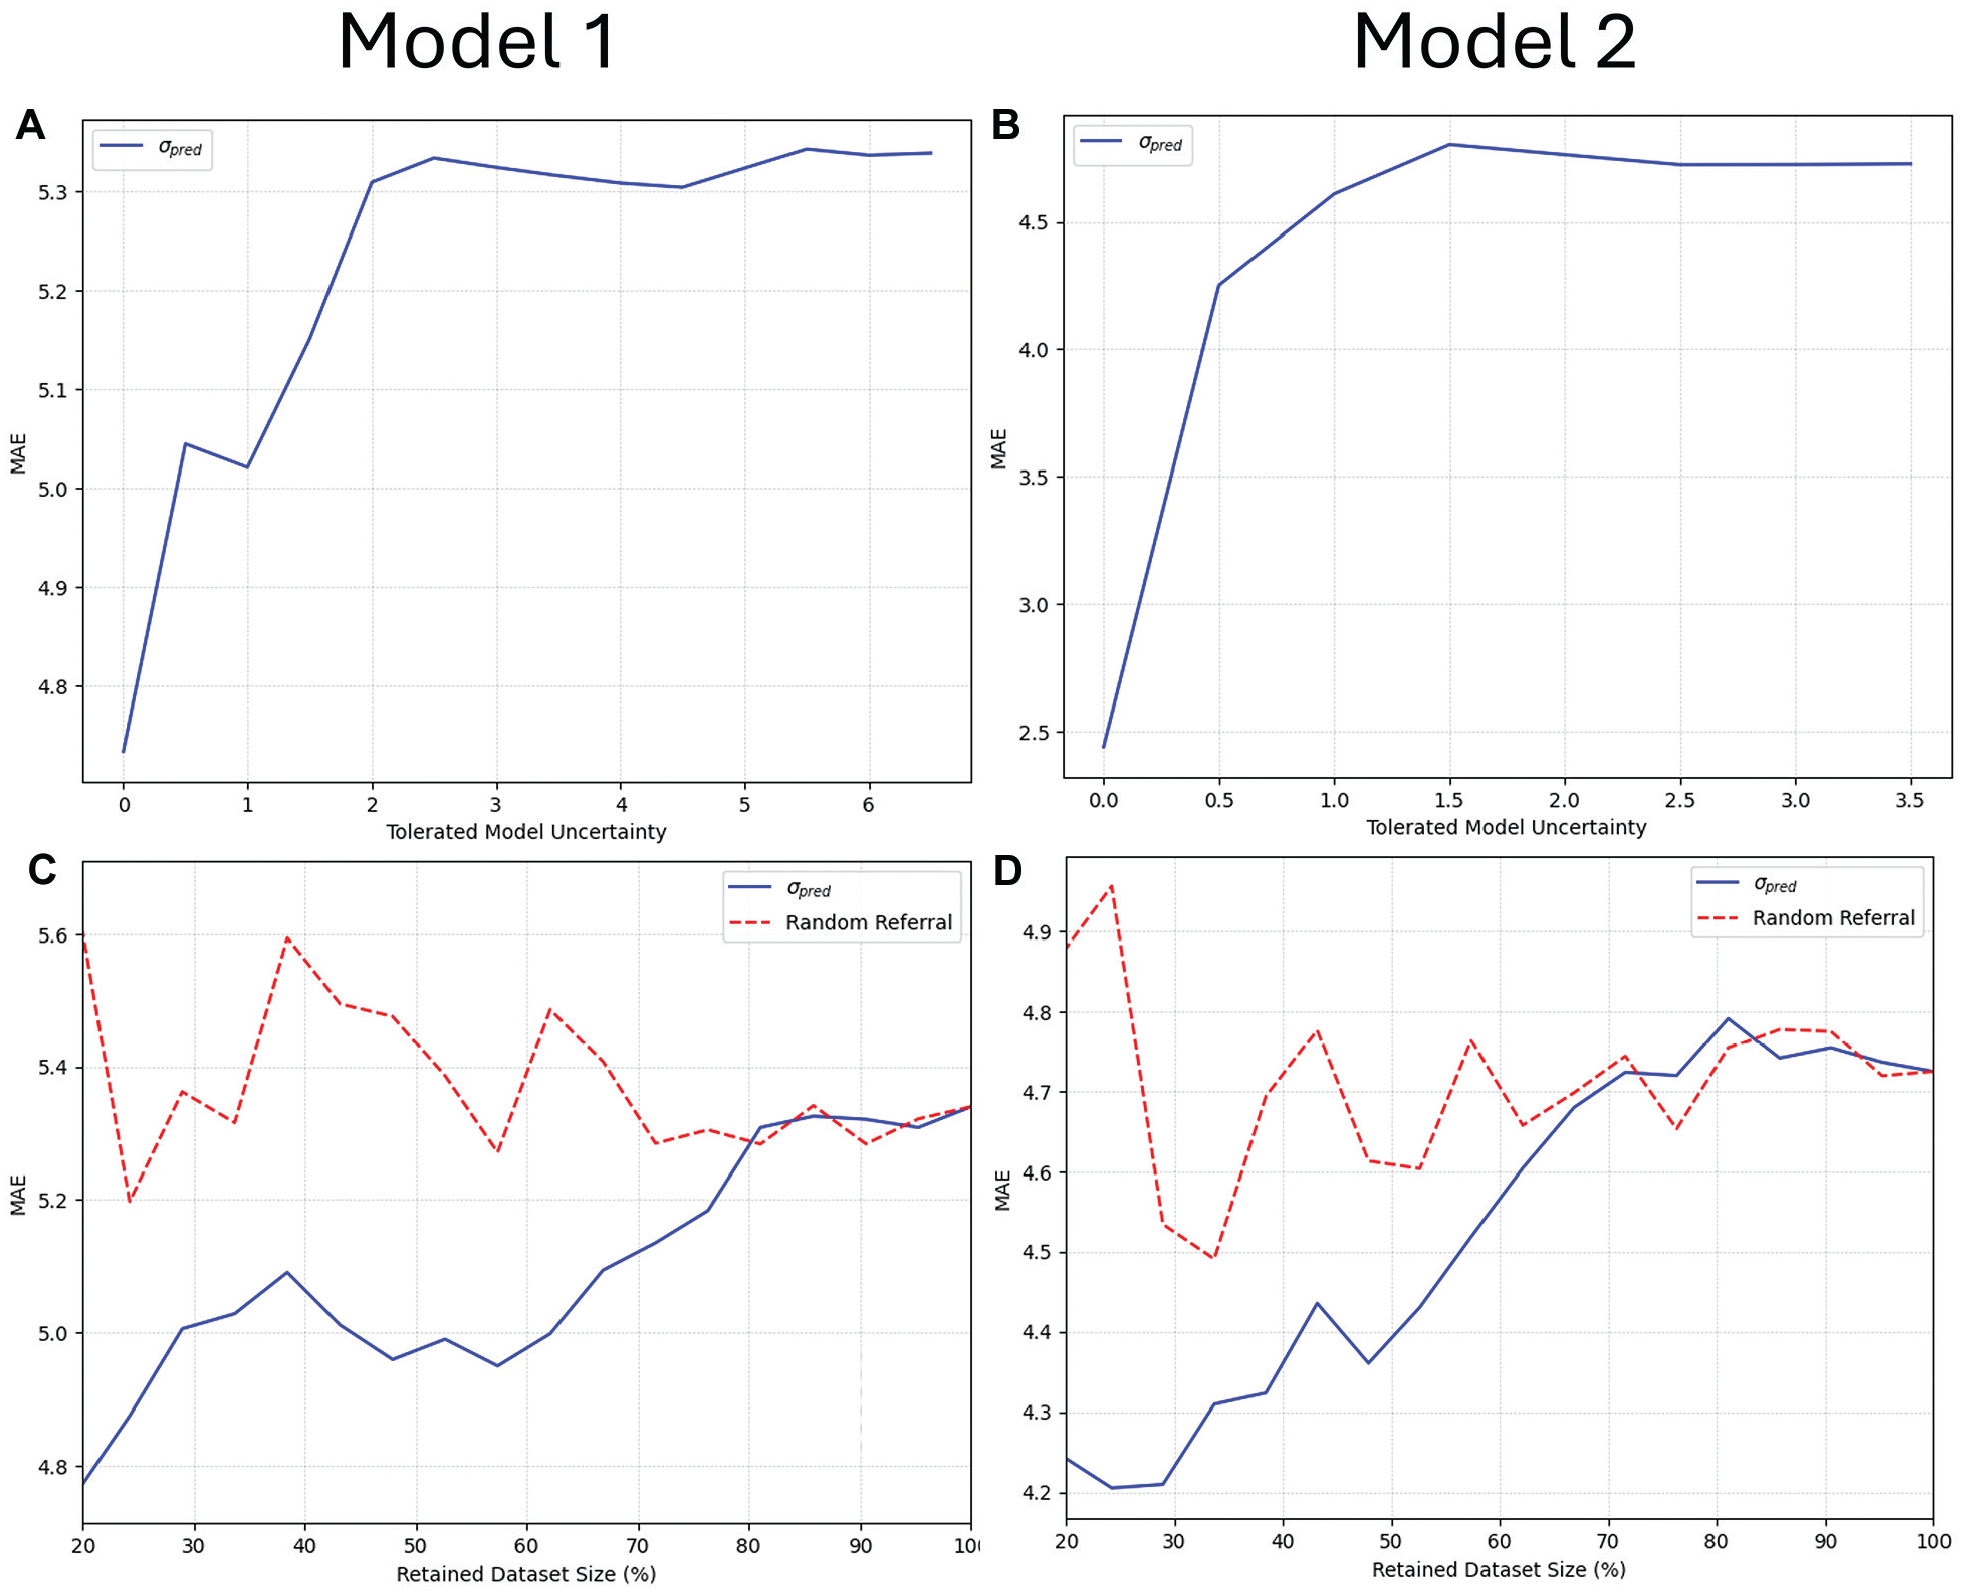
Uncertainty plots. (A and B) Relationship between mean absolute error (MAE) and uncertainty, illustrating that as the model tolerates more uncertainty (that is, includes samples with higher uncertainty), the error increases. (C and D) Relationship between the fraction of retained data and MAE. The blue line represents the MAE with data retained based on uncertainty, while the red line shows MAE with randomly selected data. For example, for the blue line, retaining 80% means removing the 20% with the highest uncertainty; for the red line, it means randomly selecting 80% of the data. The blue lines are generally lower than the red ones, indicating that uncertainty-informed removal reduces error compared with random removal.
Discussion
Technological innovation in the field of artificial intelligence, specifically computer vision and DL, has allowed rapid improvement in the ability of models to reliably and accurately characterize radiographic images. 13 With potential as valuable diagnostic and classification assistants, they necessitate large, accurate data inputs to achieve excellent performance. The models developed in this study achieved state-of-the-art performance across all 3 included hand radiograph data sets with high performance on an institutional data set as external validation. The collective effect of these results is substantial and sets a new standard for pediatric bone age assessment. By developing a highly accurate hand radiograph model, this model enhances diagnostic precision, aiding in the timely and appropriate intervention for orthopaedic conditions.
Our first model demonstrated an MAE of 3.68 months when applied to the RSNA test set, outperforming not only the first-place model from the 2017 competition, 26 but also the best previously published MAE of 3.87 months achieved by Deeplasia. 27 This approach builds on modern advancements in DL, using ConvNeXt (a transformer-inspired CNN architecture 22 ) for its efficient design and ability to capture broader image features compared with previous CNNs like Inception (2017 RSNA winner 25 ) or EfficientNet (Deeplasia 27 ). Beyond the architecture, our curated preprocessing steps (eg, background segmentation, histogram equalization, and alignment) and extensive data augmentation further improved performance. These combined efforts set our work apart from previous methods and contributed to its superior results.
While the original RSNA competition reported low MAE values for the best models (4.2-4.5 months), it should be noted that these values only represent performance on the RSNA test set. 1 Their test set only included 200 radiographs and therefore may have been too small and poorly representative of the larger data set, overinflating model performance. Beheshtian et al 1 subsequently observed that the same first-place RSNA model actually achieved a 6.9-month MAE on the RSNA internal validation set and a 6.8-month MAE when externally validated on the DHA.
In an effort to both increase the diversity of bone age estimation populations and improve the accuracy of models through image annotation—allowing for assessment of landmark positioning in the hand—Escobar et al 5 published the RHPE data set in 2019. They subsequently developed a DL model using a novel BoNet architecture (based on Inception Version 3) for skeletal age estimation, achieving a best-reported MAE value of 6.3 months. 10 Our second model, incorporating chronological age from the RHPE and after initial training on the RSNA, was able to achieve an improved MAE of 5.06 months. The DHA, although the smallest among the 3 data sets, represents the most diverse published repository of hand radiographs, ensuring equal racial representation across 1400 images from Southern California. 26 After final validation on the DHA, our model is the first in the reported literature to achieve an MAE <6 months when used to evaluate any validation data set.
There are inherent limitations to determination of skeletal age using the GP atlas, namely its design and reliability. 28 The atlas lacks precision when describing distinct differences between ages (eg, differences may be described as changes in difficult-to-characterize morphology of epiphyses), and representative radiographs are only present at 1-year intervals for older patients (already creating a mean error of 6 months). When performing a methodologically rigorous evaluation of skeletal age, the RSNA study reported that the mean rating of their 6 radiologists had a mean difference from the true bone age of 2.8 months. 24 As the precision of DL models can only be as good as the gold standard measurements, further performance improvement <3 months MAE is not feasible due to the variations that exist in defining the GP bone age.26,28
A commonly cited limitation of DL algorithm application to the clinical arena and generalizability to other hospitals is overestimated performance due to lack of external validation. 7 The development of a mobile-based, website-based, or PACS-integrated application for this model would allow for easier clinical workflow integration to avoid other computational requirements. However, differences in image acquisition, positioning and orientation, and postprocessing vary by institution, which can lead to substantial decreases in model performance in approximately one-quarter of published DL models for radiologic diagnosis. 31 Santomartino et al 29 conducted “computational stress testing” of the RSNA first-place model when applied to the RSNA and DHA, including 21 image transformations (rotations, flips, brightness, contrast, inversion, laterality marker, and resolution) on the RSNA data and 33 on the DHA. They observed significant differences in estimated bone age in 71% of RSNA transformations and 76% of DHA transformations. This demonstrates the relative fragility of these models in real-world scenarios and the importance of quality control assessments. Further decreased performance may be experienced on application of these models to other populations with different sex (approximately 50% in all 3 included registries) and race breakdowns16,33 owing to the development of the GP atlas on a Caucasian population from Cleveland, Ohio, between 1931 and 1942. 11
Our study has several notable limitations. First, model performance somewhat decreased at the extremes of age included, likely secondary to smaller sample sizes. This may limit the model’s generalizability across a representative population, particularly at younger ages. Fortunately, estimation of bone age is most critical for patients approaching skeletal maturity to determine growth remaining when selecting an orthopaedic procedure. Second, because chronological age data were not available for the RSNA data set, the second model was trained on a more limited amount of labeled data, which may have constrained its performance. Third, while this study leverages 3 diverse data sets from different regions of the world, there may be inherent demographic biases that prevent generalization to all patient populations. Fourth, the addition of chronological age in model 2 led to slightly decreased model performance on the institutional test set. The reason behind this discrepancy is likely due to sample size limitations, as previously discussed. With the demonstrated performance improvement with the addition of chronological age to the larger sample size RHPE and DHA, it is important to include this variable given its relevance in the clinical setting. Last, the fundamental utility of bone age is for allowing estimation of final height at skeletal maturity, with assumed skeletal maturity achieved at 14 years in girls and 16 years in boys. Final height was not captured in these publicly available data sets, and therefore understanding the implications of estimated bone age in these populations is not fully clear.
Conclusion
Leveraging newer DL technologies trained on >20,000 hand radiographs across 3 distinct, diverse data sets, this study developed a robust model for predicting bone age. Utilizing features extracted from the model trained on the RSNA data set, combined with incorporation of chronological age provided in the RHPE data set, our model outperforms previous state-of-the-art models. These results indicate that our models provide a highly accurate platform for integration into clinical workflows that can affect real-time decision-making for sports medicine surgeons, radiologists, endocrinologists, and other musculoskeletal clinicians evaluating skeletal age.
Supplemental Material
sj-pdf-1-ajs-10.1177_03635465251359618 – Supplemental material for Determination of Skeletal Age From Hand Radiographs Using Deep Learning
Supplemental material, sj-pdf-1-ajs-10.1177_03635465251359618 for Determination of Skeletal Age From Hand Radiographs Using Deep Learning by Joshua T. Bram, Ayoosh Pareek, Samuel A. Beber, Ruth H. Jones, M. Moein Shariatnia, Amir Daliliyazdi, Olivia C. Tracey, Daniel W. Green and Peter D. Fabricant in The American Journal of Sports Medicine
Footnotes
Acknowledgements
The authors sincerely thank Diego Jaramillo, MD, MPH, for his work in providing independent skeletal age reads of the institutional hand radiographs, as well as Joseph Hood for his assistance in image acquisition.
Submitted January 24, 2025; accepted June 12, 2025.
One or more of the authors has declared the following potential conflict of interest or source of funding: The project described was supported by a grant from the American Orthopaedic Society for Sports Medicine. The content is solely the responsibility of the authors and does not necessarily represent the official views of the American Orthopaedic Society for Sports Medicine. P.D.F. has received consulting fees from BICMD Inc, royalties from Springer Nature, and holds stock or stock options in Osso VR. D.W.G. has received consulting fees from Arthrex, royalties from Arthrex and Orthopediatrics, and speaking fees from Synthes. A.P. has received consulting fees from AllaiHealth Inc. AOSSM checks author disclosures against the Open Payments Database (OPD). AOSSM has not conducted an independent investigation on the OPD and disclaims any liability or responsibility relating thereto.
References
Supplementary Material
Please find the following supplemental material available below.
For Open Access articles published under a Creative Commons License, all supplemental material carries the same license as the article it is associated with.
For non-Open Access articles published, all supplemental material carries a non-exclusive license, and permission requests for re-use of supplemental material or any part of supplemental material shall be sent directly to the copyright owner as specified in the copyright notice associated with the article.