
Abstract
Background:
Trochlear dysplasia is frequently seen in young patients and can be a cause of patellar instability (PI). A lateral trochlear inclination (LTI) of 11° or less has long been utilized to discriminate between patients with and without some degree of trochlear dysplasia that is likely to contribute to recurrent PI. The traditional methodology for this radiographic measure has been described via a single-image technique. Recently, a 2-image technique was introduced to better account for distal femoral orientation relative to proximal trochlear cartilage. However, further work is required to determine the validity of the 2-image LTI technique in introducing a new diagnostic threshold value for trochlear dysplasia.
Purpose/Hypothesis:
The purpose of this study was to evaluate the validity of the novel 2-image LTI measurement technique in determining a diagnostic cut-off value for trochlear dysplasia that is likely to result in recurrent PI. It was hypothesized that this would yield a different value than the historical 11° cutoff determined through the single-image technique.
Study Design:
Cohort study (Diagnosis); Level of evidence, 3.
Methods:
After institutional review board approval, medical records were retrospectively reviewed to form a PI group and a control (no PI) group. The 2-image LTI was first measured by 2 raters to determine intrarater and interrater reliability. A receiver operating characteristic curve was created to determine a diagnostic cut-off value. After applying this cutoff between the groups, the resultant sensitivity and specificity were calculated.
Results:
The 2-image LTI measurements demonstrated excellent intrarater and interrater reliability. The PI group had a mean LTI of 2.58°, while the control group had a mean LTI of 17.26°. A diagnostic threshold LTI value of 13.7° was determined, discriminating between patients with and without recurrent PI due to trochlear dysplasia, with a sensitivity of 0.889 and a specificity of 0.780. The area under the curve was 0.887.
Conclusion:
Utilizing the 2-image LTI measurement technique, a threshold value of 13.7° was determined as optimal for discerning between patients with and without trochlear dysplasia that is likely to lead to recurrent PI. This value can thus be used for accurate diagnoses of trochlear dysplasia, which can help to inform management, patient counseling, and research in the future.
Patellar instability (PI) is a common condition in pediatric, adolescent, and young adult patients. PI is largely caused by anatomic risk factors such as patella alta, trochlear dysplasia, genu valgum, femoral anteversion, external tibial torsion, and ligamentous laxity.1,2,7,9-12,14-16,18,22 Among these, trochlear dysplasia has been identified as the most common anatomic risk factor, with 90% to 96% of patients with recurrent PI having some degree of trochlear dysplasia identifiable on imaging. 8
The Dejour classification has previously been used to describe trochlear dysplasia via lateral knee radiography and axial magnetic resonance imaging (MRI).17,24,27 However, this classification system is qualitative in nature, may underestimate the severity of trochlear dysplasia, and yields moderate to poor intrarater and interrater reliability on both radiography and MRI.4,23 This leads to the questionable use of the classification system when evaluating surgical indications or the potential for recurrent instability. More recently, the Oswestry-Bristol classification has been devised as another qualitative alternative to the Dejour classification. 25 While its intrarater and interrater reliability are better, it is still a qualitative, categorical schema that has inherent limitations compared with a numeric description of trochlear dysplasia.
Lateral trochlear inclination (LTI) is a numeric measure of trochlear dysplasia. 5 As described by the original authors, LTI is measured on the most proximal axial MRI scan in which trochlear cartilage can be appreciated and is the angle formed between a line parallel to the lateral trochlear facet and a line tangential to the posterior femoral condyles on a single image. This method has consistently been shown to have good to excellent intrarater and interrater reliability and reproducibility. 5 Carrillon et al 5 also examined LTI in the context of supporting a diagnosis of PI and reported that an LTI of 11° or less was a diagnostic value associated with 93% sensitivity and 87% specificity. However, the accuracy of the single-image LTI method has recently been questioned. 13 The proximal extent of lateral trochlear cartilage in patients with PI is usually at the level of the posterior femoral metaphysis rather than the posterior femoral condyles. 31 As such, the single-image LTI does not account for true femoral rotation and is not the most accurate measure of trochlear morphology, casting doubt on the validity of the original 11° diagnostic LTI value. 13 Recently, a 2-image technique was introduced to accurately account for distal femoral rotation. 13 In the original description and analysis, the 2-image LTI method yielded good to near perfect intrarater and interrater reliability and was shown to be an accurate measure of proximal trochlear morphology.
The purpose of this study was to examine the validity of the original LTI of 11° used as a diagnostic indicator in the context of trochlear dysplasia that is likely to result in recurrent PI when evaluated with a 2-image method. We hypothesized that comparing LTI measurements collected using the 2-image LTI method between a group of patients with PI and a matched group of control participants would yield a different LTI value compared with the 1-image method that can be used as a diagnostic indicator of trochlear dysplasia.
Methods
With approval from our institutional review board, patients who were treated for recurrent PI at our institution between the years 2019 and 2022 were identified in our electronic medical record database using International Classification of Diseases, Tenth Revision (ICD-10) codes. Inclusion and exclusion criteria were applied to the results from the search of ICD-10 codes. Inclusion criteria were as follows: a diagnosis of recurrent PI that was supported from clinical notes to include history and physical examination findings as well as accessible MRI scans of the symptomatic knee. Patients were excluded if they had inadequate MRI scans (nondiagnostic imaging, no MRI, inaccessible MRI), a questionable PI diagnosis, neuromuscular or arthritic conditions, PI due to patella alta or genu valgum as detailed in clinical notes or on imaging, or a concurrent diagnosed ligament injury unrelated to a diagnosis of recurrent PI. A chart review was performed to confirm a diagnosis of PI, apply exclusion criteria, and collect patient age and sex. A total of 99 patients met the inclusion criteria. Age- and sex-matched control participants were identified within the same electronic medical record database used for the PI group. Controls were required to have knee MRI scans and a diagnosis other than PI. Any patients with a history of PI as documented in their clinical notes were excluded. There were 91 participants who met our requirements to be included in the control group. Given previous work that has shown that an increased tibial tubercle–trochlear groove distance is likely an indirect reflection of the degree of trochlear dysplasia present, tibial tubercle–trochlear groove distance measurements were not taken into account for either inclusion or exclusion criteria.6,19,20,28,29
Measurements were performed on axial MRI scans using the 2-image LTI technique following the original description. 13 In brief, the 2-image LTI was measured by identifying the first axial MRI scan with trochlear cartilage present. A sagittal MRI scan was used as a cross-reference to confirm that the most proximal extent of trochlear cartilage was visualized on the axial MRI scan. The angle between the trochlear cartilaginous surface and a horizontal line was measured. Next, the first distal axial MRI scan in which the fully formed femoral condyles could be depicted was identified; this was also confirmed using a sagittal MRI scan. On this distal axial MRI scan, the angle between a line tangential to the posterior aspect of the condyles and a horizontal line was measured. The 2-image LTI was calculated by subtracting the angle formed by the femoral condyles and the horizontal line from the angle formed by trochlear cartilage and the horizontal line (Figure 1). A medical student was trained by an attending surgeon to perform measurements. In addition, 30 patients from the dataset were selected at random, with 15 selected from the PI group and 15 selected from the control group. Interrater and intrarater reliability were evaluated first to confirm good agreement between the medical student and the attending surgeon before measurements of the complete dataset.

Measurement of the 2-image lateral trochlear inclination (LTI). (A) On an axial magnetic resonance imaging scan, an angular measurement was made along the lateral inclination of the most proximal aspect of the trochlea and a horizontal line. Angles with an apex toward the medial aspect of the knee were assigned a positive value. (B) A sagittal cross-reference image was used to ensure that the measurement on the axial image occurred as proximal on the cartilaginous trochlea as possible. (C) A second axial image was selected more distally on the knee where the posterior femoral condyles were fully visualized. The angle was measured between the tangent of the posterior condyles and a horizontal line. Angles with an apex toward the medial aspect of the knee were assigned a positive value, and angles with an apex toward the lateral aspect of the knee were assigned a negative value. The 2-image LTI was calculated by subtracting the posterior condylar angle from the proximal trochlear angle. (D) A sagittal cross-reference image showing that angle formed along the tangent of the posterior condyles and a horizontal line was taken at a level of fully formed posterior femoral condyles.
Statistical Analysis
Interrater and intrarater reliability were determined using the intraclass correlation coefficient (ICC) between and within the measurements obtained from 2 different observers (a medical student and a sports medicine fellowship–trained orthopaedic surgeon). A randomly selected subset of 30 patients from the entire cohort of 190 was used to obtain the ICC. Measurements were taken on this subset of 30 patients by each observer on 2 different occasions separated by at least 2 weeks. An ICC <0.50 was considered poor, 0.50-0.74 was considered moderate, 0.75-0.90 was considered good, and >0.90 was considered excellent.
The means and standard deviations were calculated, and an independent t test was used to determine statistical differences between the PI and control groups. A receiver operating characteristic curve was used to plot the true positives as a function of the false positives, and the area under the curve (AUC) was determined. We considered an AUC >0.70 to be considered a test with diagnostic utility. The Youden (J) statistic was then calculated to determine a cut-off value between patients with PI and controls. All statistical analyses were conducted using SPSS (Version 27; IBM).
Results
Intrarater reliability was considered excellent for both raters, with ICCs of 0.968 (95% CI, 0.935-0.985) and 0.963 (95% CI, 0.924-0.982). Interrater reliability was also considered excellent, with an ICC of 0.948 (95% CI, 0.849-0.963) (Figure 2). The mean 2-image LTI in the PI group was 2.58°± 10.72° and 17.26°± 6.77° in the control group, which was statistically significant (P < .001) (Table 1). The AUC was 0.887 (95% CI, 0.841-0.933) (Figure 3). A value of 13.7° was selected as the best discriminating value between patients with PI and controls, with a sensitivity of 0.889 and a specificity of 0.780 (Table 1 and Figure 4).

Regression lines fitted against 2-image lateral trochlear inclination (LTI) measurements from both raters for patients with patellar instability and controls.
Interrater and Intrarater Reliability of 2-Image LTI a

ICC, intraclass correlation coefficient; LTI, lateral trochlear inclination; PI, patellar instability.

Receiver operating characteristic curve of 2-image lateral trochlear inclination (LTI) measurements in which the area under the curve was 0.887 (95% CI, 0.841-0.933).
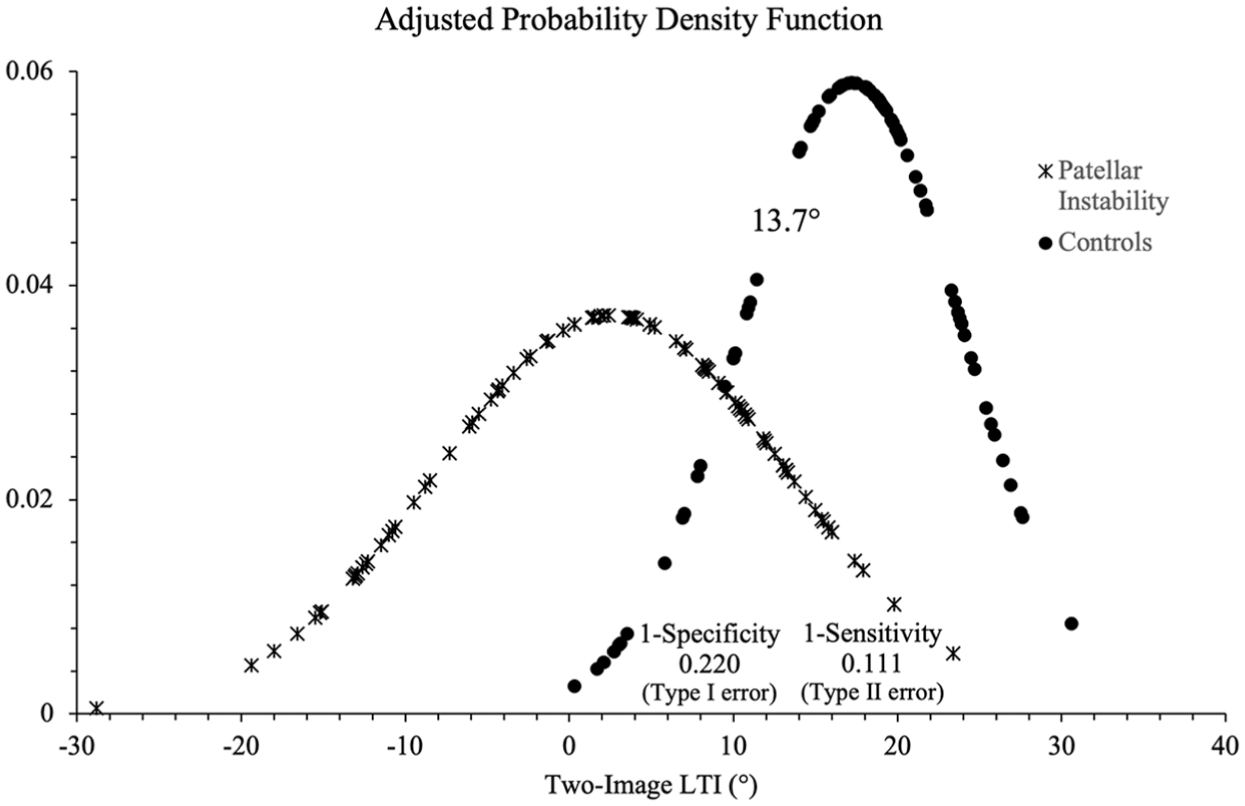
Adjusted probability density function of 2-image lateral trochlear inclination (LTI) measurements for patients with patellar instability and controls containing a threshold value of 13.7°. The type I error was calculated at 0.220, while the type II error was calculated at 0.111.
Discussion
In the present study, our analysis of the recently described 2-image LTI method 13 demonstrated that an LTI of 13.7° is an optimal threshold value to discriminate between patients with and without recurrent PI due to trochlear dysplasia, and this value differs slightly from the historical value of 11° that was originally described by Carrillon et al 5 using the single-image technique. This threshold value can be used for future research that utilizes the 2-image LTI as well as for clinical purposes when evaluating patients with trochlear dysplasia.
In the original description of LTI, Carrillon et al 5 reported that they identified the first axial MRI scan that contained lateral trochlear cartilage. LTI was then measured on this image as the angle between the subchondral bone and the posterior femoral condyles. In a subsequent analysis of this method, Joseph et al 13 found that the first MRI scan that contained cartilage of the proximal trochlea almost always included ill-defined posterior condyles, if the condyles were even visible at all. Thus, it raises the question about exactly where the measurement by Carrillon et al 5 was taken. 13 If the authors gave absolute priority to identifying the proximal trochlea using a single-image technique, the femoral condyles would frequently not be visible, and true femoral rotation in relation to the proximal trochlea would not be captured and vice versa. It may also be the case that a bit of both scenarios occurred in the original single-image LTI study. A close examination of the results revealed that only 2 LTI measurements were negative, with those values being −1° and −3°, and the mean LTI for their study cohort was 6.17°. The mean LTI for our PI group was 2.58°, and some of our LTI values were ≥–15°. Whatever the possible differences in measurements in the study by Carrillon et al, 5 the 2-image LTI method has been shown to more accurately measure proximal trochlear morphology in relation to the posterior femoral condyles in comparison to the single-image technique. 13
Other studies have looked at threshold values of LTI and have arrived at rather different results. A recent study by Tanaka et al 26 using the single-image LTI method to analyze the difference between LTI measurements taken on the subchondral bone versus trochlear cartilage reported a threshold value <17°, with a sensitivity of 0.73 and a specificity of 0.59, when LTI was measured on the subchondral bone. When they measured LTI relative to the trochlear cartilage surface, they reported a threshold value <13°, with a sensitivity of 0.76 and a specificity of 0.58. The threshold values are different enough that they fall beyond expected standard deviations in measurements. Further, the sensitivity and specificity are notably different from those of Carrillon et al. 5 Wierer et al 30 conducted a multivariate analysis to determine which risk factors best predicted recurrent patellar dislocations. Their analysis revealed that a single-image LTI ≤12° was a significant risk factor for recurrent PI. While it is difficult to definitively explain these differences between the studies, a probable explanation would be disparate image selection when performing LTI measurements. Similar to a sulcus angle measurement, the value obtained depends entirely on the location on the trochlea where the measurement was taken. 3 This highlights an important point and, admittedly, a limitation of the LTI measurement technique. There needs to be wide agreement and understanding of where this measurement should be taken for LTI to be broadly applicable and accurate for common usage.
The AUC in the receiver operating characteristic curve analysis in our study was good/borderline excellent at 0.887, with excellent specificity and good sensitivity. This is in contrast to an excellent AUC of 0.95 as well as excellent specificity and sensitivity in the study of Carrillon et al. 5 Close scrutiny of the results from the 2 studies showed that our study had some overlap in LTI values, such that there were some patients with lower LTI values who were not in the control group and there were some patients with higher LTI values who were in the PI group, which is a finding that is not unexpected. Also, given the larger patient sample that was analyzed, one would expect to find some degree of overlap in measurements between the PI and control groups. We must assume that there was less overlap in Carrillon et al’s 5 study based on their results. While our study resulted in a slightly less precise threshold value, we think that our finding is more representative and thus has more external validity.
The clinical utility of LTI has been addressed in previous studies. The 2-image LTI can be used to help indicate which patients are suitable for trochlear reshaping surgery. Surgeons who perform trochleoplasty (including the senior author, J.L.P.) often recommend patients for this surgery when a trochlea is either flat or convex. This corresponds to a 2-image LTI value that is either 0° (flat) or negative (convex). Paiva et al 21 used an expert panel to grade the quality of currently used radiological measures of trochlear dysplasia. The single-image LTI method scored highest on the quality assessment and was determined to be useful in the diagnosis and treatment planning of trochlear dysplasia as well as in calculating patients’ risk for future PI. This was a subjective analysis and did not report on the utility of the 2-image LTI technique. Similar studies utilizing the 2-image LTI are warranted.
There are several limitations to this study. First, the current study is retrospective in nature and is time constrained. Thus, there may have been some patients in the control group with a lower LTI value who developed PI outside of the time window of the study. While it was easy to exclude patients with patella alta and genu valgum from the study, without the ubiquitous use of advanced imaging with rotational profiles, it is impossible to know what role rotational abnormalities may have played in some of the patients with PI. It is quite possible that some of the patients with PI and higher LTI values had higher degrees of axial malalignment. Had this been controlled for, this could have changed the threshold value for LTI. With all that said, almost all studies that have looked at threshold values for either the single-image LTI or the 2-image LTI, as in our case, produced a value that is in the low teens. Given the ubiquity of trochlear dysplasia combined with a relative paucity of other anatomic risks factors in the population with PI, these values are likely not far off.
Conclusion
The 2-image LTI threshold value of 13.7° can be used to discriminate between patients with PI and those without PI with a high level of accuracy. This threshold value can be utilized in the diagnosis and management of PI and can be incorporated into risk assessment tools for the prediction of future PI events.
Footnotes
Final revision submitted March 29, 2025; accepted June 13, 2025.
One or more of the authors has declared the following potential conflict of interest or source of funding: J.L.P. is a consultant for Arthrex and JRF Ortho; is a member of the speakers bureau of Vericel; holds stock options in OutcomeMD; and is a committee member of the AOSSM, Arthroscopy Association of North America, and Pediatric Research in Sports Medicine Society. AOSSM checks author disclosures against the Open Payments Database (OPD). AOSSM has not conducted an independent investigation on the OPD and disclaims any liability or responsibility relating thereto.
Ethical approval for this study was obtained from UT Southwestern Medical Center (STU-2022-0288).