
Abstract
Background:
Accurate measurement of posterior tibial slope (PTS) is for understanding knee biomechanics and stability, as well as in planning surgical procedures. The validated methodology for measuring PTS requires outline visualization of 15 cm distal to the proximal tibia, a cutoff that is not always met on standard lateral knee radiographs.
Purpose/Hypothesis:
The goal of this study was to critically evaluate whether using a 10-cm anatomic axis on conventional lateral knee radiographs is comparable with the established 15-cm standard. The authors hypothesized that a shortened 10-cm anatomic axis would yield comparable results to the conventional 15-cm method.
Study Design:
Cohort study (diagnosis); Level of evidence, 3.
Methods:
Lateral knee radiographs were reviewed until a cohort of 100 patients was identified where ≥15 cm of the tibial shaft distal to the joint line could be measured. PTS was calculated using both the conventional 15-cm proximal anatomic axis (15-PTS) and the proposed modified 10-cm axis (10-mPTS). Measurement reliability and agreement were quantitatively assessed via intraclass correlation coefficients (ICCs) and Bland-Altman analysis, respectively. Paired t tests and linear regression were performed to evaluate the equivalence of methods. Additionally, a second set of 100 lateral knee radiographs was randomly selected to determine a percentage of radiographs that could be measured ≥15 cm below the joint line.
Results:
There was a statistically significant congruence between the 10-mPTS and 15-PTS techniques (ICC, 0.92; P < .001). The mean PTS discrepancy was statistically significant at 0.94°, with a 95% CI ranging from 0.78° to 1.0°. Both methods demonstrated high inter- and intrarater reliability (ICCs > 0.90). On 61% of standard lateral knee radiographs queried, we were unable to visualize 15 cm of the proximal tibia.
Conclusion:
The 10-mPTS method exhibits <1° of deviation compared with the conventional 15-PTS approach, establishing it as a practical and reliable alternative for assessing PTS on lateral knee radiographs, particularly when visualization of 15 cm distally is not possible.
The posterior tibial slope (PTS) represents the sagittal angulation of the tibial plateau in relation to the tibial shaft. Recent literature has documented the significance of PTS in knee biomechanics and stability, its influence on tension within both native and reconstructed cruciate ligaments.1,14 Even minor increases in PTS can induce heightened translational strain on the anterior cruciate ligament (ACL), thereby elevating the risk of ligamentous failure.3,8,11,18,28 The current literature further emphasizes the importance of PTS in knee biomechanical stability by identifying decreased PTS as a potential risk factor for primary posterior cruciate ligament (PCL) injuries.5,16 This is thought to be attributed to amplified posterior shearing forces, which have also been associated with graft failure in single-bundle PCL reconstructions.3,4,31 These findings underscore the intricate role of PTS in knee joint stability and the importance of its consideration when evaluating cruciate ligament injuries.
In the context of surgical applications, PTS is utilized in planning of various orthopaedic procedures, including total knee arthroplasty, high tibial osteotomy, and cruciate ligament reconstructions, as this measurement affects clinical outcomes.2,12,17,19,29 Specifically, PTS is utilized as a key measurement for guiding surgical approaches such as the slope-reducing, anterior closing-wedge high tibial osteotomy to restore knee joint biomechanics and reduce the risk of graft failure. 19 Furthermore, PTS measurements are used in total knee arthroplasty procedures to facilitate customized implant placement and alignment.2,12,20
Two predominant methods exist for quantifying the PTS: the anatomic axis, centered on the diaphysis, and the mechanical axis, focused on the alignment of the femoral head and the center of the ankle joint. 30 The anatomic axis has proven to be a more consistent and reliable approach for assessing PTS compared with the mechanical axis.7,9 In contrast to the mechanical axis, which is influenced by ankle and foot alignment, the anatomic axis remains unaffected by these variables. Previous research indicates that there are no significant differences in PTS values obtained using the proximal anatomic axis on lateral knee radiographs compared with full-length lateral tibial radiographs. 10 The accepted methodology for PTS measurement utilizing the proximal anatomic axis mandates an axis that extends 15 cm distal from the knee joint on lateral knee radiographs. 3 However, a common limitation in clinical practice is that standard knee radiographs often do not capture the required 15 cm distal from the knee. The objective of this study is to validate an alternative method for PTS measurement using a shortened anatomic axis: 10 cm (10-mPTS) on conventional lateral knee radiographs. Our hypothesis posits that this modified approach, 10-mPTS, will yield results comparable with those obtained using the standard proximal anatomic axis with a 15-cm extension.
Methods
Patients who met the study’s inclusion criteria were randomly selected from the host institution’s picture archiving and communication system (PACS) (IntelliSpace Radiology Enterprise 4.5; Philips North America Corp) in a retrospective manner using a computerized random number generator. Radiographs were reviewed until 100 lateral radiographs were identified that met the inclusion criteria. All included patients previously underwent a lateral knee radiograph between December 2020 and March 2022.
Inclusion criteria were lateral radiographs displaying ≥15 cm of the tibia distal to the knee joint line for tibial axis measurement. Exclusion criteria consisted of (1) radiographs showing an open physis, (2) previous surgery on the proximal tibia or distal femur, (3) history of physeal arrest or stimulation, (4) previous fractures, (5) known deformity-causing illnesses, (6) lower-extremity neoplasms, and (7) osteoarthritis. Demographic variables such as patient age, sex, and body mass index (BMI) were gathered from the patient chart using an electronic medical record (Epic; Epic Systems Corp).
Additionally, a second sample of 100 lateral knee radiographs was compiled using a random number generator from the original PACS query. These randomly selected 100 radiographs were evaluated for the ability to measure ≥10 cm and ≥15 cm distal from the joint line.
Measurement Techniques at 10 and 15 cm
Measurements were performed within the institutional PACS system. Two separate techniques were used for PTS assessment. The first technique, the standard proximal anatomic axis PTS technique (15-PTS), involved marking 2 points at 5 cm and 15 cm distal from the knee joint line. The midpoints between the anterior and posterior tibial cortices at these points were identified by drawing a circle bordering the cortices and identifying the center of the circle, then connecting the midpoints with a line to form the vertical tibial axis, as described in previous studies (Figure 1).9,30 The PTS was then computed as the angle between a perpendicular line to this axis and the medial tibial plateau (Figure 1A). The 10-mPTS method established the vertical tibial axis using 2 points at 5 cm and 10 cm distal from the knee joint. To establish the vertical axis and PTS, the method was used for the 15-PTS (Figure 1).
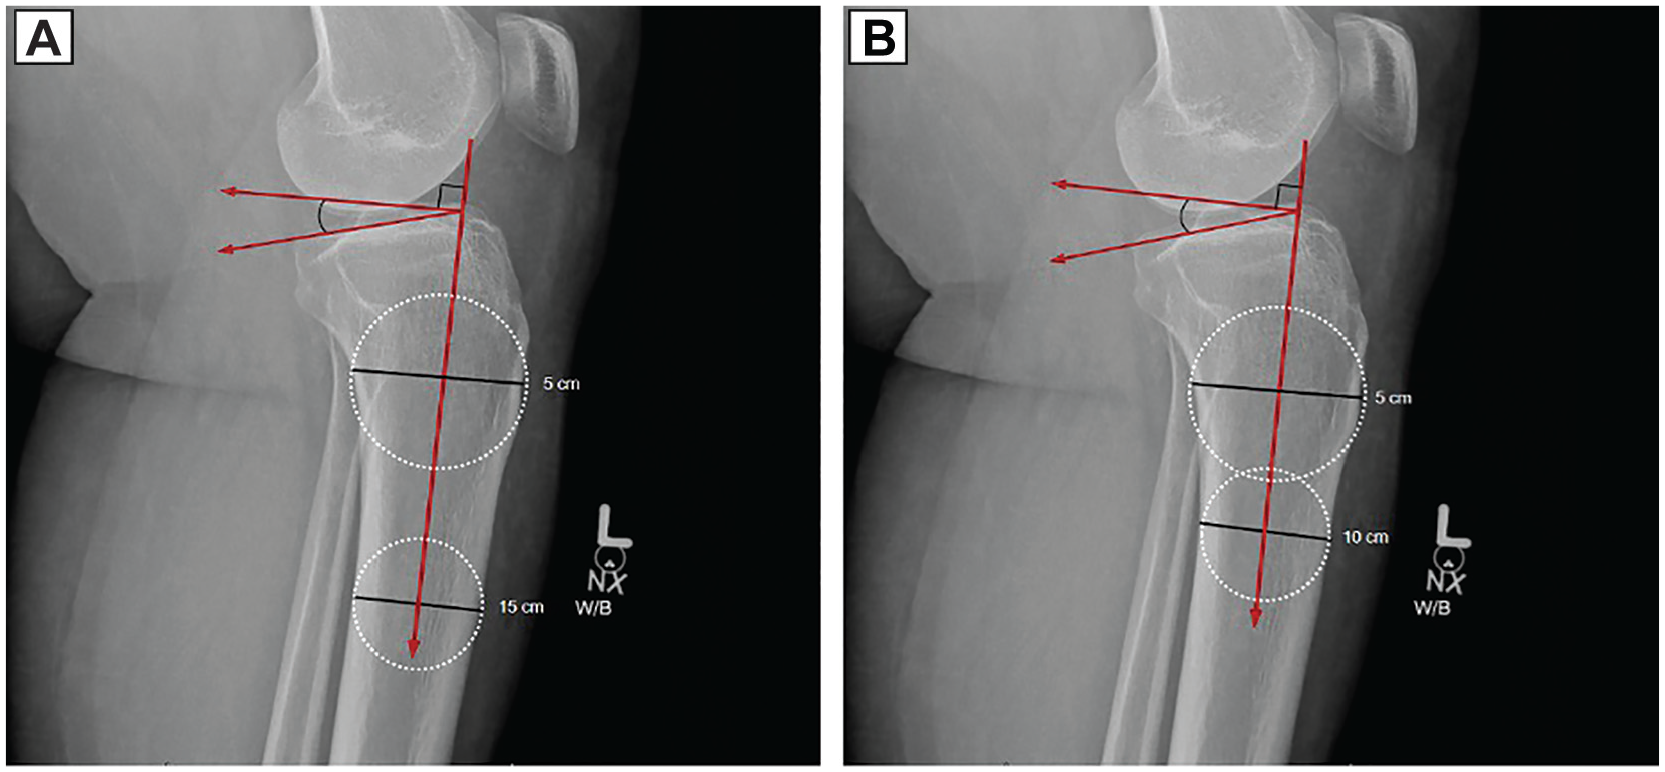
(A) Example of a posterior tibial slope (11.6°) measured with 15 cm distal to the knee joint at the midpoint between the anterior and posterior cortices. (B) Example of a posterior tibial slope modified measurement (12.5°) with a modified anatomic axis centered at 10 cm distal to the knee joint at the midpoint between the anterior and posterior cortices. W/B, weight bearing radiograph.
Validation of Techniques
Measurements were performed by 3 trained reviewers: 2 medical students (C.D.R.H. and D.L.F.) and an orthopaedic surgery sports fellow (H.E.I.). Interrater reliability was quantified via intraclass correlation coefficients (ICCs) using a 2-way mixed-effects model with all 100 patients. Each reviewer made 2 measurements on each lateral knee radiograph, consisting of the 10-mPTS and 15-PTS. Measurements were repeated in a sample of 25 randomly selected patients by 2 reviewers (C.D.R.H. and R.M.R.) who were blinded to the initial measurements and patient information to allow for assessment of intrarater reliability.
Statistical Analysis
To assess the inter- and intrarater reliability of both the 15-PTS and the 10-mPTS methods, ICCs were calculated using a 2-way mixed-effects model with absolute agreement. Interrater reliability was determined using measurements from all 3 raters across 100 lateral knee radiographs, while intrarater reliability was calculated from repeated measurements by 2 reviewers (H.E.I., C.D.R.H.) on 25 randomly selected radiographs after a 7-day washout period. ICC values were interpreted based on established thresholds, with values >0.90 indicating excellent reliability. This allowed us to characterize the mean bias between the 2 methods. A paired-sample t test was employed to determine if the mean difference (MD) significantly deviated from zero. The hypothesis tested whether the observed MD was statistically different from zero, signifying a systematic difference between the 2 methods. Additionally, a 95% CI for the MD was established.
Further, a Bland-Altman analysis was performed to provide a visual representation of the agreement between the 2 methods across their measurement range. The plot displayed the differences between the measurements of the 2 methods against their mean, with the aim of identifying any systematic bias or trends in the data. The MD (bias) and the 95% limits of agreement were also represented on the plot, offering insight into the consistency and variability between the 2 methods.
Linear regression was utilized to evaluate the statistical significance between the standard PTS and 10-mPTS approach, employing a P value of <.05 to indicate statistical significance.
Results
A total of 100 radiographs were included with a mean patient age of 33.1 ± 14.2 years, and the mean BMI was 27.1 ± 6.7 kg/m2 (Table 1). Patient sex distribution was 56 female patients (56%), and radiograph laterality consisted of 49 left (49%). Mean PTS for 15-PTS and 10-mPTS was 9.7°± 1.3° and 10.6°± 1.0°, respectively (P = <.001) and was calculated using all 300 measurements, consisting of 100 patients reviewed by all 3 reviewers. The mean 15-PTS and 10-mPTS for the 100 patients were 9.9°± 3.2° and 10.5°± 3.1° for rater 1, 9.6°± 3.0° and 10.7°± 3.0° for rater 2, and 9.4°± 2.8° and 10.6°± 2.8° for rater 3, respectively. No significant differences were found between the means of 15-mPTS (P = .50) or 10-mPTS (P = .51) between raters.
Cohort Characteristics and Mean Slope Comparisons a

All values reported as mean ± SD unless otherwise specified. BMI, body mass index.
Comparison of means between 15-PTS and 10-mPTS yielded an mean MD of 0.9°, with a 95% CI ranging from 0.8° to 1.0°. The majority of the measurements lay between the 95% limits of agreement of the Bland-Altman analysis (Figure 2), indicating good agreement between the 2 methods. However, a systematic bias of 0.9° was noted, signifying a consistent difference across measurements. This bias was confirmed statistically by the significant MD between the 2 methods.

Bland-Altman plot assessing agreement between 15-PTS and 10-mPTS methods. The plot visualizes the difference against the mean of paired measurements from the 2 methods. The middle dottedline indicates the mean difference (bias) between the methods, while the upper and lower dashed lines represent the 95% limits of agreement. Most data points lie within these limits, suggesting good agreement. However, a few outliers highlight measurements with larger discrepancies. No distinct pattern is observed across the range, indicating the consistency of the differences over the range of measurements.
A simple linear regression conducted to examine the relationship between the 15-PTS and the 10-mPTS revealed a strong positive correlation between the 15-mPTS and 10-mPTS measurements, with a Pearson correlation coefficient of r = 0.942 (P < .001). The linear regression model was statistically significant (F = 776.14; P < .001), with an R2 value of 0.888, indicating that approximately 88.8% of the variance in 10-mPTS can be predicted from the 15-mPTS measurements. The regression coefficient (B) for 15-mPTS was significant (P < .001), confirming that 15-mPTS is a strong predictor of 10-mPTS. The standard error of the estimate was 0.940, indicating a high precision of the model’s predictions. No significant correlation was observed between PTS and age, sex, or BMI (P = .50, P = .34, and P = .16, respectively).
Additionally, a random sample of 100 lateral knee radiographs within the PACS query of lateral knee radiographs resulted in 39% of knee radiographs meeting appropriate visualization requirements to complete the 15-PTS method by including 15 cm distal to the knee joint. Thus, within this sample, 61% did not meet the study’s inclusion criteria due to the lack of ability to visualize 15 cm distal to the knee joint. However, all of the radiographs that were queried and measured did include visualization of the distal tibia 10 cm below the knee joint.
ICC analysis of mean measures using the 15-PTS method was found to be 0.91 (95% CI, 0.87-0.93), indicating excellent reliability. The 10-mPTS approach exhibited a mean measures ICC of 0.93 (95% CI, 0.90-0.95), also denoting excellent reliability.
Discussion
The primary finding of our study indicates that by altering the anatomic axis for determination of PTS from the conventional 15 cm to 10 cm from the joint space results in a mean increase of 0.9° slope. The good agreement between the 2 methods, as illustrated by the Bland-Altman plot (Figure 2), emphasizes the reliability of the 10-mPTS approach. This suggests that the 10-mPTS could offer orthopaedic surgeons a reliable and valid technique to evaluate the tibial slope on standard lateral knee radiographs, particularly in situations where 15 cm distally cannot be visualized. Traditionally, the measurement of PTS employing the proximal anatomic axis necessitates a lateral knee radiograph that encompasses a minimum of 15 cm of the tibial shaft beneath the knee joint. 9 Yet, our database query revealed that a mere 39% of the lateral knee radiographs met this criterion. The rest, a notable 61%, lacked sufficient tibial shaft visibility, rendering them unsuitable for the standard 15-PTS assessment. The reason that 15 cm cannot be visualized in these cases is not entirely clear. Potential reasons for inadequate visualization are multifactorial in these cases and not entirely clear. We speculate that several unintentional factors contribute to this limitation, including human error at the time of imaging—such as inadvertently positioning the imaging field too proximally or failing to capture the necessary length due to oversight or miscommunication regarding the imaging protocol. Patient positioning challenges may also play a role; patients may have difficulty maintaining the ideal position due to discomfort, pain, limited mobility, or anatomic variations, resulting in radiographs that do not capture the full required length of the tibia. Additionally, institutional protocols and radiographic techniques may vary, with some facilities not specifying the inclusion of 15 cm of the tibia, leading to inconsistencies in imaging practices. Physical constraints and patient factors—such as body habitus (eg, obesity), involuntary movements, or inability to tolerate the procedure—can also affect the quality and extent of the radiograph. Furthermore, limitations within the PACS, such as display settings or default zoom levels that inadvertently crop the images, may limit the visible field available for assessment. Such discrepancies underscore significant clinical and research implications, where a considerable number of patients might require additional imaging to obtain the necessary visualization for accurate PTS measurement, leading to increased health care costs and unnecessary exposure to ionizing radiation. This highlights the importance of having a validated alternative method, such as the 10-mPTS approach, to reliably assess PTS when standard imaging criteria are not met.
Such discrepancies underscore the clinical and research implications where a significant number of patients would require additional imaging, accruing additional costs and increasing exposure to ionizing radiation. In light of our findings, the 10-mPTS approach exhibited a variance of <1° relative to the standard 15-PTS technique. Although this deviation is statistically significant, its clinical bearing may be negligible, with minimal influence on therapeutic determinations, as this difference is well within the parameters of the commonly reported standard deviation of performing PTS measurements.9,14,22 This research introduces the 10-mPTS approach as a credible alternative to the established 15-PTS technique, accommodating to a more extensive set of lateral knee radiographs.
In recent literature, the PTS has been spotlighted as instrumental in evaluating the risk of ACL and PCL ruptures. A study by DePhillipo et al 11 found that athletes with both contact and noncontact ACL ruptures were found to have significantly increased PTS when compared with patients without ligament injuries. Similarly, Korthaus et al 18 presented a morphological analysis of PTS in the posterolateral quadrant of the tibia, demonstrating that increased PTSs are found in patients with ACL injuries when compared with healthy controls. An additional study by Bernhardson et al 3 examined the PCL graft forces of 10 cadaveric knees at different tibial slope angles, reporting that as tibial slope decreased, the forces acting upon the PCL increased. Moreover, enhanced PTS has been linked with conditions such as Osgood-Schlatter disease and tibial tubercle fractures.15,24 These studies highlight the necessity for readily obtaining PTS when evaluating the risk of ACL rupture, PCL rupture, and physeal injuries. However, our findings indicate that the conventional approach of measuring PTS, using the 15-PTS method, might not be feasible with commonly available radiographs. The present study illustrates that the 10-mPTS approach serves as a reliable and reproducible alternative when radiographs lack the requisite 15 cm distal to the knee joint.
Our study suggests that the 10-mPTS approach could add benefit to orthopaedic surgeons’ evaluations of PTS by alleviating the limitations posed by the traditional requirement of 15 cm. This reliable and repeatable method holds particular significance for orthopaedic surgeons assessing knee injury risks using standard lateral knee radiographs.
Limitations
There are several limitations of our study that warrant consideration. First, the study was confined to a single academic institution, which may introduce a degree of bias given that radiographic techniques—specifically, the angles and positioning employed for image capture—can vary across different centers. This study may be of limited value to centers where standard protocols are in place to routinely include 15 cm of the tibia distal to the knee joint. However, a protocol of this nature is unlikely, as guidelines for capturing lateral knee radiographs primarily focus on rotational alignment rather than capturing a specific distance from the knee joint.6,13,21,23,25-27 Second, the retrospective design of the study inherently imposes limitations on the types of data that can be collected and analyzed, potentially introducing selection bias or information bias. Last, it remains unclear if the use of lateral knee radiographs to determine PTS using the proximal tibial axis can be extrapolated to be appropriate in patients with known lower extremity deformities such as those with significant anterior tibial bowing because these patients were excluded from the present study.
Conclusion
Our results demonstrate that the 10-mPTS method exhibits less than one degree of deviation compared with the conventional 15-PTS approach. This finding establishes the 10-mPTS as a reliable and comparable alternative for assessing PTS on lateral knee radiographs, particularly when visualization of 15 cm distally is not available. Its applicability extends to both research and clinical settings, offering a solution for measuring PTS in scenarios with limited field visibility.
Footnotes
Final revision submitted December 3, 2024; accepted January 6, 2025.
One or more of the authors has declared the following potential conflict of interest or source of funding: H.E.I. has received education payments from Smith & Nephew. J.F. has received hospitality payments from Globus Medical and Stryker. J.J.E. has received consulting fees from DePuy Synthes Products and Medical Device Business Services; education payments from Arthrex, Gemini Mountain Medical, and Smith & Nephew and a grant from Arthrex and Smith & Nephew. T.G.M. has received consulting fees from Arthrex and education payments from Active Medical. S.K.A. has received consulting fees from Stryker. AOSSM checks author disclosures against the Open Payments Database (OPD). AOSSM has not conducted an independent investigation on the OPD and disclaims any liability or responsibility relating thereto.
Ethical approval for this study was waived by UUOC (9DA16210-465E-4C2E-AF44-FFA44C507DFC).