
Abstract
Background:
Increased posterior tibial slope (PTS) is a risk factor for knee pathology. Accurate measurement of PTS is predicated on a quality lateral knee radiograph; however, little is known about how the quality of the radiograph affects the measured PTS.
Purposes:
To (1) describe a method for measuring malalignment on lateral knee radiographs, (2) assess the effects of malpositioning of the knee on radiographic measures of malalignment, and (3) determine any correlations between malalignment and the measured PTS.
Study Design:
Descriptive laboratory study.
Methods:
Using a setup similar to that of a standard radiology suite, 25 sets of radiographs were taken using 5 sawbone models. Each set included a true lateral view and separate malpositioned radiographs at 5°, 10°, and 15° of adduction, abduction, internal rotation, and external rotation. Malalignment for each radiograph was quantified as the anterior-posterior distance (APD) and proximal-distal distance (PDD) between femoral condyles. The medial PTS was measured in duplicate, and the interrater reliability was calculated.
Results:
The interrater reliability was excellent, with intraclass correlation coefficients of 0.92, 0.91, and 0.96 for the APD, PDD, and PTS, respectively. Malrotation significantly affected the APD (P < .001), with a mean change of 5.6 mm per 5°. Malpositioning in abduction/adduction significantly affected the PDD (P < .001), with a mean change of 5.1 mm per 5°. There was no significant impact of rotation or APD on the PTS. Abduction/adduction did affect the PTS (P < .001) above a threshold of 5° of malpositioning. The PTS decreased as the PDD increased, moving from adduction to abduction (R 2 = 0.5687).
Conclusion:
The measured PTS was more sensitive to malpositioning by abduction/adduction than by malrotation. Malrotation affected the APD, while abduction/adduction affected the PDD. Thus, the accuracy of the measured PTS was compromised more by poorly aligned distal femoral condyles than it was by poorly aligned posterior femoral condyles.
Clinical Relevance:
To minimize the effects of malpositioning, we recommend utilizing radiographs with a |PDD| of <5 mm and an |APD| of <15 mm when measuring the PTS.
Increased posterior tibial slope (PTS) is a known risk factor for both primary and recurrent anterior cruciate ligament (ACL) injuries in adolescents and adults. 1,3,7,12,16,19 It is also thought to be a risk factor for concomitant lateral meniscus root tears and medial meniscal ramp lesions with ACL injury. 2,9,11 Additionally, it has been associated with tibial tubercle fractures and, more recently, with Osgood-Schlatter disease. 5,14,17
Accurate measurement of the PTS is crucial given the relevance of this parameter as it pertains to ligamentous, tendinous, and bony injuries in the knee, as well as its impact on treatment decisions, preoperative planning, and intraoperative execution. Prior studies have detailed methods to measure PTS; however, these methods are predicated on high-quality lateral knee radiographs. 4,8 The majority of studies that measure PTS do not mention assessing the quality of the radiographs. The studies that do assess the quality of radiographs that do often require the posterior femoral condyles to have superimposed 7,12 or have <5 mm of malalignment. 5,10,13 However, only 1 such study 6 elaborates on how malalignment was measured, and there is little to no evidence to support a cutoff of 5 mm. Furthermore, there is a paucity of information on how this malalignment potentially affects the accuracy of the measurement of PTS.
The purposes of this study were as follows: (1) to detail a method for measuring the radiographic anterior-posterior and proximal-distal malalignment between femoral condyles on a lateral radiograph of the knee; (2) to assess the effects of malpositioning (abduction, adduction, internal rotation, and external rotation) of a knee on these radiographic measures of malalignment; and (3) to assess the correlation between the extent of radiographic malalignment and the measured PTS. We hypothesized that adduction and abduction would correlate with the proximal-distal distance (PDD) but not the anterior-posterior distance (APD). Conversely, we hypothesized that internal and external rotation would correlate with the APD but not the PDD. Last, we hypothesized that any malpositioning (abduction, adduction, internal rotation, or external rotation) of ≥5° would result in a statistically significant difference in the tibial slope, as compared with the tibial slope of the knee in a neutral position.
Methods
Preparation of sawbone Models
For this study, 5 sawbone models (Sawbones©) that replicated the computed tomography scans of the left lower extremities of 5 unique patients were obtained. Each sawbone included a full femur and a full tibia, articulated at the knee with stretch cord ligaments. with stretch cord ligaments. The models were secured at knee flexion angles of 25° to 35° using a wooden dowel fastened to the shaft of the femur and the shaft of the tibia using screws, eliminating rotation through the knee joint (Figure 1A). Metal wires were affixed, outlining the medial and lateral femoral condyles, as well as the medial tibial plateau (Figure 1B). The medial femoral condyle was outlined with an 18-gauge wire, while the lateral femoral condyle was outlined with a 22-gauge wire to clearly differentiate the condyles on lateral radiographs.

(A) Each sawbone model was affixed using a wooden dowel in 25° to 35° of knee flexion. (B) The medial femoral condyle of each model was outlined with an 18-gauge wire, while the lateral femoral condyle was outlined with a 22-gauge wire to clearly differentiate the condyles on lateral knee radiographs. Additionally, the medial tibial plateau was contoured using a 22-gauge wire to aid in measuring the medial posterior tibial slope.
Radiograph Acquisition
To obtain radiographs of the sawbone knees, an x-ray tube and an image receptor were placed 150 cm apart in a radiology suite; they remained in this position for all radiographs. This source image receptor distance is well over the minimum of 100 cm recommended to minimize parallax. A positioning template was placed on a table between the x-ray tube and the image receptor as close to the image receptor as possible (Figure 2). The sawbone was placed on the table on top of the positioning template as if a patient were lying on a table in the radiology suite. To obtain lateral knee radiographs, the radiographs were shot across the table, centered around the knee. The positioning template included a circle where the femoral head remained throughout the radiograph collection. A line on the template perpendicular to the x-ray beam was marked 0°. Lines radiated from the circle at 5°, 10°, and 15° of this neutral abduction/adduction line on either side. In this method, the sawbone leg could be abducted or adducted along these lines relative to a fixed “hip,” similar to how a leg may be repositioned on an operating room table or in a radiology suite to obtain a true lateral view of a knee.

To obtain radiographs, a sawbone model was placed on a positioning template between the x-ray beam and image receptor, with the template as close to the image receptor as possible. The femoral head remained fixed within a circle on the template. Following the lines marked on the positioning template, the sawbone leg could then be adducted (–5°, –10°, or –15°) or abducted (5°,10°, or 15°) relative to neutral (0°, perpendicular to the x-ray beam).
For each sawbone model, a true lateral radiograph of the knee was taken. With the model on the neutral (0°) adduction/abduction line, the knee was rotated to produce a complete superimposition of the most posterior and distal aspects of the femoral condyles on the radiograph. In this position, a line was drawn on the tibial plafond of the model from anterior to posterior and perpendicular to the floor to mark this neutral rotation (seen in Figure 1A). Given that the femur and tibia were fixed relative to each other, rotation as seen at the tibial plafond reflected rotation of the knee. Using a goniometer to measure rotation relative to the line demarking neutral rotation, radiographs were taken at 5°, 10°, and 15° of internal and external rotation. The knee was then returned to its neutral rotation. Using the positioning template as previously described, radiographs were next taken at 5°, 10°, and 15° of adduction and abduction, each, along the lines of the template. A complete set of radiographs (N = 13 radiographs) was taken 5 times for each model (Figure 3). Each radiograph included a 25-mm marker ball at the level of the knee joint.

An example set of radiographs, including a true lateral view of the knee (center), maximizing superimposition of the posterior and distal femoral condyles. Radiographs were taken at 5°, 10°, and 15° of adduction and abduction (top row), where adduction is negative and abduction is positive. Radiographs were then taken separately at 5°, 10°, and 15° of internal and external rotation (bottom row), respectively, where internal rotation is negative and external rotation is positive.
Radiographic Measurements
Each radiograph was first calibrated using the marker ball so that subsequent measurements were corrected for magnification. The medial PTS was then measured using the method described by Dejour and Bonnin 4 (Figure 4A). The long axis of the tibia was first drawn, as the line connecting the midpoints of two lines transecting the tibia, one 5 cm from the joint line and one 15 cm from the joint line. A line was then drawn perpendicular to the long axis of the tibia. The medial PTS was then drawn as the angle between this line and a line connecting the anterior and posterior prominences of the medial tibial slope utilizing the wire for reference.

Measurements were taken from the lateral knee radiographs based on a 22-gauge wire outlining the lateral femoral condyle and medial tibial plateau and an 18-gauge wire outlining the medial femoral condyle. (A) The medial PTS (the arc) is measured using a method described by Dejour and Bonnin. 4 (B) APD is measured (represented by the double-ended arrow) using the long axis of the femur and 2 parallel lines tangential to the posterior condyles. (C) The PDD (represented by the double-ended arrow) is measured using the long axis of the femur and 2 perpendicular lines tangential to the distal condyles. APD, anterior-posterior distance; PDD, proximal-distal distance; PTS, posterior tibial slope.
The APD and the PDD were also measured on each radiograph. To measure these distances, a line was drawn down the long axis of the femur. Two lines were drawn parallel to this long axis line and placed as tangents to the most posterior aspect of the medial and lateral femoral condyles. The distance between these lines measuring along a line perpendicular to them was considered the APD (Figure 4B). The APD was considered negative when the medial femoral condyle was posterior to the lateral femoral condyle, representing internal rotation of the knee. The APD was considered positive when the lateral femoral condyle was more posterior, representing external rotation of the knee.
To measure the PDD, 2 lines perpendicular to the long axis of the femur were also drawn and placed as tangents to the most distal aspects of the medial and lateral femoral condyles. The distance between these lines measuring along a line perpendicular to them was considered the PDD (Figure 4C). The PDD was considered negative when the lateral femoral condyle was distal to the medial femoral condyle, representing adduction. The PDD was considered positive when the medial femoral condyle was more distal, representing abduction. All measurements were performed in duplicate by 2 authors (E.C.B. and J.E.C.), and the interrater reliability of the measurements was calculated.
Statistical Analysis
A 2-way, random-effects, absolute agreement, intraclass correlation coefficient (ICC) was used to assess the interrater reliability of the radiographic measurements. Then, a repeated-measures analysis of variance (ANOVA) was performed to compare the 5 sets of data to identify any discrepancy in data collection. Multiple 1-way ANOVA tests with post hoc Tukey Honestly Significant Difference (HSD) tests were performed to identify the impact of rotation, adduction, and abduction on the APD, PPD, and PTS. Finally, linear regressions were utilized to correlate changes in rotation or abduction/adduction with changes in the APD or PDD as well as to correlate changes in the APD or PDD with changes in the measured PTS. SPSS (IBM, Version 23) was utilized to perform all statistical calculations. Statistical significance was set at P < .05.
Results
The ICC values were 0.92 (95% CI, 0.90-0.95), 0.91 (95% CI, 0.89-0.94), and 0.96 (95% CI, 0.94-0.97) for the APD, PDD, and PTS, respectively, indicating excellent interrater reliability. Repeated-measures ANOVA was not significant for assessments of abduction/adduction and internal/external rotation among the 5 trials for each individual sawbone models, indicating that there was no abnormal variation despite using the same 5 sawbones for trials. The mean APD, PDD, and tibial slope for each degree of rotation and each degree of abduction/adduction are shown in Tables 1 and 2, respectively.
Malpositioning by Rotation a
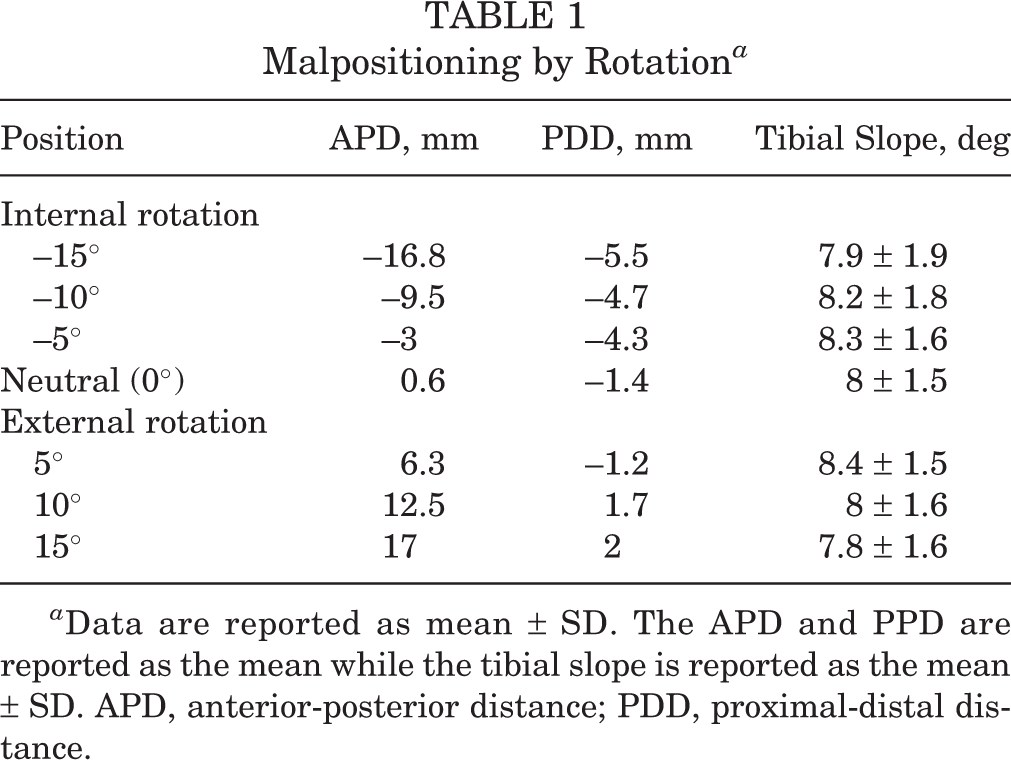
a Data are reported as mean ± SD. The APD and PPD are reported as the mean while the tibial slope is reported as the mean ± SD. APD, anterior-posterior distance; PDD, proximal-distal distance.
Malpositioning by Adduction or Abduction a

a Data are reported as mean ± SD. The APD and PPD are reported as the mean while the tibial slope is reported as the mean ± SD. APD, anterior-posterior distance; PDD, proximal-distal distance.
Regarding rotation, a statistically significant difference in the ADP was observed between groups with malrotation (F = 92.2; P < .001). A 5° change in rotation led to a mean change of 5.6 mm in the APD (Table 1, Figure 5). A statistically significant between-groups difference was also observed in the PDD at different degrees of internal and external rotation (F = 66.3; P < .001). A 5° change in rotation led to a mean change of 1.3 mm in the PDD. A 10° change in rotation led to a mean change of 2.8 mm in the PDD (Table 1). There was no statistically significant difference in the PTS between groups based on rotation (F = 1; P = .449). Within the malrotation groups, there was no significant correlation between APD and PTS on linear regression (R 2 = 0.0147).
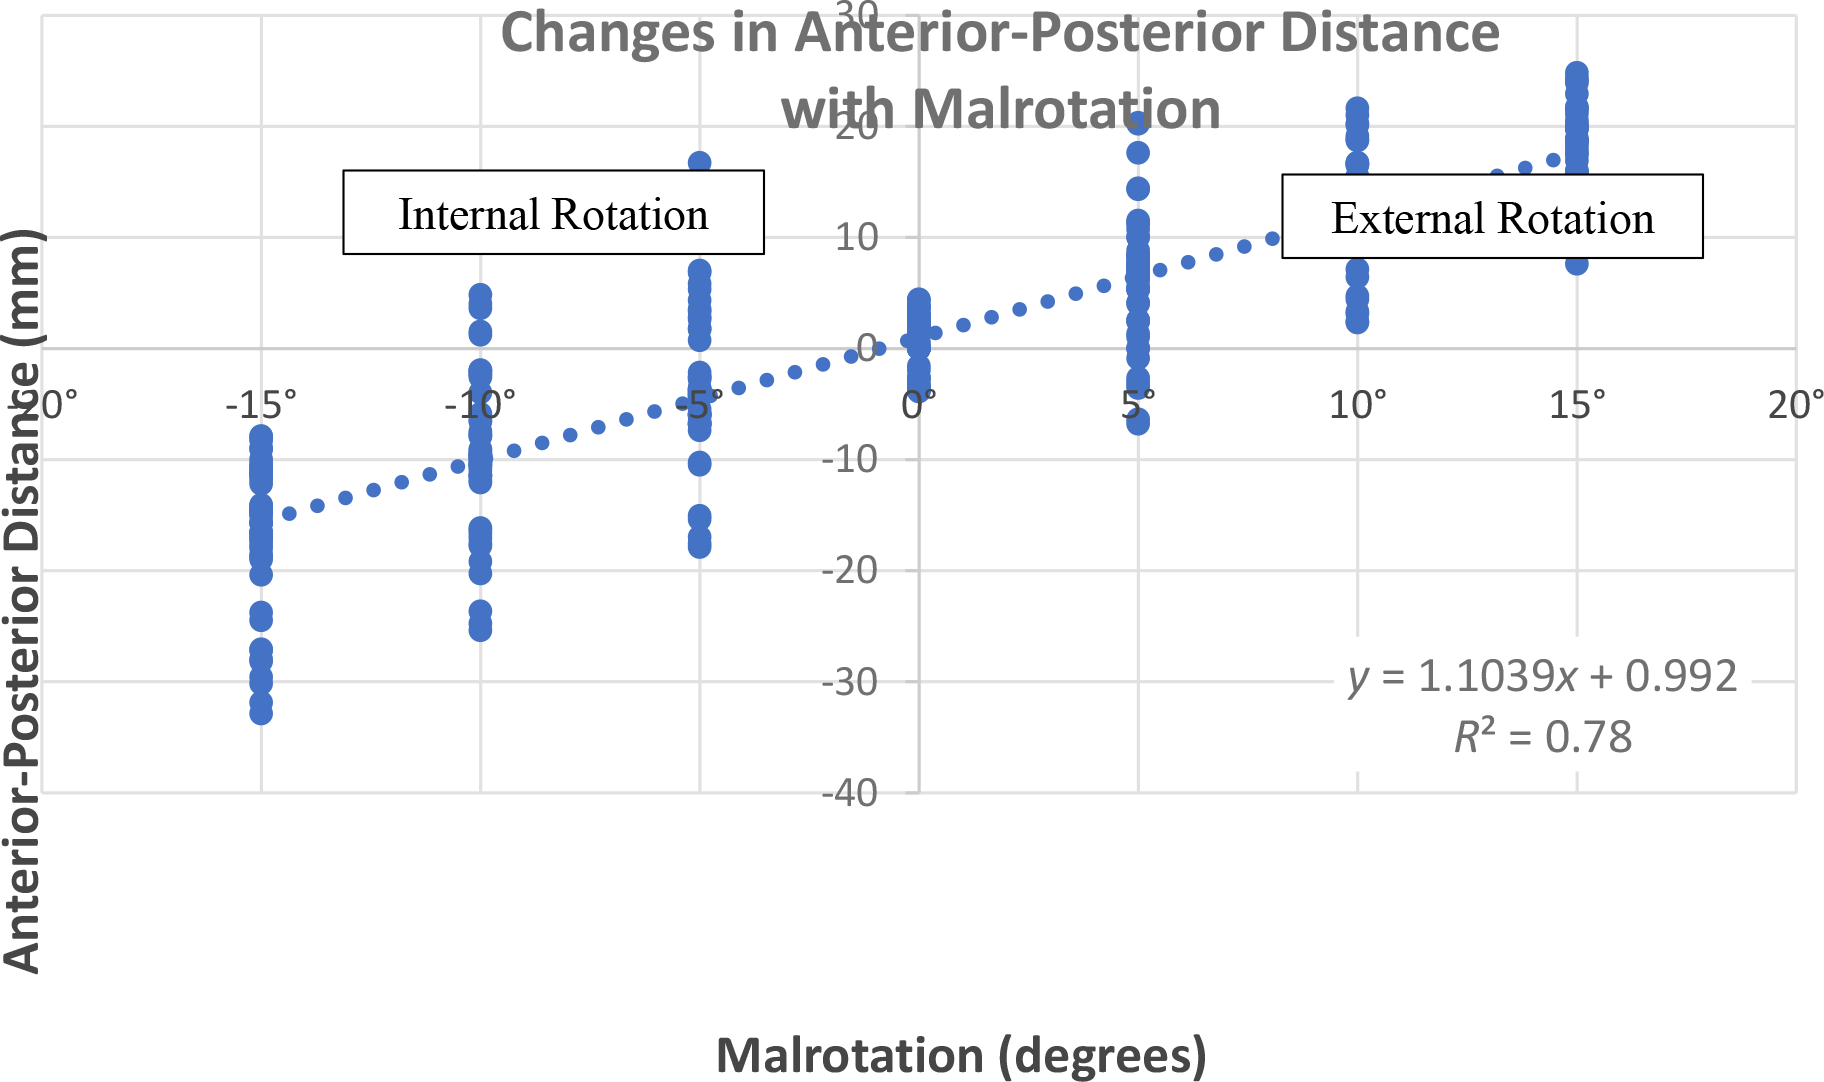
The APD increased as the knee was moved from internal rotation (negative malrotation) to external rotation (positive malrotation) according to the equation y = 1.1039x + 0.992 (R 2 = 0.7842), where x is the degrees of malrotation and y is the APD. APD, anterior-posterior distance.
Regarding abduction/adduction, there were no statistically significant differences in the APD between any 2 groups of malpositioning (F = 1.3; P = .31). However, there was a statistically significant difference in the PDD between groups (F = 85.3; P < .001). The Tukey HSD test for multiple comparisons revealed significant differences for all comparisons except between 10° of adduction and 15° of adduction, with every 5° change in abduction/adduction leading to a mean change of 5.1 mm in the PDD (Table 2, Figure 6).

The PDD increased as the knee was moved from adduction (negative malpositioning) to abduction (positive malpositioning) according to the equation y = 1.0808x – 0.2871 (R 2 = 0.8665), where x is the degrees of malpositioning and y is the PDD. PDD, proximal-distal distance.
There was also a significant difference in the measured tibial slopes between abduction/adduction groups (F = 113.7; P < .001). The Tukey HSD test for multiple comparisons indicated no difference between the tibial slope at 5° of adduction or 5° of abduction as compared with neutral (0°). However, there was a significant difference for 10° or more of adduction or abduction as compared with neutral (P < .001 for all comparisons), resulting in a ≥3° change in the mean tibial slope. Within the abduction/adduction groups, the PTS decreased as the PDD increased according to the equation y = –0.2813x + 8.3021 (R 2 = 0.5687), where x is the PDD in millimeters and y is the tibial slope (Figure 7).

The PTS decreased as the PDD increased according to the equation y = -0.2813x + 8.3021 (R 2 = 0.5687), where x is the PDD and y is the PTS. A negative PDD reflects adduction, while a positive PDD reflects abduction. PDD, proximal distal distance; PTS, posterior tibial slope.
Discussion
This study detailed a methodology to quantify malalignment seen on lateral knee radiographs then evaluated the correlation between the malpositioning of the knee in the radiology suite and the malalignment it produces on imaging. Finally, correlations between radiographic malalignment and the measured PTS were explored to provide guidance on when imperfect radiographs are acceptable and when repeat imaging and the associated additional radiation are warranted.
As hypothesized, malpositioning in adduction or abduction correlates closely with changes in the PDD, while malpositioning in internal or external rotation correlates closely with changes in the APD. However, the effects of malpositioning on the measured PTS were not as predicted. Malrotation of up to 15° from neutral had no significant impact on the measured PTS, while adduction or abduction of 10° or more caused a clinically significant change of ≥3° in the PTS, as compared with the PTS in neutral rotation.
The majority of studies on PTS do not comment on the quality of radiographs included, or they simply state that posterior femoral condyles must be 7,12 “properly” or “perfectly” superimposed. 10 It is difficult to imagine every radiograph has complete superimposition of the posterior condyles, and a few studies have stated that they did accept up to 5 mm of “malalignment” between the posterior femoral condyles. 5,10,13 To date, only 1 study has detailed how this radiographic malalignment was measured. Gwinner et al 6 defined malalignment to be the distance between tangents to the posterior femoral condyles that were perpendicular to the joint line. While malalignment between the posterior aspects of the femoral condyles is assessed, malalignment between the distal aspects of the femoral condyles is not. This study describes a methodology for measuring malalignment using the long axis of the femur, which allows quantification of malalignment in both dimensions (anterior-posterior and proximal-distal). This method was found to be highly reproducible across raters, with an ICC of 0.92 for the APD and 0.91 for the PDD.
Our study also evaluated the effects of malpositioning of the knee (ie, rotation or abduction/adduction) on these measurements of radiographic malalignment, as well as the effects of malpositioning and radiographic malalignment on the measured PTS. Malpositioning by abducting or adducting the knee significantly impacted the PDD (Figures 3 and 6, Table 2), while malrotation significantly impacted the APD (Figures 3 and 5, Table 1). For both, it can be estimated that 1° of malpositioning results in 1 to 1.1 mm of malalignment. Malrotation did also significantly affect the PDD, although with only around a 0.26-mm change per 1° change in rotation. Similar though not statistically significant trends were seen between abduction/adduciton and APD. The sawbone knees were positioned by hand. Despite the use of a reference guide and goniometer, it is possible that some rotation was systematically introduced as the knees were moved through various degrees of abduction/adduction, and vice versa. It is also possible that there is a weaker association between these other factors. Rotation seems to be the driving factor of radiographic anterior-posterior malalignment, while abduction/adduction appears to be the driving factor of proximal-distal malalignment.
While understanding the impacts of malpositioning on radiographic malalignment may be useful during the process of taking radiographs, understanding the implications on radiographic measurements, such as the PTS, may be more clinically relevant. Historically, the quality of a lateral knee radiograph has been judged by the overlap of the posterior femoral condyles, quantified here as the APD. However, this study found no significant difference in the PTS based on malrotation (F = 1; P = .449) and no significant correlation between the ADP and the PTS as the sawbone knees were rotated between 15° of internal rotation and 15° of external rotation (R 2 = 0.0147). This is in contrast to 2 other studies that have previously assessed the effect of rotation on the PTS. Utzschneider et al 15 and Weinberg et al 18 both found the PTS to be at its nadir in neutral rotation and to increase with both internal and external rotation. In the study by Utzschneider et al, the PTS increased from 9.4° in neutral up to 12.3° and 12.2° at 40° of internal and external rotation, respectively. The data in this study do not follow that trend. However, it is possible that 15° of malrotation is simply not enough malrotation to reproduce this effect and to affect the accuracy of the measured PTS.
In this study, a 15° malrotation produced a mean distance of >15 mm between the posterior femoral condyles. As this degree of malrotation had no significant effect on the measured PTS, we suggest that radiographs with <15° of malrotation—that is, those with an |APD| of <15 mm—are of sufficient quality for measuring the PTS. Interestingly, multiple studies 5,6,10,13 cite a much more stringent cut-off of 5 mm, but only Gwinner et al6 cite supporting data or a rationale for this value. They found that there was a higher likelihood for the PTS measured by 2 raters to be ≥2° different when there was a ≥5-mm distance between the posterior femoral condyles, suggesting that the interrater reliability decreases for radiographs with more malrotation. However, the study did not report the absolute or relative PTS at different degrees of malrotation. Given that there was excellent interrater reliability across all measurements in this study, we suggest that the higher cutoff |APD| of <15 mm is adequate. This higher cutoff allows for more radiographs to be included in research studies, without compromising the accuracy of the measured PTS.
While overlap of the posterior femoral condyles is commonly commented on when assessing the quality of a lateral knee radiograph, overlap of the distal femoral condyles is less commonly considered. However, the PTS does appear to be influenced by the PDD (ie, the distance between the distal condyles). As the limb moves from adduction to adduction, the PTS decreases while the PDD increases (see Figure 7). In our analysis, there was no difference between the measured PTS in neutral and that measured in 5° of either abduction or adduction, which correlated with a mean |PDD| of 4.7 and 6.7 mm, respectively. However, there were significant differences of ≥3° between the PTS measured in neutral rotation and the PTS measured in ≥10° of abduction or adduction. On linear regression, this relationship follows the equation y = -0.2813x + 8.3021 (y = PTS, x = PDD; R 2 = 0.5687). Accordingly, a 5-mm PDD would result in around a 1.4° change in the PTS. Therefore, we recommend a PDD cutoff of <5 mm when assessing lateral knee radiographs to measure the PTS.
Limitations
As the study design reflects that of clinical radiographs obtained in a radiology suite, caution should be taken extrapolating these findings to fluoroscopy, given differences in the source image receptor distances and the implications on the potential for parallax. The sample size was small, as only 5 unique sawbone models were utilized. However, the objective of this study was to evaluate the effect of positioning on radiographic measurements. Limiting the number of sawbone models thus limited anatomic variability among different knees and the impact of anatomic variability on our results. Additional studies could further investigate whether malpositioning has a greater impact on knees with larger PTS. As previously mentioned, a guide and a goniometer were used; however, positioning the sawbone model by hand may have introduced some amount of human error. Malpositioning by rotation and abduction/adduction were evaluated separately in this study, although in actuality it can occur concomitantly in the clinical setting. Further studies may help elucidate the summative effects of malpositioning in multiple dimensions. Malpositioning was limited to a maximum of 15°, although significant changes in the PTS may have occurred if malpositioning were continued to >15°. However, 15° of malpositioning created significant distances between the femoral condyles. We assume that most radiographs with this degree of offset would be retaken rather than saved for clinical purposes. Last, the evaluation of the PTS was limited to the medial PTS. It can be assumed that the lateral PTS changes in a similar manner, although exact values cannot be extrapolated from this study. Indeed, Weinberg et al 18 and Utzschneider et al 15 found the medial PTS and the lateral PTS followed the same trends through various degrees of malrotation.
Conclusion
The methodology presented in this study to measure malalignment can be used to assess the quality of lateral knee radiographs. For radiographs with ≤15° of malpositioning, the measured PTS was most affected by abduction/adduction, with the PTS decreasing as the PDD increases, in other words, moving from adduction to abduction. The measured PTS was not significantly affected by malrotation. We recommend utilizing radiographs with an |APD| of <15 mm and a |PDD| of <5 mm when measuring the PTS to limit the effects of malpositioning on the accuracy of the measurement.
Footnotes
Final revision submitted January 7, 2023; accepted January 27, 2023.
One or more of the authors has declared the following potential conflict of interest or source of funding: The sawbone models used in this study were supplied by Stryker. L.H.R. has received education payments and nonconsulting fees from Arthrex; consulting fees from GLG Consulting, Guidepoint, and Relief Health; honoraria from AcelRX Pharm; and hospitality payments from Smith & Nephew. AOSSM checks author disclosures against the Open Payments Database (OPD). AOSSM has not conducted an independent investigation on the OPD and disclaims any liability or responsibility relating thereto.
Ethical approval was not sought for the present study.