
Abstract
Background:
Distal tibial deformities are not assessed using the proximal anatomical axis (PAA) to determine the posterior tibial slope (PTS). Therefore, it seems advantageous to measure PTS on full-length lateral tibial radiographs using the mechanical axis (MA).
Purposes:
To (1) compare the PTS measurements using the MA and the PAA and (2) determine whether using the PAA fails to detect a certain number of significantly elevated PTS values compared with using the MA.
Study Design:
Cohort study (Diagnosis); Level of evidence, 3.
Methods:
Full-length lateral tibial radiographs of 218 consecutive cases were reviewed. Radiographs were checked for malrotation. Therefore, the distance between the posterior tibial condyles was measured in millimeters. Patients with a difference of ≥7 mm between the posterior tibial condyles were excluded, leaving 196 cases for the final statistical analysis. The PTS was measured using the MA and the PAA. Differences between these 2 techniques were analyzed. The sensitivity and specificity of the PAA as a screening method for pathological PTS were calculated, with the MA as the standard for comparison. Four subgroups were formed, all with PAA <12° and different lower limits for the MA: group 1, MA ≥10°; group 2, MA ≥10.5°; group 3, MA ≥11°; and group 4, MA ≥11.5°.
Results:
Radiographs with ≥7 mm between the posterior tibial condyles showed an increased inconsistency between the PTS measurement with the MA and the PAA. In the group with a distance of <7 mm between the posterior tibial condyles (n = 196), the mean PTS measured with the MA was 9.4°± 3.8° (range, 0.4° to 21.9°), and the mean PTS was 10.5°± 3.5° (range, 1.7° to 20.9°) according to the PAA. The mean difference in PTS between the PAA and the MA was 1.1°± 1.2° (range, –2.4° to 4.1°; P < .001). Group 1 had a sensitivity of 73% and specificity of 98%; group 2, sensitivity of 84% and specificity of 97%; group 3, sensitivity of 87% and specificity of 93%; and group 4, sensitivity of 95% and specificity of 89%.
Conclusion:
Measuring the PTS using the MA was advantageous, as the measurement with the PAA did not correctly identify all cases with sagittal alignment changes. The proportion of patients with pathologically increased PTS not identified with the proximal anatomical measurement, reflected by the sensitivity, depended on the threshold value defined for the MA. Lateral radiographs, showing an increased distance between the posterior tibial condyles, indicated malrotation of the tibia leading to measurement inaccuracy.
Keywords
Bony malalignment is an important factor influencing the outcome of ligament reconstruction surgery around the knee. 26 The alignment in the sagittal plane has recently gained substantial interest. The posterior tibial slope (PTS) was proven to play a key role in ligament reconstructive surgeries, such as anterior cruciate ligament (ACL) and posterior cruciate ligament reconstruction.2,3,7,23,25,28 PTS abnormalities were shown to result in detrimental biomechanical changes.12,24
The PTS describes the angulation of the tibiofemoral joint line in the sagittal plane. Technically, the PTS is defined as the angle between the tibial plateau (joint line) and the sagittal shaft axis of the tibia. Different methods to measure the PTS have been described. These different methods all use a line tangential to the medial tibial plateau as a reference. However, different shaft axes are used to calculate the PTS. The most common techniques involve using the proximal anatomical axis (PAA), anatomical axis (AA), or the mechanical axis (MA) of the tibia.11,27,30
In patients undergoing ACL reconstruction (ACLR), an increased PTS is associated with higher rates of ACL graft deficiency and ACL graft retears.14,20,23,28 For the PAA, a cutoff of 12° for the PTS has been published in several previous studies, describing values exceeding this threshold as a risk factor.19,21,23 These findings were discussed controversially by other publications. Some suggested even lower threshold values,8,10 while others questioned the role of increased PTS values as a relevant risk factor.6,16 For the PTS measurement using the MA, no cutoff values have been described. There is a mean difference of 1.2° when comparing the mean difference of the PTS between the MA and the PAA from several previously published studies.9,11,15,30 The measurement with the PAA is widely used, as this method can be measured on short lateral radiographs in daily clinical routine. In comparison, the technique to measure the MA has greater technical requirements, as the whole lateral tibia must be captured on the lateral radiograph, making this technique less available and more time-consuming. An advantage of the MA is the possibility to evaluate the overall alignment of the tibia in the sagittal plane so that a distal malalignment can also be detected.
In daily clinical routine, an exact and reliable measurement of the PTS is crucial for managing cases of ACL deficiency and planning osteotomies for PTS correction. The intra- and interrater agreement for the different methods is high. 30 Measuring the PTS using a long tibial axis, however, has resulted in systematic differences when compared with measurements using a proximal tibial axis.9,11,15 Most values and thresholds reported in the literature are generally based on the PAA. It seems, however, reasonable to use the MA to estimate the mechanical loading conditions, analogous to the use of the MA in the frontal plane.
Therefore, the purposes of this study were to (1) compare the measurement of the PTS using the MA and the PAA and (2) determine whether using the PAA fails to detect a certain number of significantly elevated PTS values compared with using the MA. We hypothesized that measuring the PTS using the PAA would not identify all cases with distally induced sagittal alignment changes resulting in noticeably increased PTS compared with measuring the MA.
Methods
Data Selection
A series of 218 consecutive full-length lateral tibial radiographs were taken between January 1, 2022, and December 31, 2022. These radiographs were taken primarily from a Caucasian, Central European population. As malrotation of the tibia has been described to have a major impact on PTS measurement,18,29 the lateral radiographs were checked for rotational alignment. In the first analysis, the tibial overlapping was measured as the distance (in mm) between the most posterior aspect of the medial tibial condyle and the most posterior aspect of the lateral tibial condyle (Figure 2). It was hypothesized that a difference of ≥7 mm between the posterior tibial condyles would result in measurement inaccuracy. Excluded were radiographs without clear visualization of the joint line or without well-aligned medial and lateral tibial plateau, indicated by the sclerotic lines. After excluding radiographs not meeting the criteria described from further statistical analysis, data from 196 radiographs were left for retrospective comparison of the PTS measured either with the PAA or the MA. All patients who were included presented for ACLR. The radiograph selection process is displayed in Figure 1.
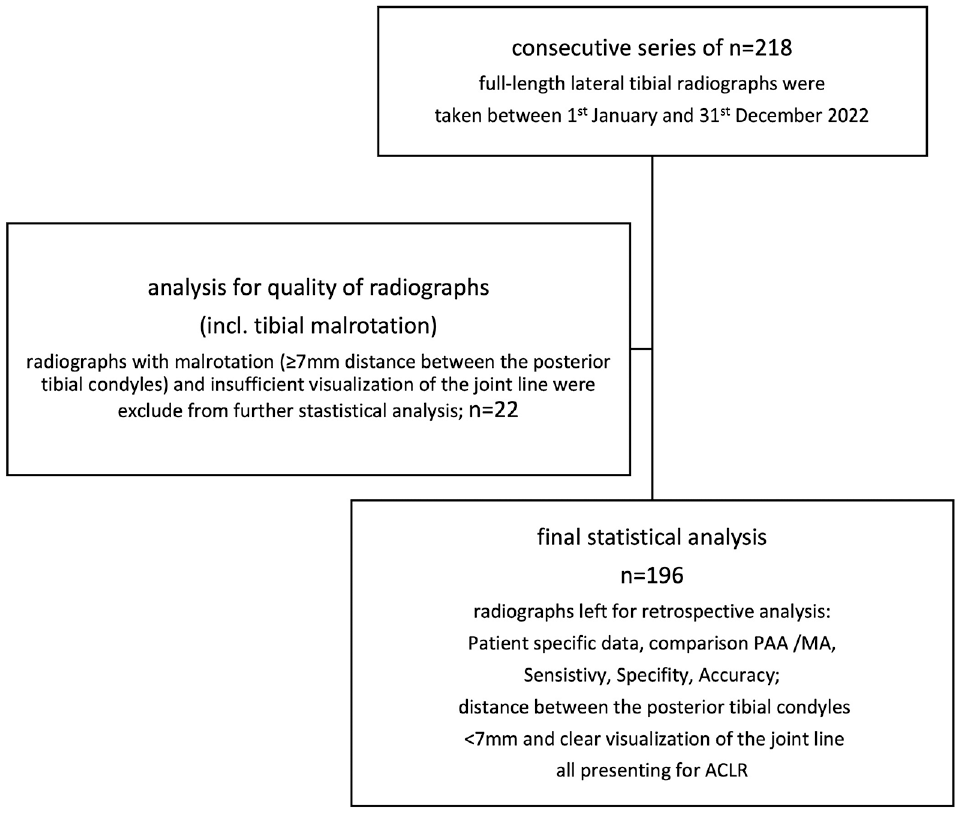
Flowchart of patient selection. ACLR, anterior cruciate ligament reconstruction; incl., including; MA, mechanical axis; PAA, proximal anatomical axis.
Ethical approval was given by the local institutional review board (No. 03-2023).
Radiographic Measurement
Radiographs were taken with patients in a standing position, with a straight lateral beam path. Two x-rays were automatically captured to avoid projection errors due to beam divergence: one x-ray with the central ray centered on the tibial joint line, and another x-ray centered on the distal third of the tibia. The radiographs were then automatically stitched together to display the full length of the tibia. An x-ray reference sphere with a diameter of 25 mm was used. The PTS was measured using the MA and PAA as references, as displayed in Figure 2. The MA of the tibia in the sagittal plane is measured as a line connecting the midpoint of the medial tibial plateau and the midpoint of the tibial plafond. 30 The angle between a line tangential to the medial tibial plateau and a line orthogonal to the MA expresses the PTS. The PAA, as described by Yoo et al, 30 is defined as a line connecting the midpoint of the tibial shaft 5 and 15 cm below the joint line; the angle between a line tangential to the medial tibial plateau and a line orthogonal to the PAA expresses the PTS. 30 A circle tool that automatically displayed the midpoint was used to determine the midpoint of the medial tibial plateau, the tibial plafond, and the tibial shaft for radiographic measurements. Radiographs were measured twice, with the surgeon blinded to the previous result and at least 6 weeks apart, to estimate intraobserver reliability. All radiographs were analyzed by a trained orthopaedic knee surgeon (W.B.). To estimate interobserver reliability, the radiographs were measured by a second trained orthopaedic surgeon (P.M.). The measurements were performed with the Picture Archiving and Communication Systems (Xero Viewer; Agfa Health Care).

Different methods for measuring the PTS on a lateral radiograph: red angle, measurement of the PTS using the MA; green angle, measurement of the PTS using the PAA. (A) Rotational alignment of posterior tibial condyles with a difference of <7 mm. (B) Increased internal tibial rotation with ≥7 mm between the posterior tibial condyles. MA, mechanical axis; PAA, proximal anatomical axis; PTS, posterior tibial slope.
The data obtained were analyzed for differences in PTS configuration according to the different measurement techniques.
Statistical Analysis
Statistical analysis was performed with SPSS for Windows Version 28 (IBM Corp), and descriptive data were stated as the mean ± standard deviation (range). For parametric data, a 2-tailed t test was used. The intra- and interobserver reliability were calculated for measuring the PTS with the PAA and the MA using the intraclass correlation coefficient (ICC). According to the ICC values, the reliability was defined as poor (<0.5), moderate (0.5 ≤ ICC < 0.75), good (0.75 ≤ ICC < 0.90), or excellent (≥0.90). A linear correlation (Pearson correlation) was applied to detect correlations between the measurement methods.
In the current literature, no specific pathological threshold values have been published for the PTS measured using the MA. For the measurement with the PAA, PTS values ≥12° were interpreted as pathologic, as several studies have reported an increased risk for ACL graft insufficiency or ACL graft rerupture in patients with values exceeding this cutoff.23,28 In the group with a distance of <7 mm between the posterior tibial condyles, different subgroups were defined with a lower limit of the PTS from which the PTS was assumed to be pathological when using the MA: group 1, PTS with MA ≥10° and PAA <12°; group 2, PTS with MA ≥10.5° and PAA <12°; group 3, PTS with MA ≥11° and PAA <12°; and group 4, PTS with MA ≥11.5° and PAA <12°. Moreover, the sensitivity, specificity, and accuracy of the PAA for screening of a pathological PTS (≥12°) were determined for each of these groups using the different thresholds of the MA as a standard for comparison.
Results
Radiographs with a distance between the posterior tibial condyles of ≥7 mm showed a mean difference between the measurement with the PAA and the MA of 1.9°± 1.4° (n = 22); the mean difference for PTS between the PAA and the MA with overlapping of posterior tibial condyles of <7 mm was 1.1°± 1.2° (n = 196). The difference between the 2 groups was significant (P = .001). In the group with <7 mm distance between the posterior tibial condyles, the median difference was 1.1° and in 25% the difference exceeded 2° with a maximum of 4.1°. When the distance was ≥7 mm, the median value was 1.9° and in 50% the difference in the PTS exceeded 2° with a maximum of 5.1°. Radiographs with ≥7 mm were excluded from further statistical analysis.
Patient-specific data are displayed in Table 1. The results of radiographic measurements are displayed in Table 2. The mean difference of the PTS between the MA and PAA was 1.1°± 1.2° (range, –2.4° to 4.1°). No significant differences in the PTS could be detected between women and men. In 16% of the cases (n = 32), the PTS measured with the PAA showed smaller values, compared with the PTS according to the MA. In these 32 cases, the PTS (MA) showed values in the range between 9° and 14° in 56% of patients (n = 18).
Patient-Specific Data a

Data presented as mean ± SD (range) or n (%) unless otherwise indicated.
Mean PTS Values a
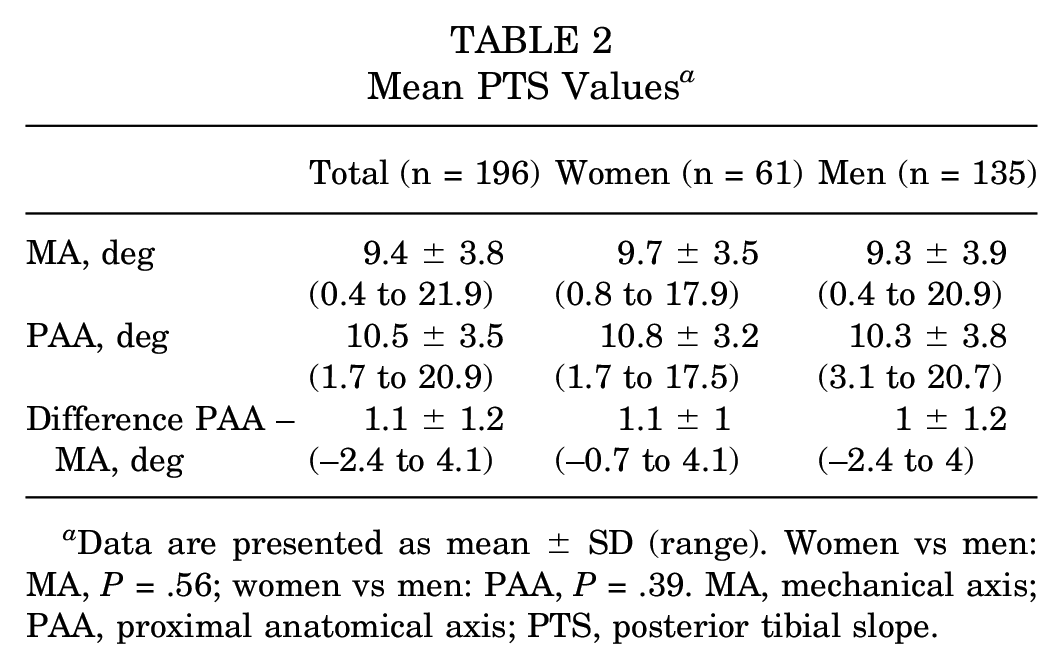
Data are presented as mean ± SD (range). Women vs men: MA, P = .56; women vs men: PAA, P = .39. MA, mechanical axis; PAA, proximal anatomical axis; PTS, posterior tibial slope.
The PTS measured with the MA and the PAA showed a strong linear correlation (Pearson r = 0.95; P < .001). With increasing PTS values measured with the MA, the difference between the PAA and the MA showed a tendency to decrease.
An excellent intraobserver reliability of 0.97 (95% CI, 0.96-0.98) was found using the ICC for the PTS measurement with the MA. The interobserver reliability was excellent with an ICC of 0.95 (95% CI, 0.93-0.96) for the PTS measurement with the MA. An excellent intraobserver reliability of 0.96 (95% CI, 0.95-0.97) was found using the ICC for the PTS measurement with the PAA. The interobserver reliability was excellent with an ICC of 0.91 (95% CI, 0.88-0.93) for the PTS measurement with the PAA.
The sensitivity, specificity, and accuracy for identifying pathological PTS values using the PAA for the different subgroups compared with the MA are shown in Table 3.
Sensitivity, Specificity, and Accuracy for Detecting Pathologic PTS Values With PAA Versus MA a

MA, mechanical axis; PAA, proximal anatomical axis; PTS, posterior tibial slope.
Discussion
The key finding of this study indicates that using the MA for measuring PTS is advantageous in reliably screening for pathological PTS values. Notably, the relationship between PTS measurements obtained from the PAA and the MA reveals outliers, and the observed differences are not consistently uniform. As the mean difference between the PAA and MA for PTS values that were analyzed in different publications ranges from 0.2° to 2.3°, with a mean difference of 1.2° (median, 1.1°),9,11,15,30 the subgroups were designed to cover the area of PTS values measured with the MA from 10° to 11.5°. To the best of our knowledge, no cutoff values have been defined for PTS measurements of the MA in terms of risk of failure after ACLR. PTS values measured with the PAA were defined to be pathological when exceeding 12°, resulting in an increased risk for failure of ACLR.1,14,23,28 In consequence, it could be assumed that there must exist a corresponding range of values from where the PTS has a pathological influence when measured with the MA. In the data provided in this analysis, it was not possible to declare a clear cutoff, but it was assumed that the PTS, when measured with the MA, can be interpreted as pathological when passing the 10.5° to 11° threshold. The subgroups aimed to cover this area of interest for PTS values measured with the MA as a reference. In this setting, when defining 10.5° or 11° as the pathological threshold for the PTS measured with the MA, 16% and 13%, respectively, would have been overlooked, as the PTS measured with the PA was <12°. Even with a comparatively high threshold of 11.5° (PTS with MA), 5% of the patients would have shown PTS values of <12° measured with the PAA. Therefore, screening for pathological PTS with techniques using the PAA on lateral radiographs of the tibia cannot be recommended, as this method failed to identify all cases with noticeably increased PTS values with the MA. In 16% of patients, the PTS measured with the MA showed even higher PTS values compared with the measurement according to the PAA. The presence of outliers, as indicated by the inconsistency in differences between the MA and PAA measurements, further supports the hypothesis that the PAA does not represent a reliable indicator for the relevant mechanical loading conditions of the tibia in the sagittal plane. The differences between the 2 methods could result from deformities of the distal tibia. A distal malalignment can have a major impact on the overall tibial alignment in the sagittal plane and cannot be detected on short lateral radiographs. This is in line with the findings of Hees et al, 15 as the PTS measured with the PAA tends to underestimate the PTS due to a tibial bowing, in contrast to measurements using the MA. Further, the tibial bowing angle correlated with the PTS referenced to the MA in a sagittal long lateral tibial radiograph. A comparable observation was evident in the data presented in the present investigation. With increasing PTS values for the MA, the difference between the PTS measured by the MA and the PAA showed a tendency to decrease, which may result from tibial bowing. Although the tibial bowing was not measured explicitly, the obtained measurements, as stated above, can be interpreted as pointing in this direction. Increasing tibial bowing will lead to an increasing dorsally directed angulation of the PAA in the lateral radiograph. Consequently, because of the change in the PAA, while the reference to the medial tibial plateau remains the same, the PTS will decrease. The measurement with the MA is not influenced by this effect. Because values of the PTS measured with the MA are usually lower, the PTS values of the PAA and the MA will converge.
Comparable data about differences between various reference axes for PTS measurement were published in a previous study. Dean et al 9 compared the values for the PTS between the measurement with the PAA, AA, and MA on full-length lateral tibial radiographs. When comparing the PAA and the AA in 21% of cases, the difference in PTS values was >2°; a difference of ≥2° was detected in 55% of cases when comparing PTS values measured with the PAA or the MA as a reference. This underlines the data presented in our study. An isolated measurement of the PAA for the screening of increased PTS values does not allow for the prediction of mechanical loading conditions in the sagittal plane, as this could be better estimated with the lateral MA of the tibia. Therefore, we recommend establishing the measurement of the MA on full-length lateral tibial radiographs as a standard for PTS measurement. To our interpretation, the mechanical loading conditions are of utmost importance—particularly when planning a corrective osteotomy. Comparable to the alignment analysis in the frontal plane, where the usage of the MA represents the gold standard, deformity analysis in the sagittal plane should also be performed using the MA as a reference for PTS measurement. This will decrease the risk of missing out on patients with deformities of the lower tibia influencing the PTS. In addition, when planning an osteotomy for PTS correction, a full-length lateral tibial radiograph is not dispensable to assess the consequences of the osteotomy for the sagittal plane alignment. An under- or overestimation of the PTS could lead to an under- or overcorrection in the case of slope-reducing osteotomy.
It remains unclear to what extent increased PTS values need to be corrected by osteotomy. However, there is increasing evidence showing that an increased PTS is a strong individual risk factor for ACLR failure because of rerupture or graft insufficiency.19,21,23 Therefore, it is of utmost importance to identify patients at risk. When interpreting the measurement of the PAA for the PTS as a screening method, a sensitivity of 84% or 87%, assuming a PTS of 10.5° or 11°, respectively, measured with the MA as a threshold, indicates that a certain number of patients could not be identified correctly. On the other hand, 3 patients in the present study exhibited a PTS >12° when measured with the PAA, while the measurement using the MA was <10.5°. This suggests that these patients may have a noncritical PTS in the mechanical analysis, even though they were identified as having pathological PTS in the proximal anatomic measurement. This could lead to an overestimation of the individual risk with the potential consequence of consecutive overtreatment. When the PAA exceeded 14°, there was no patient in the present study group with a PTS measured with the MA <10.5°. With a PTS (PAA) <9°, there were no cases with a PTS >10.5° measured with the MA. Therefore, according to the data of the present study, PTS values <9° and >14° could be identified as a safe interpretation zone when using the PAA in clinical routine. In the transition area, when PTS measured with the PAA is between 9° and 14°, one must be cautious as the PAA is not the sole indicator of pathological PTS in this range of values. As mentioned earlier, in a total of 32 cases (16%), the measurement with the MA exhibited higher PTS values compared with the PAA. Among these cases, 56% (n = 18) showed this discrepancy when the PTS measured with the MA fell within the range of 9° and 14°. This finding underscores that the PAA does not accurately represent the mechanical loading conditions in the sagittal plane.
Another interesting finding of the present study was that a distance, between the posterior medial and lateral tibial condyle on a lateral radiograph of the tibia, of ≥7 mm resulted in an increased discrepancy between the measurement of the PTS using the PAA and MA. Hence, it is advisable to ensure that the distance between the posterior tibial condyles in lateral radiographs is minimized, ideally achieving an accurate superimposition of the posterior tibial condyles. Gwinner et al 13 reported a comparable recommendation using the femoral condyles as a reference. With an overlapping of ≥5 mm of the femoral condyles, there was a significantly higher probability that both raters exceeded a difference of 2° in their measurements. As shown in a recent study by Huettner et al, 17 malrotation can even occur within the knee joint itself. A broad variation of the individual knee version could be shown in their study. Therefore, it must be concluded that a correct alignment of the posterior femoral condyles does not automatically imply a correct rotational alignment of the posterior tibial condyles in the sagittal plane. The effect of rotational malalignment on PTS measurement was reported in previous publications. Kessler et al 18 and Weinberg et al 29 described an increase in PTS values in the case of internal tibial rotation due to changes in projection on the radiograph. Further, Weinberg et al recommend the use of the posterior tibial condyles as an anatomic landmark for rotational alignment control, too. The authors of the present publication concur that measuring the distance between the posterior tibial condyles is a more appropriate approach for achieving accurate alignment in lateral tibial radiographs when determining the PTS.
Limitations
One limitation of our study that must be mentioned is that the PTS values were analyzed in a mainly Caucasian, Central European population. In previous literature, it has been described that significant differences exist in PTS between ethnic groups.4,5,22 In addition, these radiographs were all taken in an ACL injured patient collective. These patients are more likely to present a pathological PTS compared with a patient group without a history of ACL injury. This must be considered when transferring these results into clinical practice. In addition, the stated mean values could be interpreted as normal values. Moreover, the cutoff values described for the PTS alone could not be taken as the sole reason for a surgical correction. The recommendation for when an osteotomy for PTS correction should be performed is up to the individual's discretion. Together with other cofactors, PTS values should be seen as an element of the individual risk assessment that leads to a treatment recommendation. Further research is needed to provide evidence-based recommendations on the degree of the PTS that necessitates a correction osteotomy to significantly reduce the risk of failure after ACLR, as well as to identify which additional risk factors may further increase this risk.
Conclusion
Measuring the PTS using the MA was advantageous, as the measurement with the PAA did not identify all cases with sagittal alignment changes correctly. The proportion of patients with pathologically increased PTS not identified with the proximal anatomical measurement, reflected by the sensitivity, depended on the threshold value defined for the MA. Lateral radiographs showing an increased distance between the posterior tibial condyles indicated malrotation of the tibia, leading to measurement inaccuracy.
Footnotes
Final revision submitted July 19, 2024; accepted July 30, 2024.
The authors declared that they have no conflicts of interest in the authorship and publication of this contribution. AOSSM checks author disclosures against the Open Payments Database (OPD). AOSSM has not conducted an independent investigation on the OPD and disclaims any liability or responsibility relating thereto.
Ethical approval for this study was obtained from Orthopedic Hospital Markgroeningen (2023_03).