
Abstract
Background:
Research indicates that mechanics differ between athletes with and without upper extremity pain; however, it is unclear which modifiable risk factors exist for throwing-related pain in softball athletes.
Purpose:
To determine whether sport specialization, throwing, practice, and strength and conditioning training volumes vary between youth softball athletes with and without upper extremity pain. It was hypothesized that youth softball athletes with upper extremity pain would participate in softball year-round and have greater throwing, practice, and strength and conditioning volumes compared with those without pain.
Study Design:
Cross-sectional study; Level of evidence, 3.
Methods:
A total of 232 youth softball athletes from travel ball, middle school, and high school leagues were invited to complete a survey to assess pain, sport specialization, throwing, practice, and strength and conditioning training volumes. Participants were classified into upper extremity pain and no pain groups based on their survey answers. The responses were compared between groups using Mann-Whitney U and chi-square tests.
Results:
A total of 101 athletes—with a mean ± SD age of 13.3 ± 2.3 years, height of 161 ± 13.4 cm, and weight of 59.8 ± 14.8 kg—completed the survey and were included for analysis. The response rate was 43.53%, with 22 athletes in the upper extremity pain group and 79 athletes in the no pain group. A significant difference was observed between hours devoted per week to off-season softball practice (U, 626.6; Z =–2; P = .045), where those without upper extremity pain spent 4 fewer median hours (6 hours) practicing softball per week in the off-season compared with those with pain (10 hours). Also, a significant difference was found between the number of throws during an in-season game (U, 457; Z, –2.28; P = .022), where those without upper extremity pain reported 21 fewer median throws (70 throws) during an in-season game compared with those with pain (91 throws). Furthermore, 77% of those who reported upper extremity pain continued to play despite their pain. There were no other significant differences between demographic characteristics, specialization, injury history, and primary position, as well as throwing, practice, and strength and conditioning volumes.
Conclusion:
Our study demonstrates that youth softball athletes with upper extremity pain had more throws during in-season games and increased hours per week devoted to off-season practice than athletes without upper extremity pain. Our findings support the need for softball stakeholders (eg, coaches, clinicians, parents, and administrators) to engage in further research and recommendations regarding in-season pitch counts and off-season rest.
Women’s fastpitch softball is a popular sport in the United States. Both youth and collegiate softball athletes are at risk for overuse injuries.6,22 Softball pitching and throwing are full-body dynamic motions requiring efficient proximal to distal sequencing of the kinetic chain to maximize performance and reduce the risk of injury. 15 Like baseball pitching, the windmill softball pitch produces large forces at the shoulder.2,11,21,25,26 Specifically, shoulder distraction forces can surpass 100% body weight.4,16 Softball research has primarily focused on identifying the kinematics and kinetics associated with upper extremity pain, such as increased stride length 15 and shoulder distraction force at ball release. 16 However, it is necessary to understand the effects of other modifiable risk factors when developing a comprehensive injury prevention program.
A growing body of baseball research has identified upper extremity pain and injury risk factors. 28 Olsen et al 17 reported youth baseball pitchers with a history of upper extremity surgery pitched more months per year, pitches per game, pitches per year, and warm-up pitches before a game. Pitchers with a history of surgery to the throwing arm reported that they were more likely to pitch through pain and fatigue. Moreover, Matsuura et al 12 identified age and years of playing experience as risk factors for upper extremity pain in baseball pitchers and positional players. A longitudinal study by Lyman et al 10 indicated that age, height, weight, pitch counts, and weightlifting were risk factors for upper extremity pain in youth baseball pitchers. Despite baseball and softball athletes having comparable upper extremity injury rates, 9 research investigating similar modifiable risk factors in softball athletes is limited.
Many of the potentially modifiable risk factors observed in baseball are related to workload (sport specialization, year-round participation, pitches per game, pitches per year, etc).1,10,17,19,20 Investigating risk factors related to workload in softball athletes would be of considerable interest to clinicians and coaches since regulations do not exist limiting pitch counts, innings pitched, and consecutive games pitched. It is common for softball teams to rely on a single pitcher for consecutive games and throughout a competitive season. Our study aimed to determine whether there is a difference in sport specialization, throwing, practice, and strength and conditioning training volume between youth softball athletes with and without upper extremity pain. It was hypothesized softball athletes with upper extremity pain would participate in softball year-round and would have higher training volumes compared with those without upper extremity pain.
Methods
A total of 232 youth softball athletes from travel ball, middle school, and high school leagues were invited to complete a validated survey examining upper extremity pain in softball athletes.3,15,16 A total of 101 athletes—with a mean ± SD age of 13.3 ± 2.3 years, height of 161 ± 13.4 cm, and weight of 59.8 ± 14.8 kg—completed the survey and were included for analysis. All testing procedures were approved by the institutional review board of Auburn University (21-096 EP2103). Parent and participant consent was obtained since the participants were 18 years old. Participants completed an online QualtricsXM survey, which included questions regarding pain, sport specialization, throwing/pitching, practice, and strength and conditioning training volume factors (Supplemental Material). They were specifically asked, “Do you currently experience any pain/discomfort?” If participants answered “yes” and identified their location in the pitching or throwing arm upper extremity, they were placed into the pain group. If participants answered “no,” they were placed into the no pain group. Pain intensity was measured using the visual analog scale ranging from 0 (least pain) to 10 (most pain).
Participants were recruited by distributing the online survey via email to coaches, athletic trainers, participants from previous studies by this research group, and social media outlets. However, the athletes and parents directly completed the survey. The survey included four primary sections regarding specialization (ie, participation in softball >8 mo/y) throwing, practice, and strength and conditioning volume factors. 13 Participants were also asked about demographic information, upper extremity pain descriptors, upper extremity injury history, and primary position. The variables included in the survey were based on a relevant literature review that proposed similar factors were potential risks of upper extremity pain and/or injury in baseball athletes.1,10,17,19,20 Also, hours per week dedicated to softball practice included hours spent in private fielding, hitting, and pitching lessons. Furthermore, throwing volumes were based on participants’ best estimates and were not calculated based on exact pitch counts. Last, a serious softball-related injury was defined as requiring ≥1 month of rest from competitive activity.
Statistical Analysis
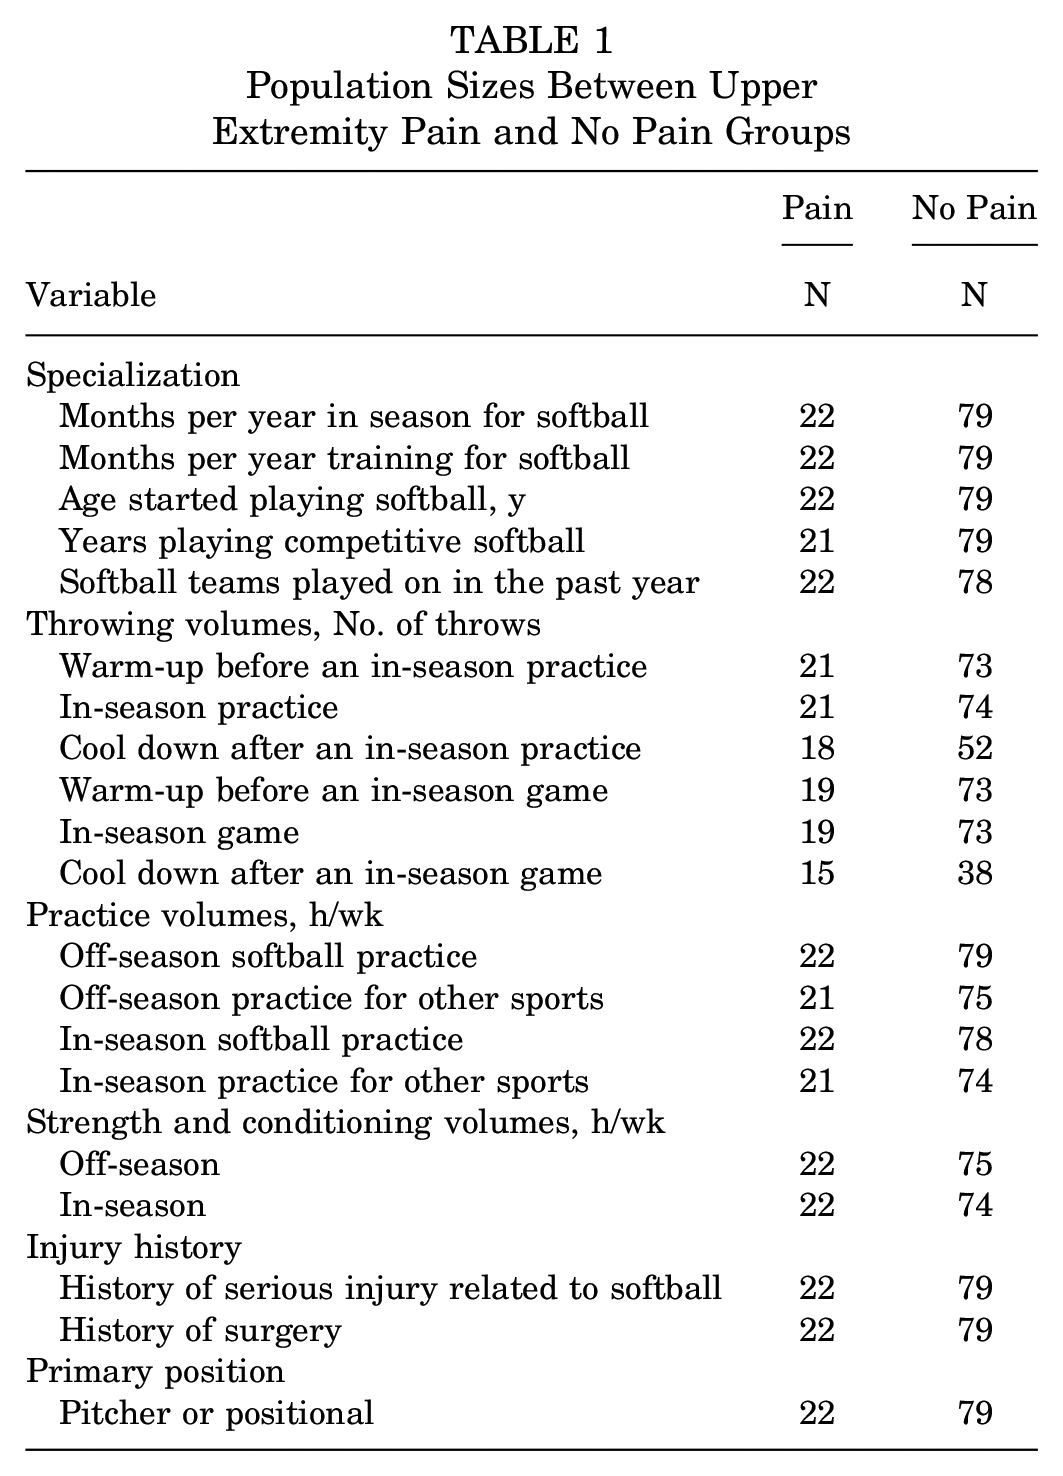
Statistical analyses were performed using IBM SPSS software Version 28 (SPSS Inc), and the alpha level was set a priori at .05. A total of 62 participants had 1 to 6 missing responses. To determine whether data were missing at random or missingness varied systematically between pain and no pain groups, chi-square test of independence was used. Analysis revealed no significant dependence between cases missing data/not missing data and the upper extremity pain/no pain groups (χ2, 0.063, P = .803). A total of 22 cases were missing data for at least 1 of the study variables, with no evident pattern in which items were missing. As a result, we excluded data (removed from analysis) on a pairwise basis. Population sizes for upper extremity pain and no pain groups can be found in Table 1.
Population Sizes Between Upper Extremity Pain and No Pain Groups
Chi-square test of independence was used to compare categorical variables (specialization continued, injury history, and primary position) between participants with and without upper extremity pain. Mann-Whitney U test was used to compare continuous survey variables (demographic characteristics, throwing, practice, and strength and conditioning volume factors). A nonparametric test was used because of a large discrepancy in sample size between upper extremity pain and no pain groups. 24 Furthermore, the sample was not normally distributed based on skewness, with scores exceeding ± 1.96 and the standard error of skewness for all dependent variables except weight. The sample was not normally distributed based on kurtosis with scores exceeding ± 1.96, the standard error for all dependent variables except age, weight, body mass index, age started playing softball, years playing competitive softball, months per year in-season for softball, and hours per week in-season for softball practice. Kolmogorov-Smirnov test determined that the dependent variables were not normally distributed (all, P < .025). Finally, visual inspection of histograms also confirmed a nonnormal sample.
Results
A total of 232 participants started the survey, 46.55% (n = 108) completed the survey, and 43.53% (n = 101) were included for analysis. Based on their response to the pain question, 22 and 79 athletes were placed in the upper extremity pain and no pain groups. Seven of 108 were removed from analysis for missing anthropometric data—including age, height, and weight. The mean survey completion time was 17 minutes and 18 seconds. Participants lived in 21 different states across the United States, including the Southeast (n = 63), Northeast (n = 19), Midwest (n = 11), and West Coast (n = 7) regions, and in Toronto, Canada (n = 1). Participants reported playing ≥1 of the following competition levels: travel ball (n = 86), regional travel ball (n = 20), national travel ball (n = 8), middle school/junior high (n = 19), and high school (n = 43). Also, 2.97% (n = 3), 47.52% (n = 48), and 49.50% (n = 50) of athletes completed the survey during winter (November-February), spring (March-May), and summer (June-July) seasons, respectively.
A total of 72.7% and 27.3% of those who reported currently experiencing upper extremity pain/discomfort indicated that their primary position was a positional player and pitcher, respectively. Table 2 provides important context to report upper extremity pain, such as intensity and location. The most frequently reported location was the shoulder (77.3%; n = 17), and of those experiencing upper extremity pain/discomfort, 77.3% (n =17) reported continuing to play through the pain. Moreover, 54.5% (n = 12) of the total number of athletes reported receiving treatment for their pain.
Characteristics of Participants Pitching or Throwing With Upper Extremity Pain a

n indicates the number of athletes currently experiencing pain in a specified location; % indicates the percentage of athletes experiencing pain at each location. The sum of percentages is >100 since some participants had pain in multiple locations. IQR, interquartile range.
Demographic characteristics for participants with and without upper extremity pain are reported in Table 3 as median and interquartile ranges. Of the total number of participants (n = 101) included for analysis, 21.8% (n = 22) reported currently experiencing upper extremity pain/discomfort.
Group Demographic Characteristics a

Data are presented as median (IQR). BMI, body mass index; IQR, interquartile range.
Comparison Between Upper Extremity Pain and No Pain Groups
Mann-Whitney U test determined a significant difference between hours per week devoted to off-season softball practice between participants with and without upper extremity pain (U, 626.6; Z, –2; P = .045). Specifically, those without upper extremity pain spent 4 fewer median hours or 3 fewer hours on average practicing softball in the off-season compared with those with upper extremity pain (Table 4). There was also a significant difference between the number of throws during an in-season game between participants with and without upper extremity pain (U, 457; Z, –2.28; P = .022). Specifically, those without upper extremity pain reported 27 fewer throws on average or 21 fewer median throws during an in-season game compared with those with upper extremity pain (Table 4). The Mann-Whitney U and chi-square tests of independence did not indicate any other significant differences between groups for demographic characteristics, specialization, injury history, and primary position, as well as throwing, practice, and strength and conditioning volumes (all, P > .073).
Softball Athletes With and Without Upper Extremity Pain a

A significant difference (P < .05) between pain and no pain groups is indicated by a bold P value; n (%) indicates the number (percentage) of athletes. IQR, interquartile range.
Discussion
This is the first study evaluating whether there is a difference in sport specialization, throwing, practice, and strength and conditioning training volume factors between youth softball athletes with and without upper extremity pain. Specifically, youth athletes with upper extremity pain reported higher off-season practice hours per week (pain group, 10 hours; no pain group, 6 hours) and more in-season game throws/pitches (pain group, 91 throws/pitches; no pain group, 70 throw/pitches). The findings partially support the hypothesis that youth athletes with upper extremity pain would spend more hours practicing softball in the off-season and report higher in-season throwing/pitching volumes during games compared with those without pain. There were no significant differences between pain and no pain groups in demographic characteristics, specialization, injury history, primary position, and strength and conditioning volumes.
In baseball, annual throwing volume is an important modifiable risk factor. Olsen et al 17 found pitching 8 mo/y significantly increased the risk of arm surgery in baseball players. In addition, it is reported that intrinsic and developmental factors, as well as extrinsic factors of workload, may predispose throwing athletes to injury. 28 Our study supports the relationship between training volumes, specifically during the off-season, and upper extremity pain in softball. The youth softball athletes in the current study reporting upper extremity pain spent more hours practicing softball in the off-season than those without upper extremity pain. More research is needed to determine recommendations for off-season rest in softball athletes to reduce injury risk.
Pitch volume is another risk factor for throwing arm injuries in youth athletes requiring further assessment. A systematic review evaluating risk factors for shoulder and elbow injuries in adolescent baseball players reported pitches per game as an independent risk factor for shoulder injuries. 14 In the current study, there was a similar significant difference between the number of throws during an in-season game between those with and without upper extremity pain. Furthermore, in concert with increased pitch volume is the associated rotator cuff weakness and fatigue that is associated with increased volume of throws. Skillington et al 23 demonstrated that over a multiday fastpitch softball tournament, objective shoulder weakness and subjective pain and fatigue increased due to incomplete recovery. Yang et al 27 demonstrated pregame pain and fatigue increased over a high school softball season. Further data also indicate softball pitchers with pitch counts of >85 pitches per game are more than twice as likely to see a physician for upper extremity pain and injury. 5 In the current study, the youth softball athletes throwing with pain estimated executing a median of >90 throws per game versus 70 throws for those without pain. Not surprisingly, it is reasonable to assume pain and fatigue would be better managed if pitch counts were instituted in youth softball, similarly to youth baseball. The present study provides a basis for future research that can collectively work toward providing evidence-based pitch count recommendations for youth softball.
Gooch et al 5 reported that pitchers with pitch counts of >85 pitches per game were more likely to be playing through pain. Our study found that 21.8% of the youth softball athletes reported experiencing upper extremity pain/discomfort. Specifically, 72.7% and 27.3% of those who reported experiencing upper extremity pain/discomfort indicated that their primary position was a positional player and pitcher, respectively. Furthermore, 77% of those reporting pain were playing through pain. This concern has been addressed by Holtz et al, 7 who demonstrated that 77% of youth softball players experienced pain in the prior season but only 17% missed time due to injury. Furthermore, 20% of that cohort reported pain before the start of the season. Our results support that upper extremity pain and injury rates are high in youth softball players. More evidence-based precautions are needed to reduce the likelihood of injury due to fatigue and overuse in this age group.
Last, the current study did not support sport specialization as a modifiable risk factor associated with upper extremity pain in youth softball athletes. Sport specialization is defined as a single-sport athlete who trains 8 mo/y at or before age 12 years. 8 In baseball and softball, early sport specialization is relatively low compared with tennis and gymnastics based on the available data. However, there is anecdotal concern this may not be the case, particularly in warmer weather areas of the United States where outdoor play is possible all year long. 18 Within softball, there is the potential for athletes to be susceptible to the pressures of sport specialization with added off-season practice and sport-specific instruction. More research is needed to evaluate the effect of sport specialization on pitchers and positional players in softball and its relationship to shoulder pain and injury risk.
Limitations
Although this study provides valuable descriptive and comparison information regarding youth softball athletes with and without upper extremity pain, a few limitations should be noted. First, whether participants were currently experiencing upper extremity pain was (1) self-reported and subject to recall bias and (2) determined by a binary “yes” or “no” response. Second, volume parameters (throwing, practice, and strength and conditioning) were values estimated in retrospect rather than specifically tracked by researchers across time. Also, overhand throwing and windmill pitching volumes were grouped into a weekly throwing volume. Overhand throwing and windmill pitching motions both increase forces about the shoulder, with the windmill pitch resulting in more force to the biceps tendon before ball release. 21 Future research separating positional player throws from windmill pitching throws is needed. Third, the current study only assessed upper extremity pain. Based on the kinetic chain theory, pain and discomfort in other body areas can influence more distal mechanics and/or impose pain and discomfort in distal segments of the body; thus, future research should consider a whole-body approach. Fourth, this study only looked at athletes who identified themselves as a pitcher or a positional player. This is a limitation as it is common for players to play >1 position at the youth level or identify as both a pitcher and a positional player. Last, results should be interpreted with caution since there was a limited response rate (46.55%), and the study did make comparisons with varying sample sizes for pain and no pain groups. However, this was deemed appropriate since statistical analysis showed no evident pattern of missing data across pain or no pain groups.
Conclusion
The present study aimed to determine whether there was a difference in sport specialization, throwing, practice, and strength and conditioning training volume factors between youth softball athletes with and without upper extremity pain. Youth softball athletes experiencing upper extremity pain reported higher in-season game throwing volumes than those without pain. In addition, those athletes with upper extremity pain also spent more hours practicing softball in the off-season compared with those without pain. Our findings support the need for softball stakeholders (eg, coaches, clinicians, parents, and administrators) to engage in further research and recommendations regarding in-season pitch counts and off-season rest.
Supplemental Material
sj-pdf-1-ojs-10.1177_23259671241257259 – Supplemental material for The Difference Between Throwing and Practice Volumes in Youth Softball Athletes With and Without Upper Extremity Pain
Supplemental material, sj-pdf-1-ojs-10.1177_23259671241257259 for The Difference Between Throwing and Practice Volumes in Youth Softball Athletes With and Without Upper Extremity Pain by Nicole M. Bordelon, Peyton Gober, Kaila A. Holtz, Hillary Plummer, Jessica L. Downs-Talmage, Kamden K. Strunk, Jason L. Zaremski and Gretchen D. Oliver in Orthopaedic Journal of Sports Medicine
Footnotes
Final revision submitted October 11, 2023; accepted January 1, 2024.
One or more of the authors has declared the following potential conflict of interest or source of funding: J.L.Z. has received a grant from Encore Medical LP. AOSSM checks author disclosures against the Open Payments Database (OPD). AOSSM has not conducted an independent investigation on the OPD and disclaims any liability or responsibility relating thereto.
Ethical approval for this study was obtained from Auburn University (ref No. 21-096 EP 2103).
Supplemental Material
Supplemental Material for this article is available at https://journals.sagepub.com/doi/full/10.1177/23259671241257259#supplementary-materials.
References
Supplementary Material
Please find the following supplemental material available below.
For Open Access articles published under a Creative Commons License, all supplemental material carries the same license as the article it is associated with.
For non-Open Access articles published, all supplemental material carries a non-exclusive license, and permission requests for re-use of supplemental material or any part of supplemental material shall be sent directly to the copyright owner as specified in the copyright notice associated with the article.