
Abstract
Background:
Return to play and performance following elbow ulnar collateral ligament (UCL) reconstruction or repair in Major League Baseball (MLB) position players have not been well studied.
Purpose:
To evaluate return to play and return to performance using modern advanced analytics at 1 and 2 seasons following UCL surgery in MLB position players.
Study Design:
Cohort study; Level of evidence, 3.
Methods:
A retrospective analysis was performed on all 33 MLB position players who underwent primary UCL surgery between March 1, 2014, and November 1, 2024. Incidence, risk factors, and return-to-play rates were recorded. Return-to-performance analysis was conducted for 25 players who met the inclusion criteria and were compared to preoperative levels and 50 uninjured matched controls. Performance data were collected for all MLB position players using public sources. Binary logistic regression was also conducted.
Results:
Incidence of UCL surgery in MLB position players over the full 11-season period (2014-2024) was 2.9 ± 1.4 surgeries per season in our cohort, with an even greater average in the past 5 full seasons compared to 2014 to 2019 (P = .21) and 1984 to 2014 (P < .05). Cases had a significantly greater whiff percentage and fewer outs above average. A total of 81.8% returned to play at 1.5 years postoperatively (mean of 317 ± 111 days). UCL repairs (n = 8) resulted in 121 fewer days missed on average compared to reconstructions (n = 25; P < .01). Notably, position players provided significantly less value (FanGraphs wins above replacement [fWAR]) after returning. There were otherwise no differences in any mean offensive or defensive metric. Controls had higher proportions meeting prior performance levels in nearly every metric for the first and second seasons back. Preinjury weighted runs created plus (wRC+) in cases was the only predictor for returning to performance in fWAR postoperatively.
Conclusion:
Annual UCL surgery rates in MLB position players have tripled in recent seasons. Less contact and defensive ability were associated with getting UCL surgery. Over 80% of players returned to play by 1.5 years postoperatively, with those who underwent UCL repairs returning faster. Most performance metrics return at high rates, but the significant decline in player value after returning can likely be explained by decreased workload and possibly a slight decline in offensive performance.
Keywords
The incidence of ulnar collateral ligament (UCL) injuries in baseball has been steadily rising over the past decade, predominantly impacting high-level pitchers who throw at harder velocities and at greater workloads. § Indeed, approximately 90% of baseball players injured in Major League Baseball (MLB) and Minor League Baseball (MiLB) during modern times were pitchers. 24 Because of this, the overwhelming majority of research on risk factors for UCL injuries and surgical outcomes focuses on the pitcher, especially since the use of advanced analytics and pitch-tracking throughout MLB has exploded.
To date, most research on UCL injuries in baseball players has focused on return to play (RTP), workload, and more traditional baseball performance metrics. Overall, a small number of studies have focused on position players, mainly looking at basic offensive and defensive statistics of catchers.3,13,17 Recently, studies published by our team19-21 characterized risk factors and return to performance in MLB pitchers using modern advanced analytics and pitch-tracking metrics to more accurately assess player performance. While the available modern data are more extensive for pitchers, a number of new advanced metrics that more accurately assess position player performance both offensively and defensively have been developed but minimally examined in the literature. Teams and players throughout the league highly value these metrics to drive player evaluation and help inform critical personnel decisions,5,8,10,24,27,28 but it is unknown whether these metrics can be used to identify risk factors for injury and help define and predict return to performance following UCL surgery in position players.
Therefore, our primary objective is to evaluate return to performance using modern advanced analytics and ball-tracking metrics in MLB position players following UCL surgery in an 11-season period from 2014 to 2024. Our secondary objective was to evaluate incidence and RTP rates in MLB position players, comparing reconstructions versus repairs and providing an up-to-date analysis on career longevity during a period focused on value and advanced analytics. Our last objective was to evaluate for any potential risk factors or associations with UCL injuries requiring surgical intervention in MLB position players. Our hypothesis was that MLB position players would RTP at high rates, but fewer would return to their preinjury performance. Overall, this study will better inform position players and teams about what to expect after UCL surgery using outcomes that drive player evaluation throughout MLB.
Methods
Study Design
Our study was deemed institutional review board exempt as not human subjects research under 45 CFR 46.102 by the institutional review board at Columbia University Medical Center. We conducted a retrospective analysis, using entirely public data, on all MLB position players who underwent primary UCL reconstruction (UCLR) or primary repair from March 1, 2014, to November 1, 2024.
Data Collection
The reported date of surgery was used as the index date for data collection and is the time demographic data were collected; the season immediately before surgery with >75 at-bats will be labeled T1, the year before that will be labeled T2, and the year before that will be labeled T3. The seasons played after surgery will be labeled M1 for the first season played after returning, M2 for the second season, and M3 for the third season. A player's position will be labeled as the position they play the most throughout the season. Demographic data, including age, height/weight, body mass index, handedness, position, plate appearances, and draft position, were collected from well-regarded public websites, such as Baseball Savant, FanGraphs, and Baseball-Reference, and stored on a Microsoft Excel spreadsheet.1,2 In total, 33 MLB position players were identified with UCL injuries requiring UCLR or UCL primary repair from March 1, 2014, to November 1, 2024, using a public injury database that has been used previously in other studies and cross-referenced with official press releases.7,20-23,25 This time period was selected because many important advanced analytic metrics began to be released in the 2016 season. Risk factor analyses were conducted comparing the preinjury (T1) season data for all cases and matched controls. Return-to-play and demographic analyses were calculated for all 33 identified cases, while return-to-performance data were collected for the 2017 to 2024 seasons for players who had at least a qualifying season of preoperative data (>75 plate appearances) and 2 qualifying seasons of postoperative data, similar to previous studies.19-21 This resulted in 8 players being excluded from further return-to-performance analysis, resulting in 25 total players. Return to play was defined as returning to MLB competition. Average time to RTP was recorded only for those who successfully returned to play. Subgroup analysis between RTP following UCL reconstructions versus UCL repairs was made.
FanGraphs wins above replacement (fWAR), expected batting average (xBA), on-base plus slugging plus (OPS+), weighted runs created plus (wRC+), home runs, average exit velocity, maximum exit velocity, hard hit percentage, and launch angle were recorded. Definitions for these metrics are included in Table 1. Switch hitters were included as having their dominant throwing arm injured in our analysis; their dominant hitting arm was defined as whichever side they had the most plate appearances on. Throwing maximum velocity, throwing overall velocity, number of throws, accuracy, defensive runs saved (dRS), and outs above average (OAAs) were obtained via Baseball Savant.
Commonly Used Advanced Analytics for Major League Baseball (MLB) Position Players

Control Group
A cohort matched 2:1 using season, age, position, throwing and batting handedness, and plate appearances was identified similarly to previous studies.6,19-21,23 This was done to provide baseline statistics and to account for any season-to-season variation in performance metrics. Controls were selected first by the index year of surgery as the matched player in the UCL injury cohort. Next, position and handedness were used, followed by age in the index season, and then plate appearances in the season prior to injury were used to generate our matched control group. For players who underwent surgery in the offseason, data from the year immediately preceding the injury were considered the index season. Descriptive and pitch-tracking data for the control players were collected in the same way as for the UCL injury cohort.
Statistical Analysis
Statistical analysis to compare means was done via unpaired t tests. The chi-square test was used to compare proportions between the UCL injury and control cohorts, while paired t tests were used to compare pre- versus postoperative outcomes. Further return-to-performance analysis was conducted for the M1, M2, and M3 seasons to illustrate the proportion of pitchers who returned to their T1 season performance for a number of important metrics. Returning to performance in each metric was defined as returning to ≥90% of the respective metrics in the season before the injury. Return to full performance was defined as a player returning to their preoperative form in each of fWAR, wRC+, and OAA; near full performance was defined as meeting 2 of 3 criteria. These metrics were selected because fWAR is generally regarded as the best measure of overall player value, while wRC+ and OAA are highly regarded offensive and defensive metrics, respectively. For all metrics besides fWAR, which is a qualitative and also a cumulative metric affected by workload, if plate appearances for the season before the injury were <75, then the index season (year of surgery) was used. Position players who changed positions after surgery (n = 4) were excluded from defensive return to performance analysis. Position-specific subgroup analyses of the changes in advanced analytic outcomes from the season before injury to 3 seasons after UCL surgery were also conducted using analysis of variance. Advanced analytic and ball-tracking subgroup performance analyses comparing reconstructions versus repairs could not be conducted secondary to a lack of postoperative sample size of the repairs. Binary logistic regression was used to evaluate predictive factors associated with return to fWAR, wRC+, and dRS 3 seasons postoperatively. We chose to use fWAR as it represents a player's overall performance value, while conducting separate analyses for wRC and dRS allows for a more specific analysis of offense- or defense-only variables. Subgroup analyses between different positions were also completed for both RTP and performance. All data analysis was performed using R statistical software, Excel for Mac, and SPSS version 26. Statistical significance was set at .05.
Results
Demographics are recorded in Table 2. Eight players (24.2%) were middle infielders, 5 players (15.2%) were corner infielders, 11 players (33.3%) were outfielders, and 9 players (27.3%) were catchers (Table 2). Mean age was 25.9 ± 3.6 years for cases and 26.9 ± 2.0 years for controls, with 87.9% who threw right-handed and 54.5% who batted right-handed. There were no differences in demographics between cases and controls.
Demographics of Major League Baseball Position Players Who Underwent Ulnar Collateral Ligament Surgery in the Past 5 Seasons a
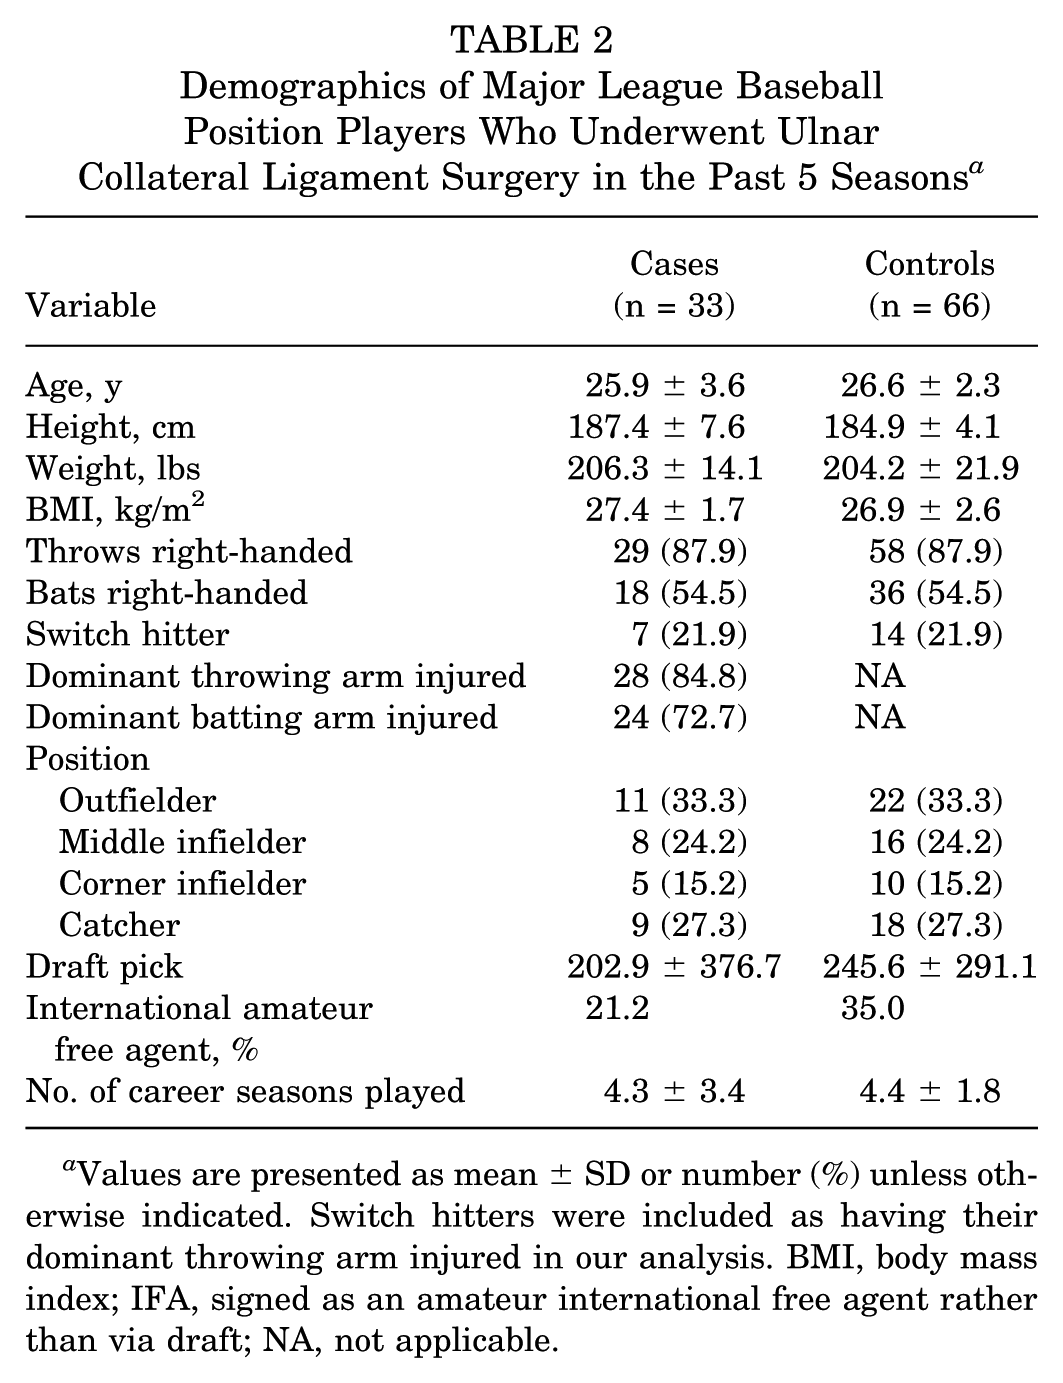
Values are presented as mean ± SD or number (%) unless otherwise indicated. Switch hitters were included as having their dominant throwing arm injured in our analysis. BMI, body mass index; IFA, signed as an amateur international free agent rather than via draft; NA, not applicable.
Annual incidence of UCL surgery in MLB position players over the full 11-season period (2014-2024) was 2.9 ± 1.4 surgeries per season in our cohort, with an even greater average (3.4 ± 1.1 surgeries per season) in the past 5 full seasons compared to 2014 to 2019 (2.5 ± 1.6 surgeries per season; P = .21) and 1984 to 2014 (1.1 surgeries per season; P < .05). In total, 36.4% returned to play at 9 months, 63.7% at 1 year, and 81.8% at 1.5 years postoperatively, with a mean time of 317 ± 111 days after UCL surgery. A total of 25 players (88%) who received UCL reconstructions (n = 25) eventually returned to play compared to 8 players (75%) who received UCL repairs (n = 8; P = .39), although players with repairs missed 121 fewer days on average (P < .01), and all players who received a repair and returned to play had done so by 9 months, compared to 24% of reconstructions (P = .01). This difference was no longer significant at 1 and 1.5 years postoperatively (P > .44; Table 3). No catchers received UCL repairs, while 3 outfielders, 2 middle infielders, and 3 corner infielders underwent repair.
Return-to-Play Outcomes Following UCL Reconstruction Versus Repair in Major League Baseball Position Players From 2014 to 2025 a

Average time to return to play was recorded only for those who successfully returned to play. RTP, return to play since the date of surgery; UCL, ulnar collateral ligament.
Statistically significant (P < .05).
Return-to-performance outcomes were evaluated in 25 players who met the inclusion criteria. These MLB position players were compared to 50 matched controls. Cases had significantly more fWAR, a higher whiff percentage, and fewer OOA compared to controls during the T1 season (P < .05). There were otherwise no significant differences in preinjury performance metrics, including number of throws, throw velocity, or exit velocity. Of the players, 12.1% changed positions upon return from injury, with each going to a position that presumably throws less, although none became full-time designated hitters. For return to performance, there was a significant decrease in plate appearances in both the first and second seasons after returning from UCL surgery (P = .02). Importantly, there was a significant decrease in fWAR in the first season after returning (P = .03), but there were no longer any significant differences in the second season after returning. Offensively, there was a significant decrease in the number of home runs after the first season returning (P = .03). There were otherwise no differences in any offensive metric when comparing preinjury to postoperative values. Besides plate appearances in the first season after returning, there were no differences in mean values for any offensive metric between cases and controls (Table 4). Defensively, there were no significant differences between any preinjury and postoperative metric (Table 5). Besides OOA in the season prior to injury, there were also no significant differences in any metric between cases and controls.
Preoperative and Postoperative Offensive Advanced Analytic Metrics in Position Players Who Had Ulnar Collateral Ligament Surgery a
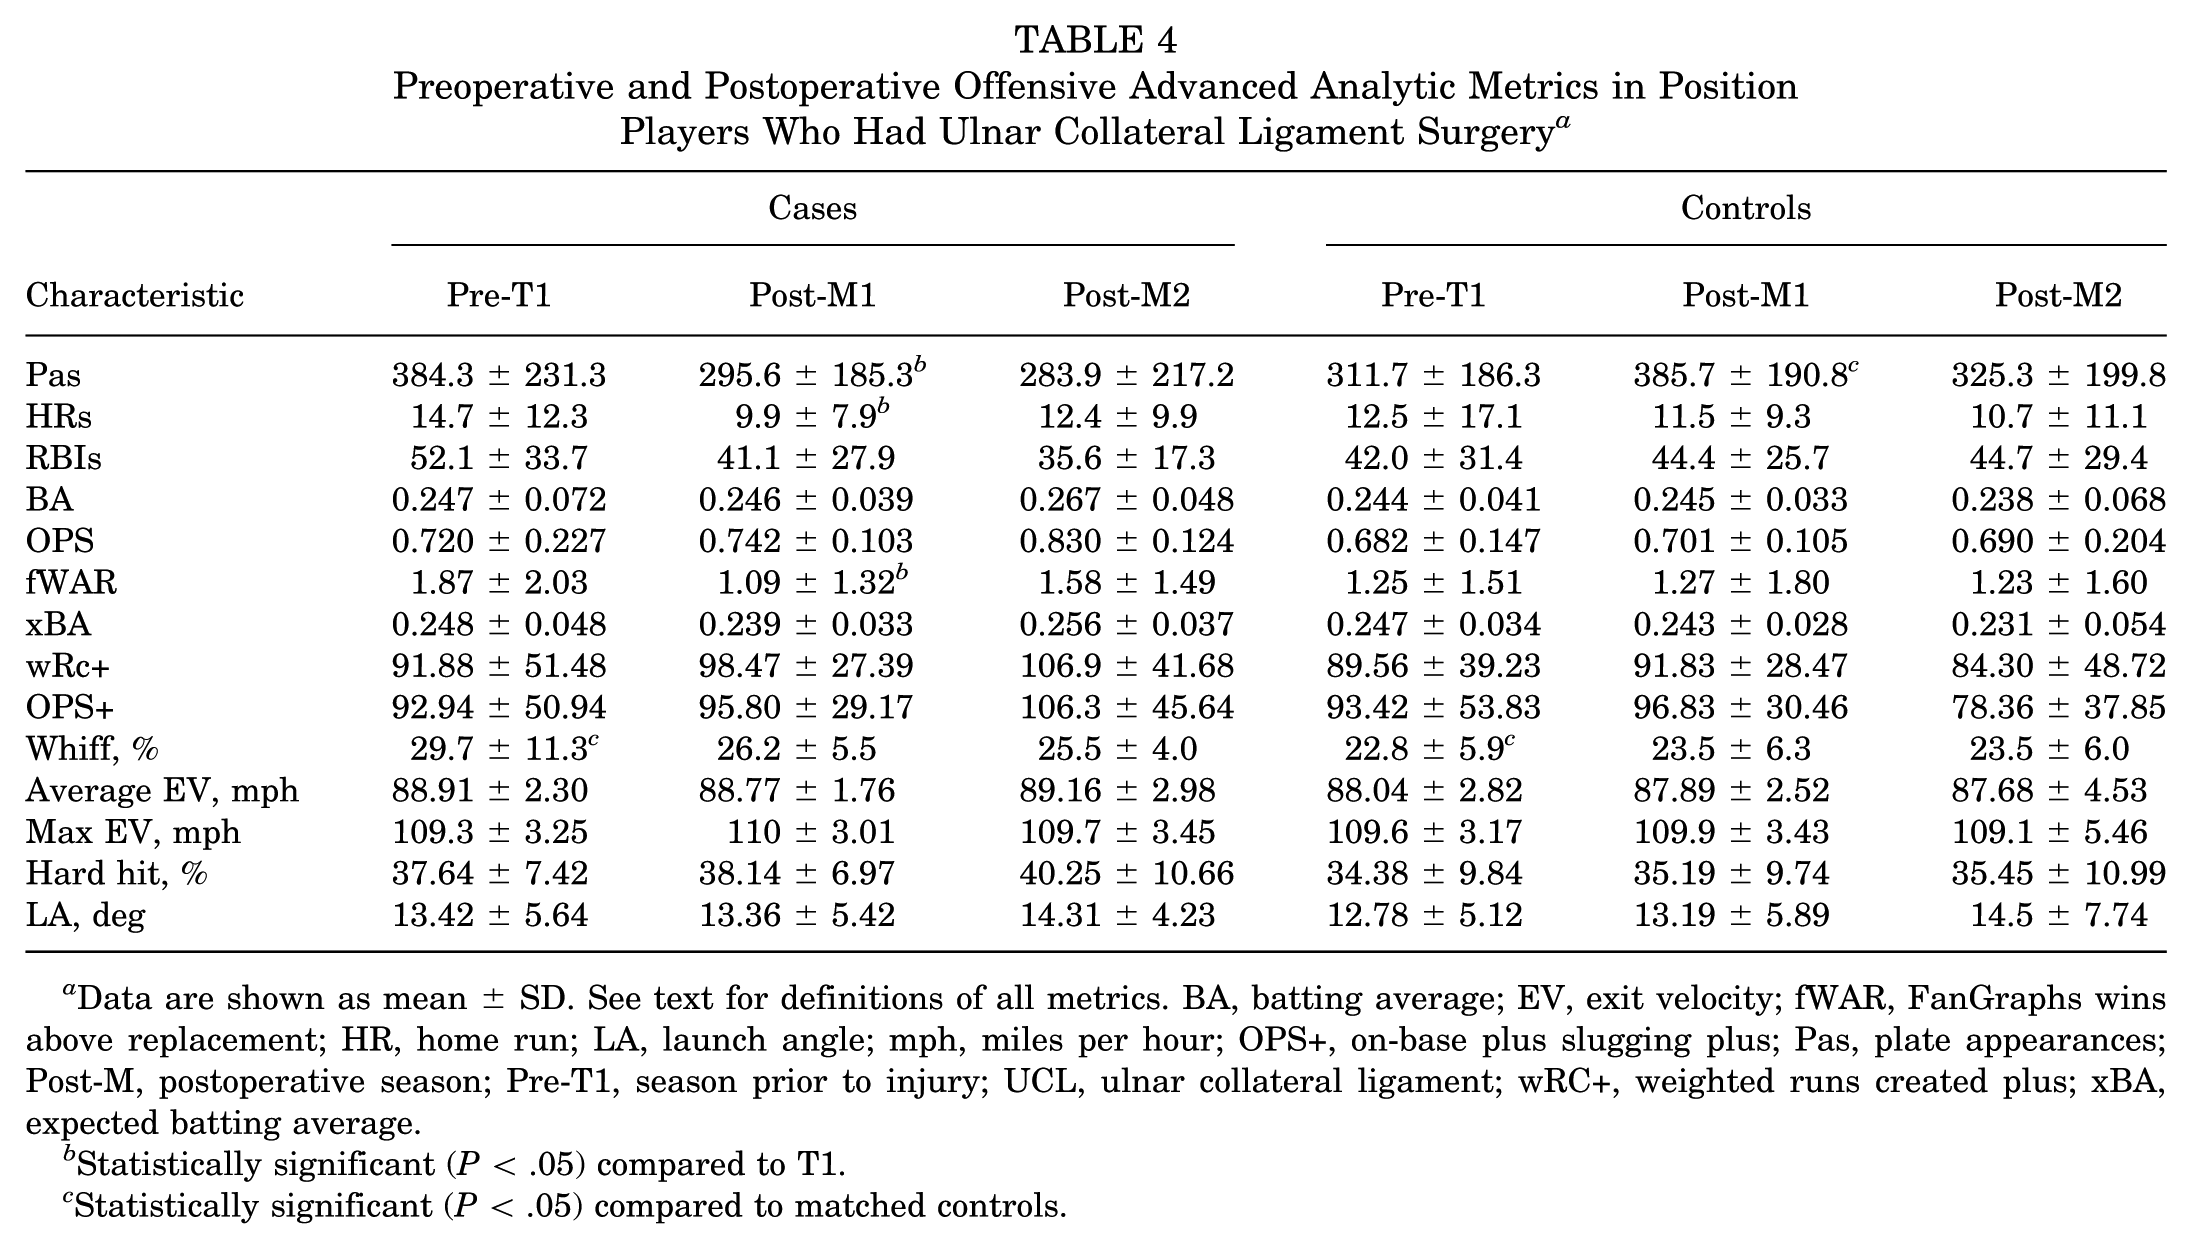
Data are shown as mean ± SD. See text for definitions of all metrics. BA, batting average; EV, exit velocity; fWAR, FanGraphs wins above replacement; HR, home run; LA, launch angle; mph, miles per hour; OPS+, on-base plus slugging plus; Pas, plate appearances; Post-M, postoperative season; Pre-T1, season prior to injury; UCL, ulnar collateral ligament; wRC+, weighted runs created plus; xBA, expected batting average.
Statistically significant (P < .05) compared to T1.
Statistically significant (P < .05) compared to matched controls.
Preoperative and Postoperative Defensive Advanced Analytic Metrics in Position Players Who Had Ulnar Collateral Ligament Surgery a

Data are shown as mean ± SD. See text for definitions of all metrics. Δ, change from T1 season; dRS, defensive runs saved; OAA, outs above average; Post-M, postoperative season; Pre-T1, season prior to injury.
Statistically significant (P < .05).
Further return-to-performance analysis at 1, 2, and 3 seasons postoperatively was then performed to assess the proportion of players who returned to a similar level as the season before the injury (Table 6). There was no clear trend of improvement or difference following returning to play in M1 compared to M2 for cases (P > .05), although all players returned to their average exit velocity. Most players returned to performance in xBA, OPS+, wRC+, average exit velocity, hard hit percentage, dRS, and OAA. Return to full performance during the M1 year was 18.2%, with 26.7% who met at least 2 of 3 criteria; during M2, only 12.5% of cases returned to full performance, with 45.5% who met at least 2 of 3 criteria.
Return to Performance in Major League Baseball Position Players a

Returning to performance in each metric was defined as returning to ≥90% of the respective metrics in the season before the injury. Return to full performance was defined as a player returning to their preoperative form in each of fWAR, wRC+, and OAA. dRS, defensive runs saved; fWAR, FanGraphs wins above replacement; M, postoperative season; OAA, outs above average; OPS+, on-base plus slugging plus; wRC+, weighted runs created plus; xBA, expected batting average.
Statistically significant (P < .05) differences when comparing cases versus controls for that respective season.
This is compared to 28% of matched controls who met all criteria (P = .69) and 52.1% who met at least 2 of 3 criteria (P = .19) during the M1 year, as well as 41% who met all criteria (P = .25) and 71.4% who met at least 2 of 3 criteria (P = .24) during the M2 year. When comparing cases versus controls to establish a seasonal fluctuation baseline in a healthy matched cohort, controls had a significantly higher return to performance in plate appearances in both M1 and M2 seasons (P = .01 and .045, respectively), along with home runs in the M2 season (P = .01) and OPS+ in the M1 season (P = .048). Controls had better return to performance in nearly every metric at both M1 and M2 seasons, although the remaining metrics were not statistically different from cases.
Position-specific subgroup analyses of the changes in advanced analytic outcomes from the season before injury to 2 seasons after UCL surgery were also conducted, although sample size limited the strength of our analyses (Table 7). All catchers successfully returned to play compared to 75% of middle infielders, 85% of corner infielders, and 81.8% of outfielders. However, catchers took significantly longer to RTP than the remainder of the cohort (P < .01); the mean number of days between RTP was 439.7 ± 84.6 for catchers, 264.5 ± 79.0 for middle infielders, 270.8 ± 72.6 for corner infielders, and 251.7 ± 63.1 for outfielders. Of the outfielders, 28.6% changed position after the injury, most often to first base or designated hitter; no other subgroups changed positions. Outfielders had significantly decreased wRC+ and OPS+ in the second season following surgery compared to the other position subgroups (P < .02). There were no differences in any other outcome between position subgroups (P > .05).
Position-Specific Analysis of the Changes in Advanced Analytic Outcomes 2 Seasons Following Ulnar Collateral Ligament Surgery a

Besides return-to-play and position change data, all data are shown as mean ± SD. See text for definitions of all metrics. Certain metrics (OOA, exit, and throw average velocity) were developed later in the study time period and thus were not available for all players. dRS, defensive runs saved; fWAR, FanGraphs wins above replacement; mph, miles per hour; OAA, outs above average; OPS+, on-base plus slugging plus; Post-M, postoperative season; Pre-T1, season prior to injury; wRC+, weighted runs created plus; xBA, expected batting average.
Statistically significant (P < .05).
Binary logistic regression identified preinjury wRC+ as a negative predictor of returning to fWAR at 1 season postoperatively. Age approached statistical significance as a negative predictor for return to fWAR at 1 season (P = .09); otherwise, no other variables were associated with returning to fWAR, wRC+, or OAA at 1 season postoperatively (Table 8). There were too few repairs eligible for regression analysis (n = 4), and thus repair versus reconstruction was not used as a variable.
Preoperative Factors Associated With Return to fWAR, wRC+, and OAA at 1 Season Postoperatively a
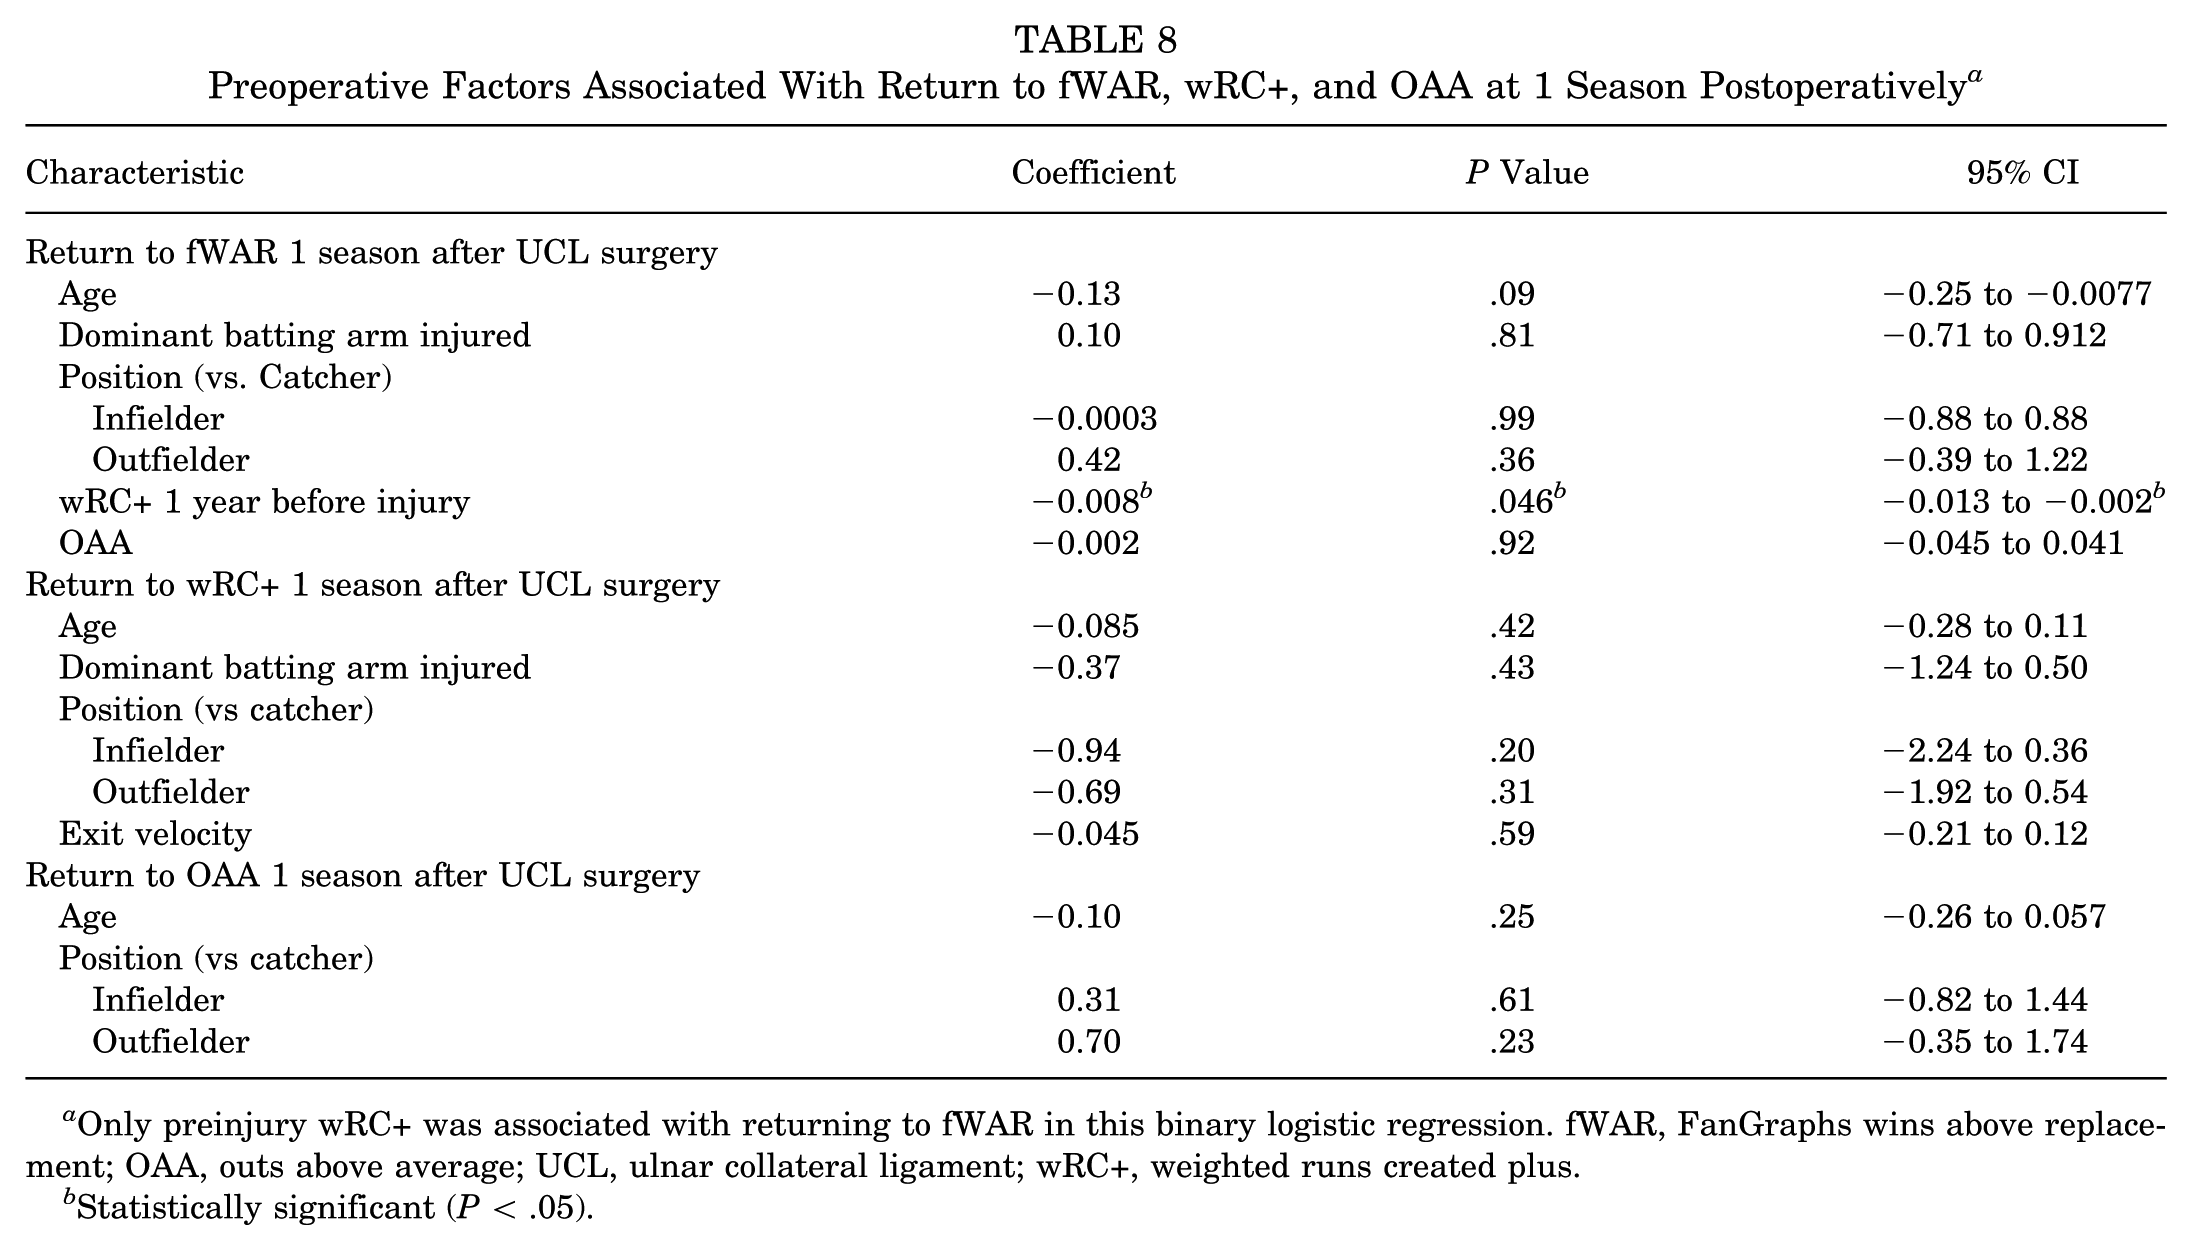
Only preinjury wRC+ was associated with returning to fWAR in this binary logistic regression. fWAR, FanGraphs wins above replacement; OAA, outs above average; UCL, ulnar collateral ligament; wRC+, weighted runs created plus.
Statistically significant (P < .05).
Discussion
Annual UCL surgery rates in MLB positional players have tripled in the past 5 seasons compared to 1984 to 2014. Less contact and defensive ability was associated with UCL surgery in our study. Over 80% of players returned to play by 1.5 years postoperatively, with preliminary data showing that players with UCL repairs returned nearly 4 months earlier on average than those with reconstructions, albeit sample size was limited given the rarity of the injury in this patient population. All players with repairs who returned had done so by 9 months compared to just 24% of reconstructions, while catchers took significantly longer to return than the rest of the position players. Notably, position players provided significantly less value (fWAR) in the first season after returning but recovered to provide a similar value by the second season after returning and in all other metrics. There was also a significantly lower proportion of cases who returned to their prior workload based on plate appearances as long as 2 seasons after returning from injury, along with OPS+ in their first season after returning and home runs in their second. While most cases did ultimately return to performance in individual metrics, a majority did not return to full performance or near-full (2 of 3 criteria) performance by 2 seasons after returning from injury, which was less than controls in nearly every metric. The significant decline in fWAR in cases can thus be explained mostly by decreased workload with a slight decline in offensive performance. Preinjury wRC+ was the only identified predictor in cases for returning to performance in fWAR, emphasizing that stronger offensive players preoperatively were more likely to return to their baseline preinjury value. Although small sample size significantly limited our analyses, this study evaluates risk factors for injury, along with RTP and performance following UCL surgery in MLB position players using several advanced analytic and ball-tracking outcomes for the first time.
Previous studies from 1984 to 2015 evaluating MLB position players who underwent UCL surgery reported only about 1.1 surgeries per season,3,13,26 illustrating a 263% increased rate over the past 12 seasons and a 309% increased rate over the past 5 full seasons. Comparatively, the total number of UCL surgeries in MLB pitchers has risen nearly 25% in the past decade, 18 albeit pitchers still require UCL surgery at a much higher frequency (29 surgeries on average per season from 2020 to 2024) than position players. This is likely secondary to UCL injuries in position players being less commonly from overuse and more often from traumatic situations, such as when sliding into a base or during a swing, 9 albeit most players (85%) still had injuries to their throwing arm.
It is likely that some of this rise in UCL injuries in position players can be attributed to improved detection of UCL injuries in modern medicine, but there does appear to be a noticeable rise in UCL injuries requiring surgery in MLB position players. Our preliminary analysis of preinjury data showed that cases had a higher whiff percentage with fewer OOA compared to controls. Although larger and more detailed studies similar to what has been done analyzing MLB pitchers are warranted,19,21 these initial data suggest that perhaps less contact ability may act as a risk factor in position players, possibly because swinging strikes are more associated with “poor” swings, where the hitter abandons their mechanics or possibly swings too hard. Although nonsignificant, cases also had more plate appearances, and similarly to pitchers, 19 position players who underwent UCL surgery provided more overall value compared to matched controls, perhaps suggesting that increased workload or overall player ability may predispose to UCL injury risk if the study had increased power.
Catchers may be especially at risk, as they throw the ball more frequently than any other position player and often at similar rates to pitchers, albeit at lower intensities and without pitch variations. The rate of UCL surgeries in catchers in our case cohort was similar to previous reports. Reassuringly, there was also no difference in throwing amount or velocity between cases and matched controls, and there was no difference in exit velocity. MLB has now begun collecting more detailed batting data, such as bat speed, attack angle, bat tilt, and other biomechanical measures, which should be a focus of future injury risk factor studies. While the rarity of the injury in position players and thus the limited sample size of our study are clear limitations of our study, this trend of increased injuries is important to acknowledge and monitor, as most efforts toward the UCL injury epidemic have been devoted to pitchers.
A recent systematic review by Thomas et al 29 evaluating RTP in nearly 200 MLB or MiLB position players who underwent UCL surgery found that RTP rates in catchers were as low as 59%, with infielders (76%) and outfielders (89%) faring better3,4,12,27 at an average RTP of over 300 days. Only 1 other small study evaluated RTP after UCL repair. 15 Comparatively, our overall RTP findings were similar to these previous reports, with 84.8% of players returning to play at an average of 317 days after surgery. In our study, UCL repairs in 8 position players resulted in an 75% RTP rate and only required 222 days to RTP on average, nearly 4 months faster compared to UCLR. This may be partially a result of no catchers receiving a repair as they take longer to return, or perhaps this fact is why catchers took significantly longer (mean of 440 days) to RTP than any other position group. This may also suggest that catchers are more prone to developing tears less amenable to repair or desire a more defined outcome, given the throwing demand of the position, which is most comparable to pitchers. While the limited sample size in our cohort means any interpretation should be met with caution, hitters who are properly indicated for a UCL repair may return significantly faster than those who undergo a reconstruction.
While RTP following UCL reconstruction in position players has been studied, return to performance using advanced analytics and ball-tracking outcomes has been minimally evaluated. Jack et al 13 looked at traditional offensive statistics, such as batting average, on-base percentage plus slugging (OPS), and wins above replacement (WAR), following UCLR in 33 players from 1984 to 2015. They found that outfielders who underwent UCLR had significantly lower WAR postoperatively, with about half changing positions, albeit with an 85% RTP rate. Otherwise, they found that position players generally did well getting back to baseline traditional performance metrics. Begly et al 3 also looked at traditional offensive statistics in 35 MLB position players who underwent UCLR in these 31 seasons, finding similar results to Jack et al, 13 but there was no difference in outcomes when compared to matched uninjured controls. Marshall et al 17 found that 80% of MLB (7 total) and MiLB (18 total) catchers returned to play at an average of nearly 13 months after surgery. Malige and Uquillas 16 included 6 MLB position players and found no difference in more advanced metrics, such as exit velocity, OOA, or arm strength.
Our study characterizes return to performance following UCL surgery in MLB position players using several advanced analytic and ball-tracking outcomes for the first time. Most notably, there was a significant decrease in fWAR in the first season after returning (P = .03), but players regained their performance value in their second season. This may have been secondary to decreased workload, as there was a significant decrease in plate appearances in both of these postoperative seasons compared to the season prior to injury. This may explain why there was a slight decrease in home runs in the first season after returning. However, plate appearances were nearly identical between the 2 postoperative seasons, suggesting some improvement in overall performance in their second season back. This notion is consistent with previous studies in pitchers that showed improvement in subsequent seasons prior to returning from UCL surgery. 19
Offensively, predictive advanced analytics, such as xBA, wRC+, OPS+, whiff percentage, hard hit percentage, launch angle, and average and maximum exit velocity, have all been minimally studied following UCL surgery, despite their importance in player evaluation, as described in Table 1. In our cohort, there were no differences in the postoperative means of these advanced offensive analytics, and most players returned to performance by their second season back from injury. Exit velocity immediately returned for every qualified player, but the remainder of the metrics improved after their first season back from injury, again emphasizing that it takes longer for offensive performance to return, even after returning to play. Binary logistic regression identified wRC+ as being the only significant predictor of returning to performance in fWAR, indicating that stronger offensive players preoperatively were more likely to return to their baseline preinjury value.
The same is also true of defensive advanced analytics following UCL surgery in MLB position players—there were no significant differences in advanced defensive statistics, such as dRS or OAA, and players increasingly returned to performance after the first season back from injury. Although there was a trend of worsening dRS performance in our cohort, this did not hold up for OOA. Currently, OAA is generally more widely valued throughout the league as it gives a more granular view of each play, relying on MLB's Statcast camera system to measure player range, movement, and positioning. 22 OAA was released publicly for outfielders in 2016 and for infielders in 2019, while dRS has been determined since 2003 and relies mainly on video analysis by scouts rather than objective Statcast data. 22 Furthermore, players were able to return to their maximum throwing velocity even if injured in their dominant arm. Altogether, our study shows that MLB position players return successfully to defensive performance.
Finally, although a majority of position players were able to successfully return to most metrics analyzed, it was rare for a case to return to full or near-full performance. Return to full performance in the first season back from injury was 18.2%, with 26.7% who met at least 2 of 3 criteria; in the second season back, 45.5% met at least 2 of 3 criteria. This is compared to 28% of matched controls who met all criteria and 52.1% who met at least 2 of 3 criteria during the first season, with 71.4% who met at least 2 of 3 criteria during the second season. When comparing cases versus controls to establish a seasonal fluctuation baseline in a healthy matched cohort, controls had significantly higher proportions who met performance level in plate appearances in both M1 and M2 seasons, along with home runs in the M2 season and OPS+ in the M1 season. While these data show that random seasonal variation or age-related performance decline is expected in some healthy controls, controls had a better performance in nearly every metric at both M1 and M2 seasons, although the remaining metrics were not statistically different from cases. The significant decline in fWAR in cases can thus be explained mostly by decreased workload, with a slight decline in offensive performance. Overall, our findings also support the notion that MLB position players RTP quicker and perform better after UCL surgery than pitchers, based on previously published data. 20
Limitations
There are several limitations to this study. The small sample size of our study limits the power of our findings, although our study compares favorably to other studies and encompasses the entirety of the Statcast era. RTP outcomes could have been impacted by seasonal timing, but this is very hard to control for in any study where direct knowledge of the player's recovery process, career and team goals, and other factors are not known. Data were also obtained entirely from public sources, which likely prevented us from obtaining important clinical details, but these sources have been used multiple times previously.19-21 Although statistical significance was obtained at times, the clinical significance of our findings is unknown. The results of individual t tests should be interpreted cautiously, given the large number of variables in this analysis, although our binary logistic regression accounts for testing multiple variables at once. Our control group was not matched based on preinjury performance metrics, which may have introduced bias, especially given the small significant differences between cases and controls previously mentioned. However, given the amount of performance metrics available of varying importance, controlling for all metrics and having enough eligible controls would be extremely difficult, and selecting certain metrics would be arbitrary. This would also have prevented us from making any potential risk factor analyses. Since it has not been previously established in the literature, we developed our own definitions for return to performance for each metric. Thus, these were subjective definitions that we believe are reasonable but can be impacted by random season-to-season variation. Despite these limitations, this study contributes substantially to our understanding of return to performance after UCL surgery in MLB position players.
Conclusion
Annual UCL surgery rates in MLB position players have tripled in recent seasons. Less contact and defensive ability were associated with getting UCL surgery. Over 80% of players returned to play by 1.5 years postoperatively, with UCL repairs returning faster. Most performance metrics return at high rates, but the significant decline in player value after returning can likely be explained by decreased workload and a slight decline in offensive performance.
Footnotes
Final revision submitted November 30, 2025; accepted December 6, 2025.
One or more of the authors has declared the following potential conflict of interest or source of funding: C.S.A. is a paid consultant and receives royalties from Arthrex; he also serves as the head team physician of the New York Yankees. No other authors have any potential conflicts of interest.
Ethical approval for this study was waived by Columbia University Medical Center.