
Abstract
Background:
Previous studies have found that injury rates are slightly higher in children who play flag football versus tackle football. It is unclear if this difference is due to the way each type is played or taught or whether there are intrinsic differences in attitudes or neuropsychological characteristics in children and their parents.
Purpose:
To determine whether children who play flag football score differently from those who play tackle football on validated neuropsychological tests.
Study Design:
Cross-sectional study; Level of evidence, 3.
Methods:
Each participating athlete (aged 8-12 years) was recruited in 2018 and 2019 by email through local youth football leagues and the local university. Each athlete was administered a 1-time multidimensional assessment battery. The battery included the Wechsler Abbreviated Scale of Intelligence-2nd Edition, the children’s version of the Trail Making Test, the Integrated Digit Span and Spatial Span subtests of the Wechsler Intelligence Scale for Children-4th Edition (WISC-IV), and the Beck Self-Concept Inventory for Youth. The parent/guardian of each athlete completed the Achenbach Child Behavior Checklist-Parent Report Form, the Behavior Rating Inventory of Executive Function (BRIEF)-Parent Form, and a custom survey. These tests were used to determine IQ estimates and standardized scores, measuring verbal comprehension, matrix reasoning, mental set-shifting, attention, cognitive processing speed, working memory, spatial processing, perception of self-concept, behavioral regulation index, metacognition index, and global executive composite. Scores were compared between flag football and tackle football groups by 2-sample t test, with the Wilcoxon rank-sum test used for nonparametric data.
Results:
A total of 64 athletes (41 tackle football, 23 flag football) were enrolled from youth football leagues (grades 4-6). Flag players scored significantly higher on the WISC-IV Spatial Span-Backward subtest (scaled mean, 12.0 vs 10.6; P = .046), while tackle players had significantly higher BRIEF-Inhibit subscores (mean t-score, 45 vs 42; P = .026). There were no significant differences in any of the other tests, including socioeconomic status and perceived concussion risks.
Conclusion:
Concerns that injury epidemiologic studies comparing flag with tackle football could be confounded by intrinsic differences in the children who choose to play each type seem to be unfounded.
Keywords
Each year, 2.8 million American children between grades 2 and 7 participate in youth football. 12 Increasing public awareness of injuries sustained during football has led some physicians to propose delaying tackle football participation until late adolescence to protect the developing youth brain. 6 After sustaining a concussion, younger athletes have demonstrated worse outcomes and are at higher risk of long-term injury if there is insufficient recovery time. 4 The American Academy of Pediatrics recommends expanding the availability of noncontact football programs in an effort to prevent concussions. 8 However, some flag leagues have begun requiring protective equipment for the head and face, which seems to go against flag football’s purported safety benefits over tackle football. Age limits to tackling have also been proposed, but youth football coaches have reported that learning tackling at a younger age better prepares athletes for playing later in life, as athletes can practice proper blocking and tackling techniques. 2,16 The American Academy of Pediatrics Council on Sports Medicine and Fitness have also discussed the potential costs of these age limits to tackling, including concern about lack of early exposure leading to greater severity of injuries when tackling is finally introduced. 5
Even with these national recommendations, there have been few studies examining tackle and flag football injuries in youth participants. 20 Radelet et al 13 was among the first to compare head impact outcomes in youth flag and tackle football. They found youth tackle football players experienced a higher impact rate, but flag players had increased odds of experiencing high magnitude rotational acceleration injuries. 13 Zendler et al 20 examined injuries reported in the National Electronic Injury Surveillance System (NEISS) and found higher rates of injuries in youth tackle football (6- to 18-year-olds), but had the limitation that the NEISS only reports injuries seen in an emergency department and may underestimate injuries presenting to an athletic trainer, primary care physician, or specialty clinic. 20 In contrast, Peterson et al 12 reported double the rate of concussions for youth (7- to 13-year-olds) flag football players compared with tackle football players in the same study. Regardless, although flag football is considered a limited-contact sport, especially compared with tackle football, it is clearly not a noncontact sport and may be just as, if not more, dangerous than tackle football. 13,17,20 The study by Peterson et al 12 has been criticized by reviewers and the popular press for failing to account for potential intrinsic differences between tackle and flag football players that may drive their choice to play one type over another and subsequently impact reported injury rates.
The decision to participate in flag or tackle football versus other sports likely depends on a number of factors, including community-wide variables, parental knowledge and attitudes, and factors intrinsic to the athlete, which could influence reported injury rates more than the actual risk of playing flag or tackle football. Failure to account for these potential differences can affect not just the scientific understanding of injury rates in youth football but also public perception and policy related to youth tackle football availability. While previous studies have focused on flag versus tackle participation based on the availability of these programs in communities of differing socioeconomic statuses, there are no studies evaluating what drives children and families to choose tackle or flag football when both are available in a community. 9 More research is needed to determine whether these differences are a result of the way each type of football is played and taught or whether there are intrinsic differences in athletes and families who choose to play flag versus tackle football. This study aims to investigate the latter with the hypothesis that children (grades 4-6) who play flag football and their families will score differently from children who play tackle football and their families on both validated neuropsychological tests and parent- or self-reported measures of behavior, mood, and executive function.
Methods
Participants
In the summers of 2018 and 2019, participants were recruited from 3 youth football leagues with a mix of flag and tackle players. Parents and their families were recruited through emails that were sent on behalf of the research team from the local youth football leagues as well as a mass email that was sent throughout the local university’s community. Individual athletes and a parent or guardian were both enrolled in the study. Athletes were administered a neuropsychological battery, whereas parents were asked to complete a series of questionnaires about their child. The study protocol received institutional review board approval, and informed consent was obtained from parents and/or guardians due to minors being included in this cohort. Assent was obtained from each child participant.
Measures and Procedures
The following validated neuropsychological tests/questionnaires were administered to the athlete in various locations, including an academic sports medicine clinic and the participants’ homes, to maximize convenience for the athletes and/or families: Wechsler Abbreviated Scale of Intelligence-2nd Edition (WASI-II), which measures verbal comprehension and matrix reasoning to yield a 2-subtest IQ estimate (FSIQ-2).
18
Trail Making Test, Children’s Version, parts A and B, which measures mental set-shifting, attention, and cognitive processing speed.
14
Two subtests from the Wechsler Intelligence Scale for Children-4th Edition (WISC-IV Integrated): Digit Span, which measures working memory, and Spatial Span, which measures spatial processing.
19
Beck Self-Concept Inventory for Youth (BSCI-Y), which measures the child’s perception of self-concept.
3
The recorded times on the Trail Making Test were converted into age-corrected scores, and the number of items on the WISC-IV that the child answered correctly was converted into age-corrected scaled scores. For the BSCI-Y, which consists of a series of statements for which the child ranks how well each applies to him/her (never, sometimes, often, always), results were converted into a t-score based on age- and sex-based norms. 3
The following questionnaires were administered to the parent/guardian of the athlete: Achenbach Child Behavior Checklist (CBCL)-Parent Report Form, which measures internalizing and externalizing behaviors and symptoms.
1
Behavior Rating Inventory of Executive Function (BRIEF)-Parent Form, which measures aspects of executive functioning.
7
An unvalidated survey that was created by the research team to determine the reasons for enrollment in each type and concussion risk perceptions of the parents (Appendix Figure A1).
On the CBCL-Parent Report Form, the parent ranks a series of behaviors/problems their child had in the previous 6 months. This measure yields 3 problem scales (total problems, internalizing problems, and externalizing problems), 8 syndrome scales (anxious/depressed, withdrawn/depressed, somatic complaints, social problems, thought problems, attention problems, rule-breaking behavior, and aggressive behavior) and 6 DSM (diagnostic and statistical manual of mental disorders)-oriented scales (affective problems, anxiety problems, somatic problems, attention deficit hyperactivity disorder problems, oppositional defiant problems, and conduct problems). 1 On the BRIEF-Parent Form, the parent/guardian is given a list of statements that describe children, which they rank if their child had problems with those behaviors in the previous 6 months. This yields 2 indexes (behavioral regulation and metacognition), an overall score (the global executive composite), and 8 clinical scales (inhibit, shift, emotional control, initiate, working memory, plan/organize, organization of materials, and monitor). 7
While the survey by the research team was not a validated instrument, it was created with the intention of helping us frame the results of validated measures in the context of this study. The survey assessed socioeconomic status and served hypothesis-generating purposes by asking parents the question, “Why did you choose participation in tackle football vs flag football (or vice versa)?” This question was asked to determine the parent’s primary reason behind this choice, such as convenience or safety perceptions. In addition, parents were asked to rank their personal perception of concussion risk in youth football on a scale of 1 (very safe) to 10 (very risky). This question was included because implicit bias is inevitable and may affect whether a parent ultimately decides to place their child in tackle or flag football based on possible perceived safety differences.
Data Analysis
Raw scores from the WASI-II, Trail Making Test, WISC-IV, BSCI-Y, CBCL, and BRIEF were converted to a standardized score based on validated guidelines of each test or subtest that took age and/or sex into account. These scores were then compared between participants who participated in tackle football and those in flag football using either a 2-sample t-test or a Wilcoxon rank-sum test. The nonparametric test (Wilcoxon) was used for variables that were nonnormally distributed, with normality assessed by the Shapiro-Wilk test. The Wilcoxon rank-sum test was also used for ordinal data (socioeconomic status, errors on the Trail Making Test, etc). Means with standard deviations were analyzed for variables compared with t test, and medians with interquartile ranges (IQRs) were analyzed for variables compared with Wilcoxon rank-sum test.
A priori power calculations were performed to estimate necessary sample size based on performance on the BSCI-Y, chosen because it serves as a self-report inventory of self-concept. In previous studies, the standard deviation of BSCI-Y scores was 7. 11 Using a minimally clinically significant difference of 5, we would need 62 subjects (31 per group) to have an 80% chance of detecting a difference between groups at the P = .05 level.
Results
In the summers of 2018 and 2019, participants were recruited from 3 youth football leagues with a mix of flag and tackle players. A total of 64 players (41 tackle and 23 flag football players, aged 8- to 12-years-old) participated in this study. Four of the flag players played a modified version of the game called “flackle”. Because flackle is played primarily as flag football that is modified only by equipping pads, these players were included in the flag football group. Furthermore, many of these parents stated that they chose to enroll their child in flackle so that the athlete could become accustomed to wearing pads while learning to play football safely in case of playing tackle in the future. Of the 41 tackle players and 23 flag players, the median age was 11.08 (IQR, 9.92-11.58) years and 10.17 (IQR, 9.17-10.92) years, respectively (P = .033). There was no significant difference in socioeconomic status (n = 37; P = .215) between the 2 groups.
While our power calculation that assumed a 1:1 enrollment ratio determined a total of 62 subjects would be needed, as reported by others, participation of tackle players exceeded flag players, leading to an imbalance in group size. 12,17 Based on our achieved enrollment of 64 subjects with a ratio of 41:23, we still achieved an a priori power of 78%, which closely approximated our intended goal of 80%.
Although the study was not limited to males, all of the players were boys. Players were included if they were going into, or already in, 4th to 6th grade to ensure they were in an age group that provided a choice between flag or tackle football. Seven subjects still indicated that they only had access to tackle football, and 6 subjects indicated that they only had access to flag football; however, all participants were recruited from an area with leagues that offered both flag and tackle football within a 30-mile radius of where each subject lived.
Of the 13 players who indicated that they did not have a choice in playing either flag or tackle football, 2 had scheduling conflicts (1 flag and 1 tackle player) and 11 (6 tackle, 4 flag) commented that only 1 type was offered for their age/region. However, 7 of the 13 players commented that they would not have chosen the other type of football even if they knew it was offered in their community.
Results of Neuropsychological Testing for Participants
Results from the WASI-II and related FSIQ-2 showed no significant difference between flag and tackle football players (P = .916) (Table 1). The Trail Making Test (Children’s Version Part A&B) showed no significant difference between the time needed to complete the test or the number of errors made between the 2 groups (Table 2).
Results of the WASH-II a
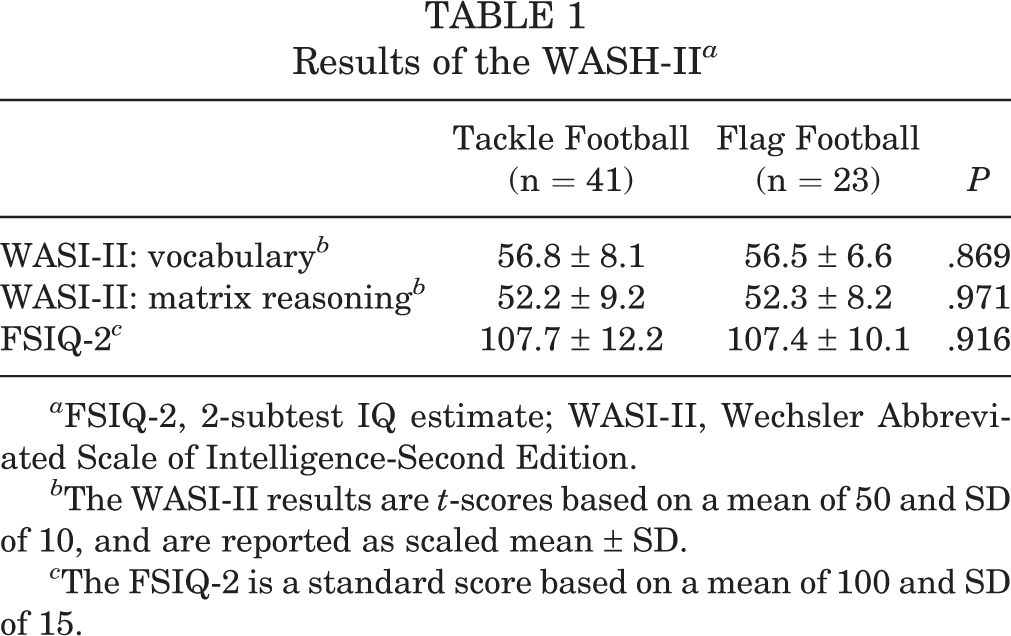
a FSIQ-2, 2-subtest IQ estimate; WASI-II, Wechsler Abbreviated Scale of Intelligence-Second Edition.
b The WASI-II results are t-scores based on a mean of 50 and SD of 10, and are reported as scaled mean ± SD.
c The FSIQ-2 is a standard score based on a mean of 100 and SD of 15.
Results of the Trail Making Test a
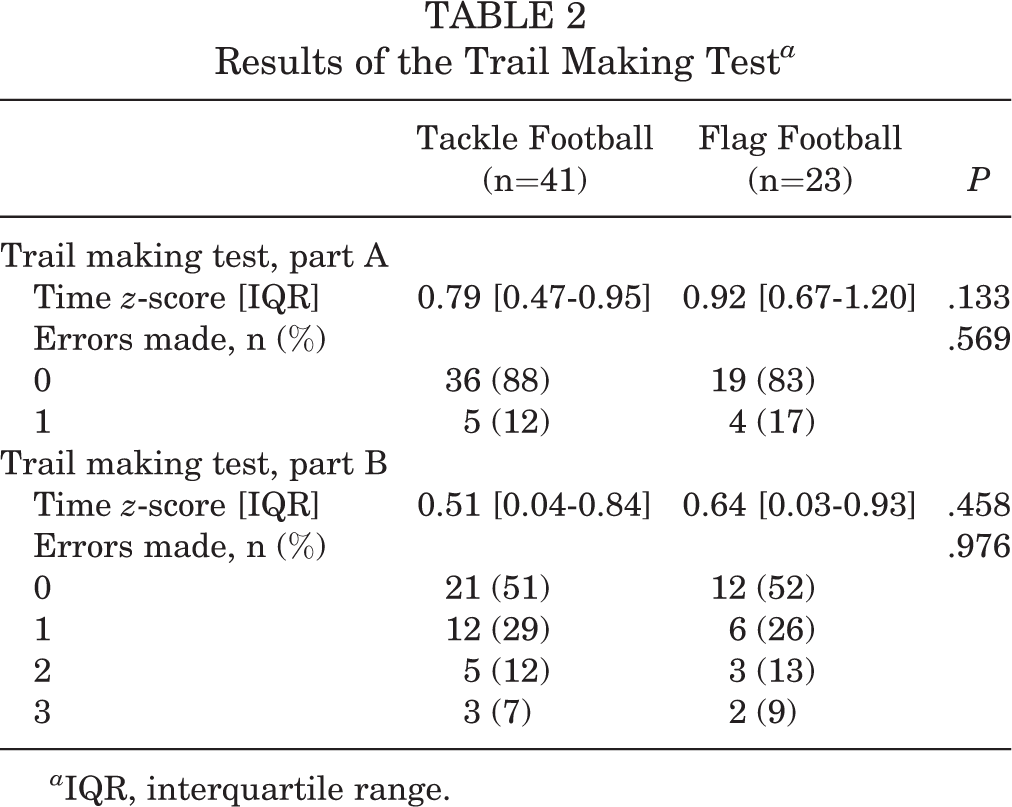
a IQR, interquartile range.
The WISC-IV Integrated subtests, measuring both working and spatial memory, had a significant difference only in the Spatial Span-Backward subtest. Flag football players scored significantly higher (P = .046) compared with tackle football players (Table 3). The Beck Self-Concept Inventory for Youth showed no significant difference between flag and tackle football players (Table 4) in self-reported self-concept (P = .168). All of the test results obtained from participating youth are summarized in Table 5.
Results of the Wechsler Intelligence Scale for Children a
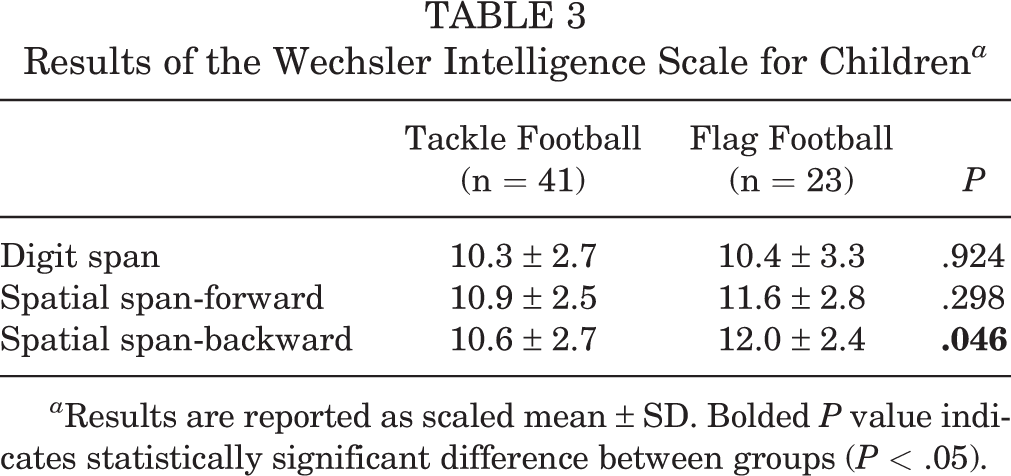
a Results are reported as scaled mean ± SD. Bolded P value indicates statistically significant difference between groups (P < .05).
Results of the Beck Self-Concept Inventory for Youth

Standardized Results From All Neuropsychological Tests a

a Results are reported as mean with [IQR] or ±SD. Bolded P value indicates statistically significant difference between groups (P < .05). BSCI-Y, Beck Self-Concept Inventory for Youth; FSIQ-2, 2-subtest IQ estimate; IQR, interquartile range; WISC-IV, Wechsler Intelligence Scale for Children-4th Edition.
Results of Testing and Survey for Parents
The CBCL-Parent Report Form showed no significant differences in any of the internalizing or externalizing behaviors/problems between tackle and flag football players (Table 6). The BRIEF-Parent Form showed no significant difference between flag and tackle football players on all of the measured results for executive functioning (Table 7) except for the Inhibit subtest score, which is a measure of impulsivity. On this measure, tackle football group scored significantly higher (P = .026) compared with the flag football group.
Results of the Achenbach Child Behavior Checklist-Parent Report Form a

a Results are reported as mean t-scores with [IQR] or ±SD. IQR, interquartile range.
Results of the Behavior Rating Inventory of Executive Function-Parent Form a

a Results are reported as mean t-score with [IQR] or ±SD. Bolded P value indicates statistically significant difference between groups (P < .05). IQR, interquartile range.
Results from the survey indicated that perceived concussion risk based on informal ranking alone was not significantly different between the flag and tackle football groups (n = 37; P = .194). The median score for tackle football was 5 (IQR, 4-8), while the median score for flag football was 7 (IQR, 4-9). Most parents (36%) indicated on the survey that they chose to put their child in tackle instead of flag football to prepare them for junior high football, while most flag football parents (45%) expressed concerns for tackle safety.
Discussion
Our data indicated that flag players scored significantly higher on Spatial Span Backward subtest with a mean scaled score of 12.0 compared with tackle players’ mean scaled score of 10.6 (P = .046). Tackle players had significantly higher Inhibit subtest scores, with a mean t-score of 45 compared with flag players’ mean t-score of 42 (P = .026). There were no significant differences in the BSCI-Y (self-reported self-concept, P = .168), 2 subtest IQ estimate (FSIQ-2, P = .916), Trail Making Test-A (P = .133), Trail Making Test-B (P = .458), Digit Span subtest (P = .924), or Spatial Span Forward subtest (P = .298). This suggests that, in general, children who play tackle football did not score significantly differently on standardized neuropsychological testing compared with children who play flag football.
Our primary objective was to determine whether there was an intrinsic difference that existed in children and families who choose to play tackle or flag football, which can potentially confound epidemiologic studies about reported injury rates. This is important as flag football participation has increased over the past decade with the promotion of its safety as an alternative to tackle football, even as data on head impact exposure between tackle and flag football continue to be limited and contradictory, suggesting that each type of football has its own inherent risks. 10,12,13,16,17,20 While we do not have a league-specific injury pattern data that could affect participation enrollment in this study, we presumed that these patterns would correlate with national data. Furthermore, injury rates for most of the leagues that we recruited from have been described previously by Peterson et al 12 as our study recruited from the same locations. Most tackle football leagues in the country have the same contact rules for all players. Flag football leagues have similar rules across the country in that a player is down if their flag is pulled from their waist, with additional prohibitions on hitting and tackling. 15,17
The Trails tests indicated that there were no differences between the 2 groups on mental set-shifting, attention, and cognitive processing speed. Similarly, while the WISC-IV did find a slight difference in the Spatial Span Backwards subtest (P = .046), there were no other significant differences in working or spatial memory. We believe that these results could be indicators of factors that can help prevent a child from becoming injured on the field if, for example, they had to switch suddenly between tasks like blocking or catching or if they simply had to pay attention to other players and assess their surroundings. Zendler et al 20 found that, even in nontackle football injuries, the most common contacting object was still another player. Furthermore, Radelet et al 6,13 also examined youth football injuries but did not attribute injuries to tackling over blocking or incidental person-to-person contact. This data indicates that athletes should be aware of their spatial surroundings to avoid unintentionally running into someone or becoming suddenly tackled, regardless of whether they are playing tackle or flag football. The similarity in the 2 groups on the Trails tests suggests that there is no significant difference in the ability to be flexible and modify a plan of action to avoid injury between the 2 groups, while the largely insignificant differences on the Wechsler Intelligence scale suggest working and spatial memory are also similar between the 2 groups.
A child’s self-concept, which is measured by the BSCI-Y, could also affect which injuries get reported. There has been much research studying the effect injuries can have on self-image and self-esteem. This also had no significant difference between flag and tackle football players.
Our data does not seem to support the idea that intrinsic differences exist between athletes who choose to play one type of youth football over another. Previous studies have found that, in female parents, perceived risk of tackle football and higher educational attainment has been associated with higher odds of supporting tackling age restrictions, whereas in male parents, having a child 6 to 12 years old was associated with supporting tackling age restrictions. 5 However, our study is the only study that we know of that examines how parents view their own child’s behavior and executive function. While children can tell their parents what type of sports they are interested in and therefore affect what their parents decide to enroll them in, many would agree that parents have the final say in what type of sports their child participates. Because of this, our results indicating that there was no difference in most of the parent-report questionnaires are important. There were no significant differences in subtests such as how a parent perceives their child’s emotional control or behavioral regulation, somatic complaints, attention problems, or aggressive behavior, which could potentially impact the perception a parent has on the seriousness of the injury their child received. This would potentially impact what types of injuries a parent decides to report to their child’s team and to their child’s healthcare professionals.
Because this study was focused on the neuropsychological and behavioral/emotional factors that drive a family to choose to play one type of football over another, it was important that both types of football were offered to the family so that the choice existed. The inclusion criteria of being in 4th to 6th grade was chosen in an attempt to find subjects in the age range for which both types would still be offered. However, 13 families incorrectly indicated that only 1 type was offered in their community. More than half of these responses indicated that they would have chosen to participate in the type of football they thought was their only option even if both types were available in their community. In addition, we confirmed that both types of football did exist within a 30-mile radius of where these subjects lived and that families may not have been aware of this because the alternative option was less suitable to their interests. Otherwise, they probably would have been able to enroll in either type of football because other participants in the same region and age played in the other football group.
There were only 2 significant differences on 2 subtests. While some of the significant differences did not match what would be expected from higher reported injury rates in flag versus tackle football—such as how tackle football players were more impulsive and flag football players had higher spatial memory—whether these are clinically different can be debated. However, because all of the other tests were not significantly different, we do not believe there is an intrinsic difference between kids and families who choose to play one type of football over another. Therefore, concerns that injury epidemiologic studies comparing flag with tackle football could be confounded by intrinsic differences in the children who choose to play each type seem to be unfounded. Instead, reported injury rates could actually reflect differences in things like helmet use in tackle but not flag football or differences in rules rather than behavioral differences such as aggressiveness or risk-taking between the 2 types of youth football. 10 Potential strategies to reduce head impacts have been proposed previously, such as increasing practice time so athletes can learn proper flag football techniques and that flag football coaches do not have to focus only on common skills such as passing, catching, and running over pulling an opponent’s flag without physical contact. 10,13
Limitations
The biggest limitation of this study was the small sample size, which can affect the power of our conclusions. While the BSCI-Y does not report minimal clinically significant differences or normal variance in test results, previous studies have found a standard deviation of 7 for this mood measure. 11 The BSCI-Y categorizes degree of severity in increments of 5 points. 3 Based on the BSCI-Y test standard deviations we observed (6.2 for tackle participants and 7.2 for flag participants) and the enrollment we achieved (41 and 23, respectively), we did achieve 80% power to detect a t-score difference of 5, if such a difference had existed. However, we observed only a small difference in BSCI-Y t-scores (53.7 vs 51.3) and to have 80% power to find statistical significance at P < .05 with an effect size that small (Hedges’ g = 0.4) and the same 1.78:1 enrollment ratio, we would have needed to recruit an additional 145 tackle and 81 flag participants. Even if that were achieved, the clinical relevance of such a small effect size would be debatable. Another limitation is the inequality between sample size numbers (23 flag football players and 41 tackle football players). However, the sample groups were not significantly different for measures such as socioeconomic status and age.
Another limitation was that the parents of 13 athletes indicated on the custom survey that their child did not have a choice between tackle and flag football because 1 type may not have been offered in their area for their age or because of scheduling conflicts. Although these parents indicated that their choices were limited, 4 of the 7 tackle and 4 of the 6 flag players further commented that, if they were given the option, they still would have chosen to play the only type they thought was offered. In general, both types of football were confirmed to be available in the community and it was determined that the family was most likely unaware of the alternative option because it was less suitable for their personal interests. Because of this, these subjects were still included in the final analysis.
Finally, further research is needed to determine whether there are other familial-intrinsic differences that we did not examine that could impact the choice between one type of football over another; including past injuries in the athlete or family, parental personal experience in each sport, and siblings’ experience in each sport.
Conclusion
While enrollment in tackle football programs is declining, flag football is increasing at the youth level. However, previous studies have found that reported injury rates are slightly higher in flag football players than in tackle football players. We conclude that concerns that previous injury epidemiologic studies comparing flag with tackle football could be confounded by intrinsic differences between kids that choose to play tackle football versus those that choose to play flag football seem to be unfounded. We hope that by alleviating the concern of these potential confounders, we can help inform the public debate on the safety of youth football.
Footnotes
Final revision submitted September 23, 2021; accepted November 24, 2021.
One or more of the authors has declared the following potential conflict of interest or source of funding: Funding was received from the Carver College of Medicine Summer Research Fellowship and the Iowa Primary Care Sports Medicine Research Fund. A.P. has received textbook royalties from McGraw-Hill, and his spouse has received consulting fees from Rhythm Pharmaceuticals. AOSSM checks author disclosures against the Open Payments Database (OPD). AOSSM has not conducted an independent investigation on the OPD and disclaims any liability or responsibility relating thereto.
Ethical approval for this study was obtained from the University of Iowa (ref No. 201805920).