
Abstract
Background:
Baseline concussion testing can be helpful to perform when providing concussion care for young athletes. To appropriately interpret these data, it is important to understand how certain factors may affect concussion testing.
Purpose:
To examine the relationship of sociodemographic and health variables with baseline concussion testing in young athletes.
Study Design:
Cross-sectional study; Level of evidence, 3.
Methods:
High school and middle school athletes competing in sports or positions at high risk for concussion (football, soccer, ice hockey, wrestling, lacrosse, and pitchers/catchers in baseball/softball) during the 2020-2021 or 2021-2022 academic years completed annual baseline concussion testing and were included in the study. Baseline data included self-reported demographic and medical information, a graded symptom checklist, the Standardized Assessment of Concussion, and the King-Devick test. A validated measure, HOUSES (HOUsing-based index of SocioEconomic Status), was used to determine participants’ socioeconomic status (SES) by linking personal address information to publicly available property data. Multivariable linear regression models were fit to analyze the relationship of concussion baseline testing to sociodemographic and health variables.
Results:
Among the eligible 2747 athletes (mean age, 15.4 ± 1.5 years; 73.6% male), the mean Standardized Assessment of Concussion score was 26.7 ± 2.0 and the mean best King-Devick test time was 50.3 ± 10.1 seconds. Higher baseline symptom severity scores were related to lower SES (P = .002). A lower (ie, poorer) mean Standardized Assessment of Concussion score was significantly associated with the following in the multivariable model: male sex (P < .001), younger age (P < .001), Black/African American race (P = .029), Hispanic ethnicity (P = .016), previous diagnosis of learning disorder or attention-deficit hyperactivity disorder (P < .001), and lower SES (P = .003). A higher (ie, poorer) mean King-Devick test time was related to younger age, previous diagnosis of a learning disorder or attention-deficit hyperactivity disorder, and lower SES (all P < .001).
Conclusion:
Baseline concussion testing was found to be associated with certain sociodemographic variables and underlying health conditions in high school and middle school athletes.
In the United States, approximately 1.1 to 1.9 million sport-related and recreation-related concussions occur in children and adolescents every year. 6 Appropriate evaluation of concussions in young athletes involves multiple assessments, including self-reported symptoms, neurocognitive evaluation, postural stability testing, and a neurological physical examination. If adequate resources are available, annual baseline concussion testing may be performed before the athletic season.4,27 Individual baseline scores can then be used as a benchmark of normal function for an athlete, allowing appropriate assessment of postconcussion assessments.
If baseline concussion testing is not performed, normative data are used as a comparison with postinjury evaluations. While appropriate in these circumstances, comparisons with normative data do not account for individual differences in cognition, balance, or vestibular/oculomotor function. This may result in over- or underestimating a change in performance after a suspected concussion and could lead to misdiagnosis.
Several variables have been found to potentially affect baseline concussion testing, including sex,5,8-12,39,42,43 age,5,8,11,18,19,43,48 race,18,44,46 and a history of learning disabilities8,10,13,18,29,31,32,38 and mental health conditions.10,11,32,45,47 Many of these previous studies were conducted in collegiate athlete populations, and thus less is known about the associations of demographic factors with baseline concussion testing in other populations, such as youth athletes.
In addition to certain demographic variables, previous studies have also found that socioeconomic status (SES) may influence baseline concussion testing in symptom reporting, 33 neurocognition,18,33,44 balance, 48 and vestibular/oculomotor function.44,46 These prior studies approximated SES using aggregate data such as median income by zip code, 48 binary variables such as free or reduced lunch eligibility33,46 and Title I school status, 44 or measures that can be difficult to collect and are not scalable, such as the Hollingshead Four Factor Index of Social Status. 18 While these measures can be used to estimate SES, they may fail to capture more detailed individual differences within groups.
One novel and validated individual-level measurement of SES is HOUSES (HOUsing-based index of SocioEconomic Status). HOUSES is an index that links an individual's home address to publicly available real estate property data from local assessors’ offices. HOUSES has been used as a valid measure of SES in several health outcome studies,1,2,7,15,20,36,40 including those in children.3,16,22,37
Understanding the relationship between sociodemographic factors and clinical measures of concussion is important to accurately evaluate these injuries, particularly when individual baseline assessments are absent and normative data are used for comparison. The purpose of our study was to examine the relationship of sociodemographic and health variables with baseline concussion testing in young athletes.
Methods
Study Sample
The protocol for this cross-sectional study was approved by our institutional review board. The cohort consisted of high school and middle school athletes, aged 11 to 19 years, competing in sports or positions with a high risk of concussion during the 2020-2021 or 2021-2022 academic year at 24 schools in southeast Minnesota. These sports and/or positions included football, wrestling, soccer, ice hockey, and lacrosse as well as baseball or softball at the pitcher or catcher position. These sports were considered high risk for concussion based on epidemiologic data from the High School Sports-Related Injury Surveillance Study 23 and the institution's experience. Pitcher and catcher positions in baseball and softball were also included because of the inherent risk of concussion at these positions. The analysis cohort was restricted to residents of 4 counties in southeast Minnesota who had authorized the use of their health records for research purposes in accordance with Minnesota law. Access to health records was needed to obtain home addresses for the derivation of the HOUSES index. The HOUSES index was only available for residents of these 4 counties in southeast Minnesota at the time of this study.
Self-Reported Demographic Information, Sports Participation, and Medical History
As part of an ongoing collaboration between Mayo Clinic and the participating school districts, a series of standardized data collection forms were created in Research Electronic Data Capture (REDCap) (Vanderbilt University), a secure, web-based application used to collect and organize data. 17 Athletic trainers at each school were responsible for sending an email invitation to each athlete that included a person-specific link to the REDCap system. Before the athletic season, each athlete, with guidance from their parent/guardian, was requested to complete a REDCap survey that included 3 sections: demographic information, sports participation, and concussion-relevant past medical history.
The demographic characteristics of each participant included athlete age, sex, sport(s), positions(s), and level of play. Relevant past medical history pertaining to concussion was also obtained, including the number of previously diagnosed concussions and dates and recovery times of all prior concussions. Participants also indicated if they had ever received a previous diagnosis of headaches, migraines, learning disorder (LD), dyslexia, attention-deficit disorder (ADD) or attention-deficit hyperactivity disorder (ADHD), depression, anxiety, or psychiatric disorders.
SES, Race, and Ethnicity
HOUSES was used to determine participants’ SES and is a validated, individual-level SES measure that has been used in several previous studies. ¶ HOUSES is an index that links personal address information in clinical data to property data available from local government assessors’ offices. Individual HOUSES scores were created by summing a z score for the number of bedrooms, number of bathrooms, square footage, and estimated value of a housing unit. This z score can be used as a continuous or categorical variable (quartiles). The z score is directly related to the SES, with higher z scores correlating with higher SES. 20 Individual athletes were categorized into 1 of 4 HOUSES quartiles by comparing their z score to the distribution of z scores for each county in this region (Q1 = lowest SES quartile, Q4 = highest SES quartile).
The home address of each athlete for the determination of HOUSES was obtained via the Rochester Epidemiology Project (REP) database. The REP database links health record data across a 27-county region in southern Minnesota and western Wisconsin. The REP database also collects and maintains a history of home addresses for each individual, as well as race and ethnicity data.34,35,41 Home addresses and race and ethnicity data were only identified for participants who authorized the use of their health records for research purposes.
Baseline Concussion Testing
Before the athletic season, athletes completed a battery of baseline concussion tests, including a graded symptom checklist, the Standardized Assessment of Concussion (SAC), and the King-Devick (K-D) test. Athletic trainers at each school were responsible for administering baseline concussion testing and entering these data into the REDCap database. All testing was conducted at the local high school or middle school.
The graded symptom checklist and SAC are both part of the Sport Concussion Assessment Tool (SCAT) and are widely used to assess symptoms and neurocognitive impairment, respectively, after a concussion.24-26 At the time of this study, the SCAT 5th Edition was the most recent version of the SCAT and was thus utilized. The graded symptom checklist assesses for 22 symptoms on a 6-point Likert scale and may be calculated as a total symptom score (maximum score, 22) or total symptom severity score (maximum score, 132). The SAC assesses orientation, immediate memory, concentration, and delayed recall. A total SAC score is derived from these assessments, with a maximum score of 30.
The K-D test is a timed assessment of oculomotor function. Participants read a series of numbers aloud as quickly as possible on 3 different sets of cards. Each set is progressively more difficult. The cumulative time to read all 3 cards without error is reported as the score. This test is repeated twice by the participant, with the best time recorded as the K-D test baseline. The K-D test has high internal consistency in pediatric populations. 28
Statistical Analysis
Statistical analysis was performed using the SAS Version 9.4 software package (SAS Institute Inc). Results are descriptively summarized using frequency and percentages for categorical variables and means with SDs or medians with interquartile ranges (IQRs) for continuous variables. P values for testing for a trend across the 4 HOUSES quartiles were calculated with the use of linear regression (for age), the Jonckheere-Terpstra test (for number of sports and categorized symptom scores), the Cochran-Mantel-Haenszel test (for race), and the Cochran-Armitage test (for all binary characteristics). Univariate and multivariable linear regression models were fit to analyze the relationship of the forementioned characteristics with each baseline concussion measure (dependent variables), SAC score, and best K-D test time. Results with P values <.05 were considered statistically significant.
Results
A total of 2747 athletes who participated in at least 1 sport or position with a high risk of concussion and who had available data on baseline concussion testing, self-reported information, and a HOUSES index were included in the analysis (Figure 1). Among these athletes, the mean age was 15.4 ± 1.5 years, 73.6% were male, 83.3% were White, and 93.0% were non-Hispanic. Demographic data by HOUSES index are presented in Table 1; 12.0% were in Q1 (lowest SES), 17.6% in Q2, 26.7% in Q3, and 43.7% in Q4 (highest SES).
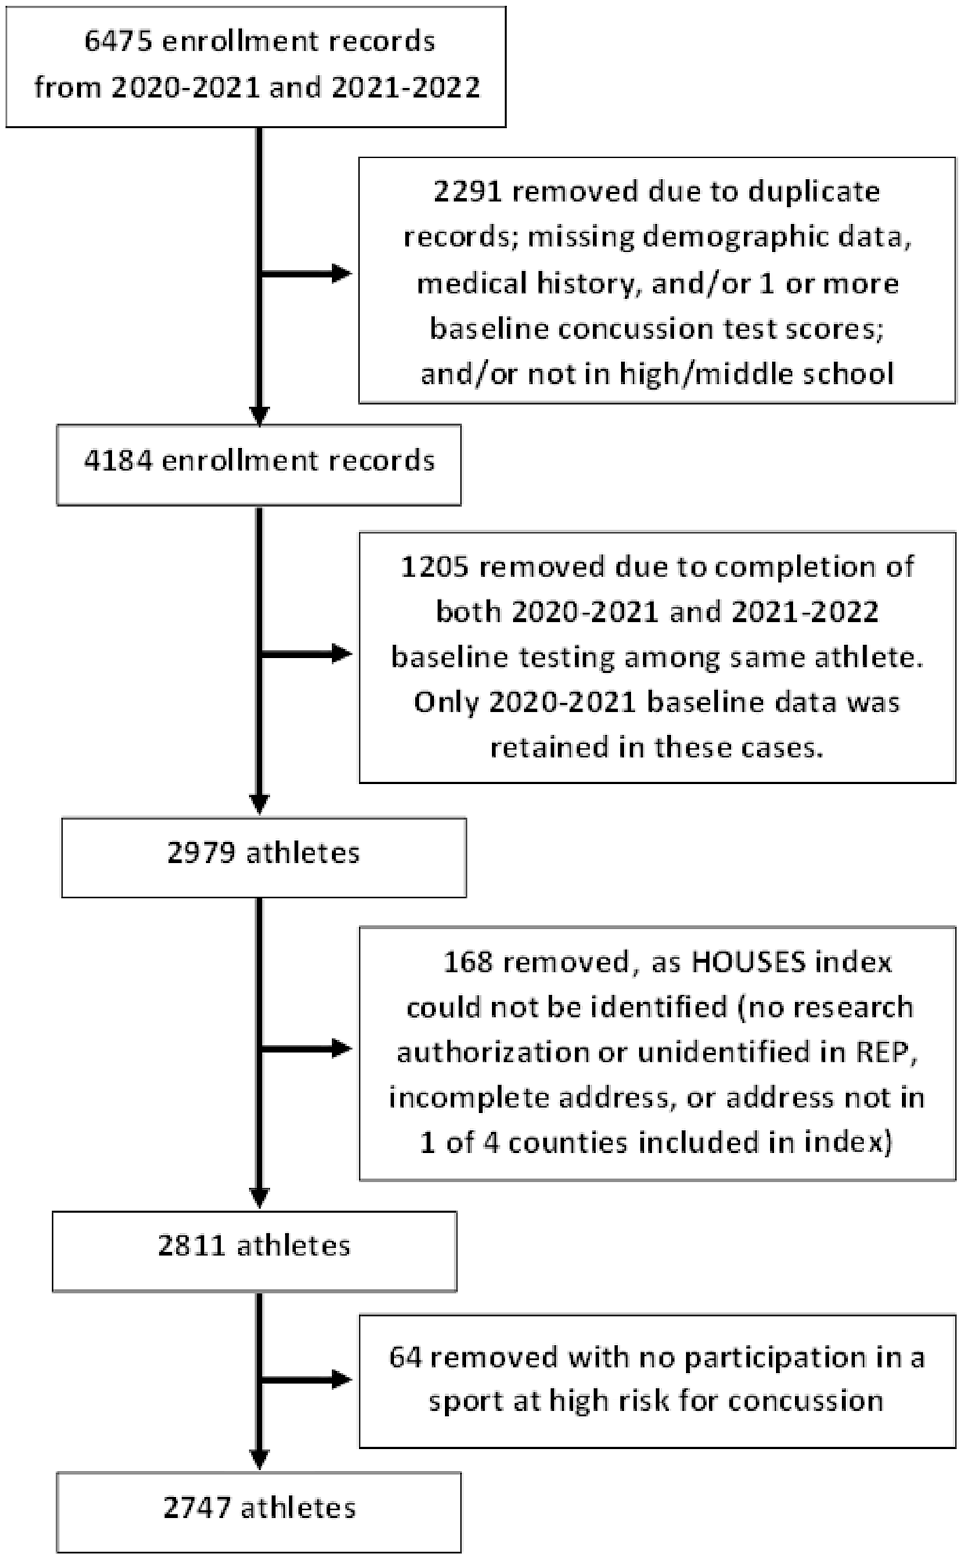
Flowchart of participant inclusion and exclusion process. HOUSES, HOUsing-based index of SocioEconomic Status; REP, Rochester Epidemiology Project.
Athlete Characteristics, Sports Participation, and Medical History by HOUSES Index Quartile a
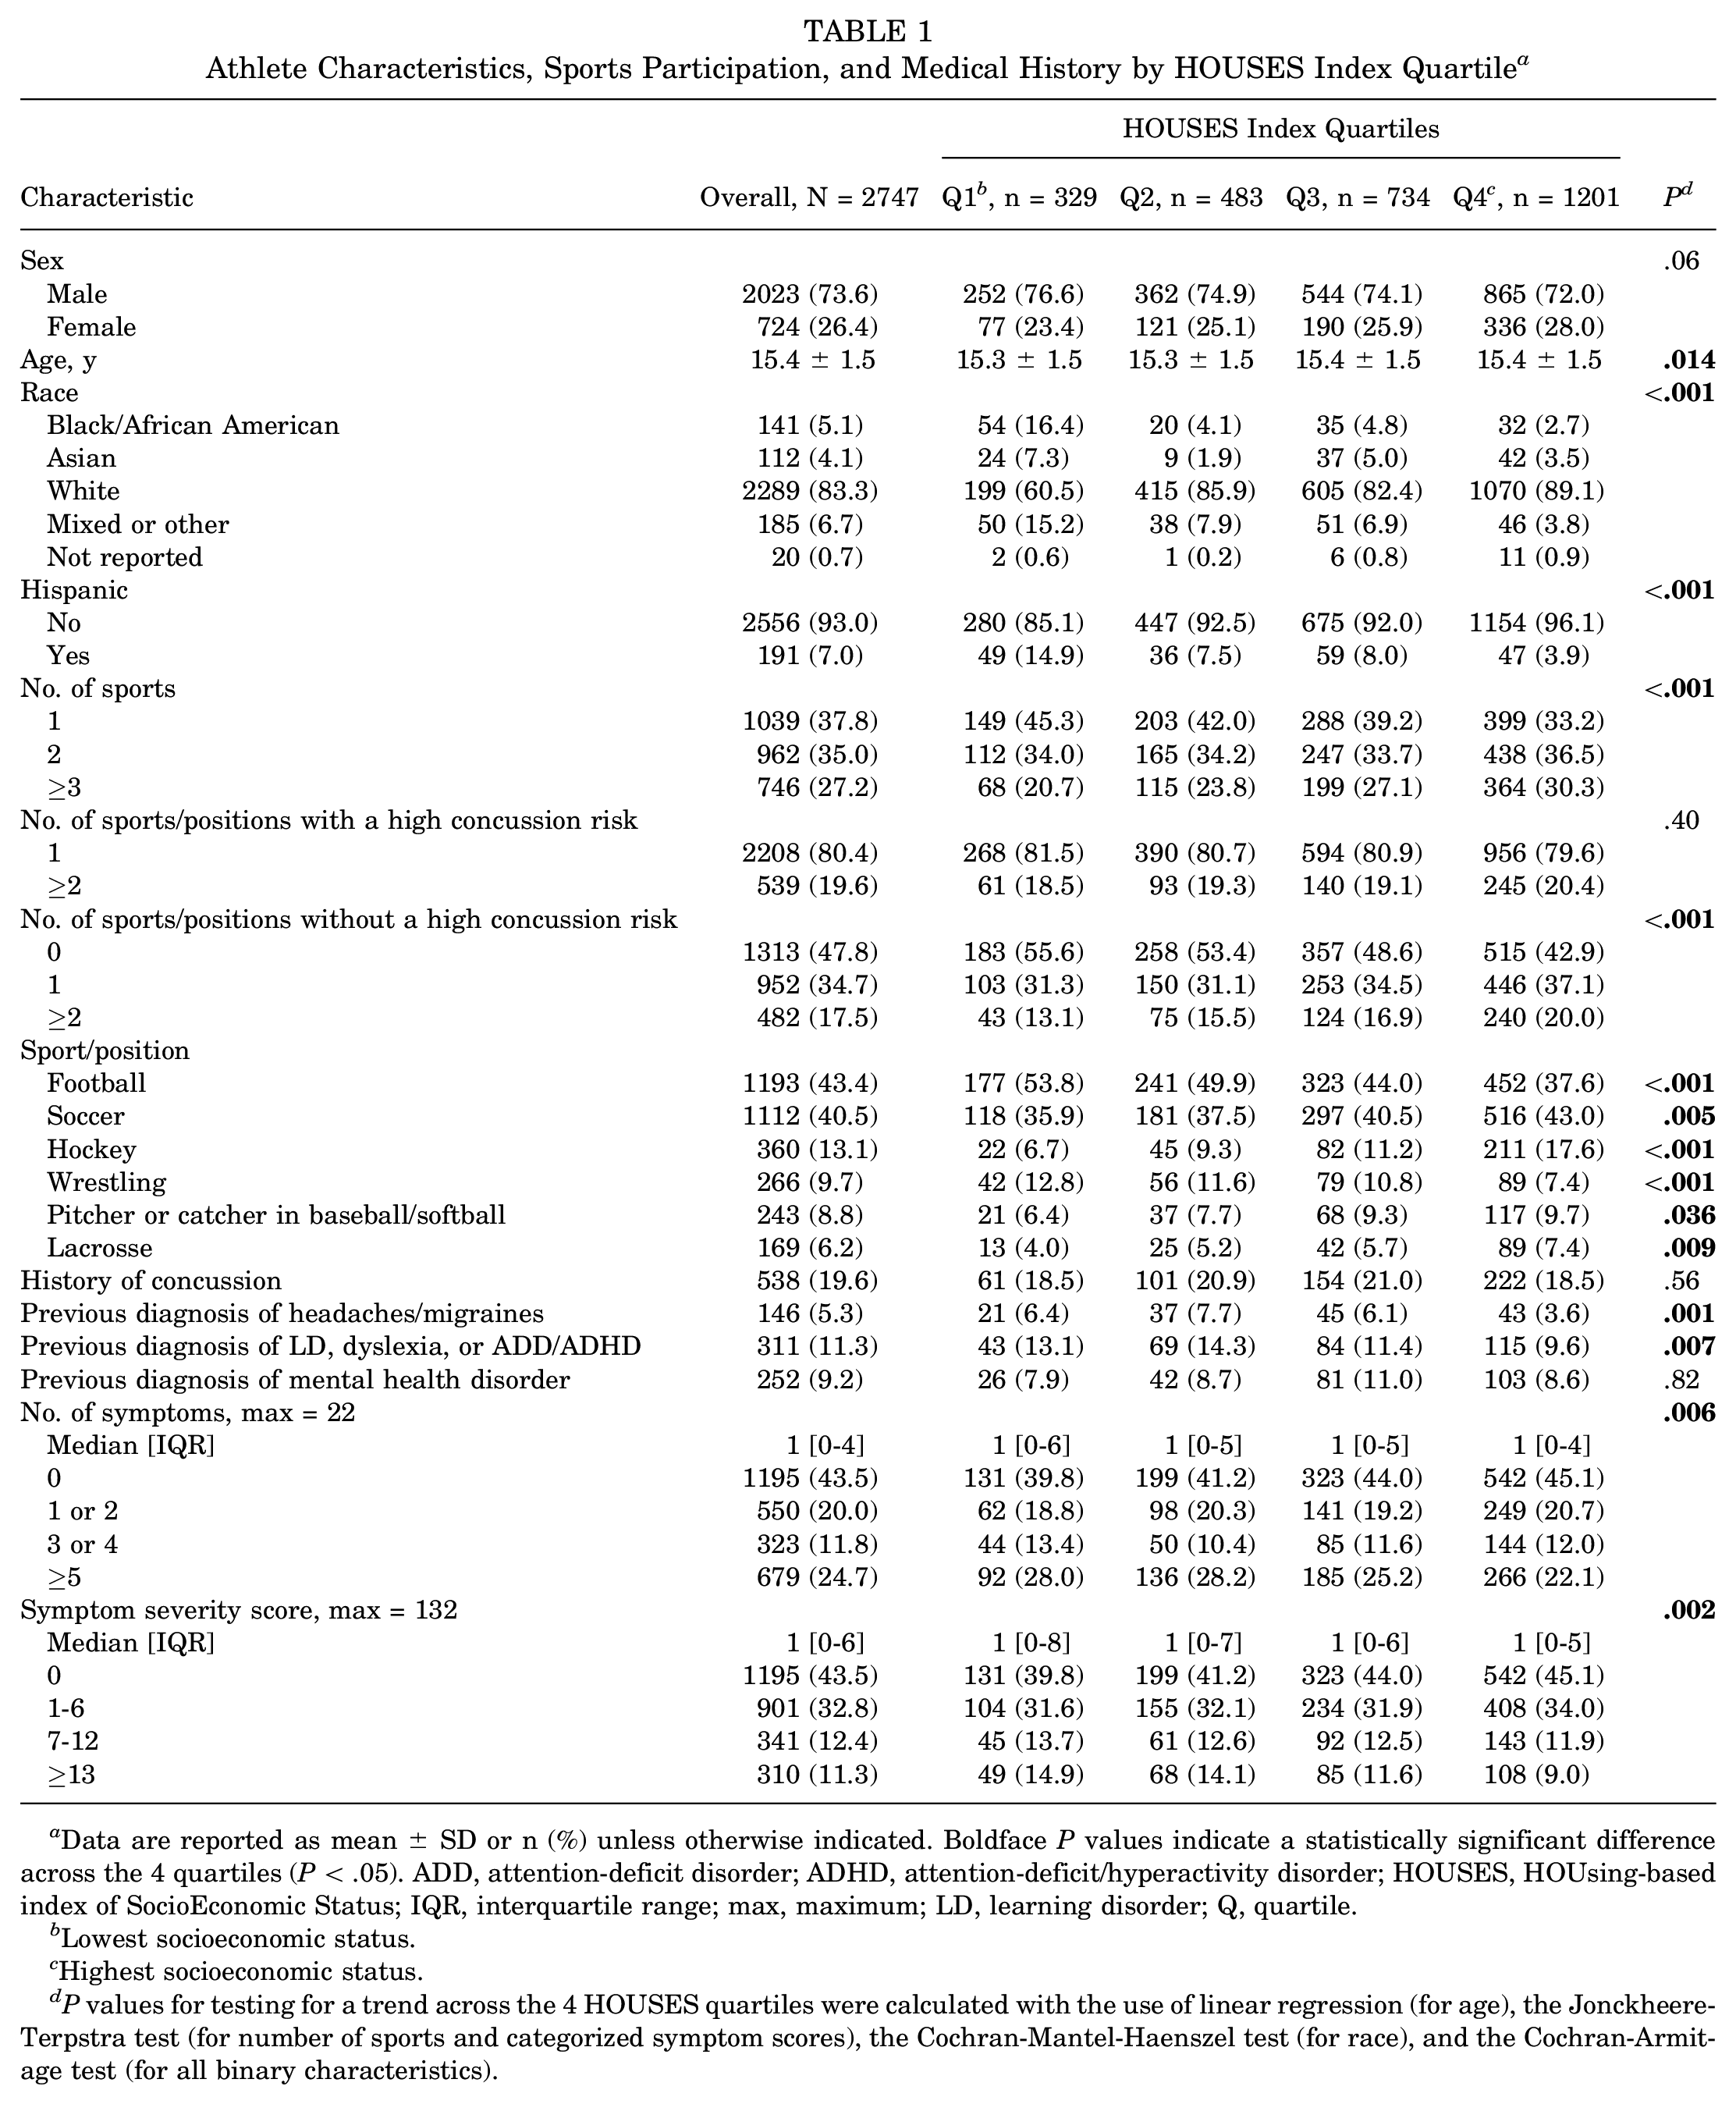
Data are reported as mean ± SD or n (%) unless otherwise indicated. Boldface P values indicate a statistically significant difference across the 4 quartiles (P < .05). ADD, attention-deficit disorder; ADHD, attention-deficit/hyperactivity disorder; HOUSES, HOUsing-based index of SocioEconomic Status; IQR, interquartile range; max, maximum; LD, learning disorder; Q, quartile.
Lowest socioeconomic status.
Highest socioeconomic status.
P values for testing for a trend across the 4 HOUSES quartiles were calculated with the use of linear regression (for age), the Jonckheere-Terpstra test (for number of sports and categorized symptom scores), the Cochran-Mantel-Haenszel test (for race), and the Cochran-Armitage test (for all binary characteristics).
Differences in Demographic Information, Sports Participation, and Medical History
As presented in Table 1, race and Hispanic ethnicity were significantly different across the HOUSES indices (P < .001 for both), with a lower percentage of students identifying as White and non-Hispanic in Q1.
Athletes with a higher SES were more likely to participate in a greater total number of sports of any type (P < .001) as well as a greater number of sports without a high risk of concussion (P < .001). This relationship between SES and number of sports was not observed when only sports or positions with a high risk of concussion were considered; however, only 539 (19.6%) athletes reported participating in ≥2 such sports or positions (483 in 2 sports, 55 in 3 sports, and 1 in 4 sports). Athletes in the lower-SES quartiles were significantly more likely to participate in football or wrestling (both P < .001 based on a test for trend across quartiles), whereas those in the higher-SES quartiles were significantly more likely to participate in hockey, lacrosse, or soccer (P < .001, P = .009, and P = .005, respectively, based on a test for trend across the quartiles).
Athletes in the highest SES quartile were significantly less likely to report ever being diagnosed with headaches or migraines (P = .001) or an LD, dyslexia, or ADD/ADHD (P = .007). There was no association between SES and a history of concussion or previous diagnosis of a mental health condition.
Among all eligible athletes, the median symptom severity score was 1 (IQR, 0-6); 43.5% had a score of 0, 32.8% a score of 1 to 6, 12.4% a score of 7 to 12, and 11.3% a score ≥13. As shown in Table 1, a lower-SES quartile was associated with both a larger baseline number of symptoms and higher baseline symptom severity scores (P = .006 and .002, respectively, based on a test for trend across quartiles).
Relationship of Sociodemographic Variables and Medical History With Baseline Concussion Testing
The overall mean SAC score was 26.7 ± 2.0, and the mean best K-D test time was 50.3 ± 10.1 seconds. The following factors were significantly related to a lower (ie, poorer) mean SAC score based on univariate analysis: male sex (P < .001); younger age (P < .001 for age 11-13 years vs 14-16 and 17-19 years); Black/African American race (P = .025 for Black/African American vs all other races combined); Hispanic ethnicity (P = .006); previous diagnosis of LD, dyslexia, or ADD/ADHD (P < .001); and lower-SES quartile (P < .001 for Q1 vs Q2, Q3, and Q4, respectively) (Table 2). A lower SAC score was correlated with a lower HOUSES z score (r = 0.08; P < .001) and younger patient age (r = 0.12; P < .001) when continuous variables were used.
Results of Univariate Linear Regression Analysis of the Relationship Between Athlete Characteristics and Baseline Concussion Testing a

Data are reported as mean ± SD. Boldface P values indicate statistical significance (P < .05). ADD, attention-deficit disorder; ADHD, attention-deficit/hyperactivity disorder; HOUSES, HOUsing-based index of SocioEconomic Status; K-D, King-Devick; LD, learning disorder; Q, quartile; SAC, Standardized Assessment of Concussion.
The SAC score ranges from 0 to 30, and a higher SAC score is more favorable.
The best K-D test time is based on the lowest time in seconds from 2 trials.
Each categorical characteristic was evaluated in a separate linear regression model, with SAC score and best K-D test time as the dependent variables.
When examining the best K-D test time per athlete, individuals with a previous diagnosis of LD, dyslexia, or ADD/ADHD had on average a higher (ie, poorer) best K-D test time (P < .001). Similarly, athletes in the lowest-SES quartile and younger age-group had on average a higher best K-D test time (both P < .001). When continuous variables were used, a higher SAC score was correlated with a lower HOUSES z score (r = −0.10; P < .001) and younger patient age (r = −0.35; P < .001).
A multivariable linear regression model was fit, separately for SAC score and best K-D test time, including all the student characteristics listed in Table 2 except for previous diagnosis of mental health disorder and previous diagnosis of headaches or migraines. The results of each full multivariable model are presented in Table 3.
Results of Multivariable Linear Regression Analysis of the Relationship Between Athlete Characteristics and Baseline Concussion Testing a

Data are reported as estimate (standard error). Boldface P values indicate statistical significance (P < .05). ADD, attention-deficit disorder; ADHD, attention-deficit/hyperactivity disorder; Adj, adjusted; HOUSES, HOUsing-based index of SocioEconomic Status; K-D, King-Devick; LD, learning disorder; Q, quartile; SAC, Standardized Assessment of Concussion.
The SAC score ranges from 0 to 30, and a higher SAC score is more favorable.
The best K-D test time is based on the lowest time in seconds from 2 trials.
The intercept value represents the mean value for a 15-year-old White non-Hispanic boy with a HOUSES index of Q4, involved in 1 sport or position with a high risk of concussion and without a history of concussion, LD, dyslexia, or ADD/ADHD.
In the adjusted analysis, the adjusted SAC score was lower for each of the following comparisons: 0.4 points lower for boys compared with girls (P < .001), 0.4 points lower for Black/African American compared with White athletes (P = .029), 0.4 points lower for Hispanic compared with non-Hispanic athletes (P = .016), 0.9 points lower for athletes with an LD, dyslexia, or ADD/ADHD diagnosis compared with those without such a previous diagnosis (P < .001), and 0.4 points lower for HOUSES Q1 compared with HOUSES Q4 (P = .003) (Table 3). The adjusted SAC score was 0.16 points higher per 1-year increase in age (P < .001).
The adjusted best K-D test time was on average 2.3 seconds shorter per 1-year increase in age; 5.9 seconds longer for athletes with a history of LD, dyslexia, or ADD/ADHD; and 2.1 seconds longer for athletes in HOUSES Q1 vs Q4 (each P < .001). When evaluating the combined effect of the last 2 factors, athletes in Q1 with a history of LD, dyslexia, or ADD/ADHD had a mean adjusted K-D test time that was 7.1 seconds slower than that of athletes in Q4 without such a history (P < .001).
Discussion
Overall, our study found that sociodemographic factors and past medical history were associated with differences in baseline concussion testing among middle school and high school athletes. Athletes from lower-SES quartiles reported a greater number of symptoms and higher symptom severity scores. Rexrode et al 33 also found that high school athletes with lower SES, as determined by eligibility for free or reduced cost lunch, had higher symptom severity scores on baseline concussion testing. Because most athletes in our study reported few or no symptoms, the distribution of number of symptoms and symptom severity scores was skewed. There is a large amount of existing literature on associations between baseline symptoms and several other variables, including sex,5,8,9,11,12,42 race, 44 history of depression or anxiety,10,11,32,45,47 and history of LD or ADD/ADHD.8,10,13,31,32 Therefore, given this previous research and our skewed distribution of symptom results, we did not report associations of demographic variables or medical history with symptom reporting in this study.
We found that sex, age, race, ethnicity, SES, and a previous diagnosis of LD, dyslexia, and/or ADD/ADHD were all associated with differences in baseline SAC scores. Several studies have shown that female athletes tend to outperform male athletes on baseline concussion neurocognitive testing, particularly SAC, at the high school,8,43 collegiate,8,9,39 and elite 42 levels. Prior research also supports an association of a previous LD and/or ADD/ADHD diagnosis8,31 and younger age 43 with lower SAC scores. While previous studies have demonstrated a relationship between race, ethnicity, and SES with computerized neurocognitive assessments,18,33,44 the current study is the first, to our knowledge, to report significant associations of race, ethnicity, and SES with baseline total SAC scores.
Athletes in the current study with a previous diagnosis of LD, dyslexia, and/or ADD/ADHD had poorer K-D test performance. The K-D test was originally developed as a tool to assess the relationship between oculomotor function and reading difficulties. 14 Given that an LD, dyslexia, and ADD/ADHD often affect reading skill and have been shown to alter normal saccadic eye movements, 30 this relationship between LD, dyslexia, and ADD/ADHD and best K-D test time is not unexpected and is consistent with previous research.29,30
Younger athletes and those with a lower SES also demonstrated slower K-D test times in the current study. White-Schwoch et al 48 found that K-D test times improved with increasing age among youth football players but did not observe an association with SES. In this study by White-Schwoch et al, SES was approximated by referencing a participant's zip code to US Census data of median income for that area and thus did not consider individual-level SES. Similarly, Wallace et al44,46 used school-level SES measures (Title I status and free and reduced lunch status) but found that athletes from lower-SES schools had slower K-D test times on average.
When the effect of both SES and history of LD, dyslexia, or ADD/ADHD was examined, we found that the best K-D test time was found to be >7 seconds longer for athletes in the lowest-SES quartiles with a history of LD, dyslexia, or ADD/ADHD compared with those in the highest-SES quartile without such a history. This significant difference in best K-D test time demonstrates the combined effect of SES and LD/ADHD on baseline concussion oculomotor tests. We recognize that the K-D test is rarely used without a baseline measure; however, when establishing this baseline or when evaluating postinjury K-D test times, an athlete's SES or history of LD may provide insight into slower times.
In addition to associations of sociodemographic and health variables with baseline concussion testing, our study also found several noteworthy findings in relationships between SES and sports participation. Athletes with a higher SES were found to participate in more sports overall, and these sports tended to be those at lower risk for concussion. A previous review by Kuhn et al 21 supports this finding, concluding that young athletes from a lower SES participate in fewer sports, which may be the result of limited resources, lack of time, and less financial and familial support. When evaluating sports we deemed to be at high risk for concussion, athletes from a lower SES were more likely to participate in football and wrestling, while those from a higher SES were more likely to participate in hockey, lacrosse, and soccer. These differences may be explained by the availability of sports at different schools and the disparities in access to the equipment and resources required for certain sports between SES groups.
Strengths and Limitations
Our study evaluated a large data set that consisted of baseline testing, demographic data, and medical history for >2700 athletes at 24 different high and middle schools. We were able to capture many important variables that impact baseline testing, such as past medical history, demographic characteristics, and SES. Additionally, our study was the first to use a validated, objective, individual-level measure of SES to more accurately assess the effect of SES on baseline concussion testing.
This study has several limitations. The study population was limited to high school and middle school athletes in southeast Minnesota and was predominantly White (83.3%) and non-Hispanic (93.0%); therefore, the results may not be generalizable to all high school athletes. If a personal address was not obtained or a HOUSES quartile could not be determined for an athlete, that athlete was excluded from data analysis. There may be a difference between athletes who have a personal address documented and those who do not, which could affect the validity of the results. Additionally, much of the past medical history is self-reported, and not all was verified within the medical records, so there is potential for under- or overreporting of these variables.
Despite statistical significance, the differences in SAC scores between groups are small. Because of the large number of participants in our study, modest differences found between groups may be statistically significant but not clinically meaningful. A previous diagnosis of LD and/or ADD/ADHD was associated with the largest difference in the adjusted mean SAC score, with a nearly 1-point decrease for those with an LD or ADD/ADHD diagnosis compared with those without. As mentioned previously, an association between a previous diagnosis of LD and/or ADD/ADHD and lower total SAC score has been observed in previous studies among high school athletes.8,31 This relationship is also clinically plausible given the effect of LD and ADD/ADHD on cognitive performance. Furthermore, given the high sensitivity of SAC for detecting concussions, 25 a 1-point difference in SAC score may be clinically relevant.
Conclusion
In the current study, baseline concussion testing was found to be associated with certain sociodemographic variables and underlying health conditions in high school and middle school athletes. While normative data for concussion testing are available, our study suggests that assessments are influenced by several demographic and health variables, and thus normative data may not be appropriate to use when interpreting postconcussion assessments in all athletes. These findings emphasize the importance of baseline testing to establish individualized concussion assessment standards for each athlete.
Footnotes
Acknowledgements
A special thank you to the local athletic trainers and sports medicine staff who assisted in baseline concussion testing.
Final revision submitted June 5, 2023; accepted July 31, 2023.
The authors declared that they have no conflicts of interest in the authorship and publication of this contribution. AOSSM checks author disclosures against the Open Payments Database (OPD). AOSSM has not conducted an independent investigation on the OPD and disclaims any liability or responsibility relating thereto.
Ethical approval for this study was obtained from Mayo Clinic (reference No. PR17-006025-05).