
Abstract
Background:
Abnormalities in hip rotational motion (HRM) are risk factors for throwing injuries. To evaluate hip rotational motion, it is necessary to assess the torsion angle. However, no studies have investigated the femoral torsion angle (FTA) in baseball players.
Purpose:
To investigate differences in hip FTA of adult baseball players through use of ultrasonography to evaluate the relationship between the FTA and HRM.
Study Design:
Cross-sectional study; Level of evidence, 3.
Methods:
A total of 149 elite male baseball players (mean age, 20.0 ± 1.8 years; 64 pitchers, 85 position players) were enrolled in this study. Ultrasonographic assessment of FTA was performed based on the tilting angles of the anterior surface of the femoral neck and condylar axis. The hip internal rotation (HIR) and hip external rotation (HER) were assessed at 0° and 90° of flexion. Data related to FTA and HRM were compared between hips and between pitchers and position players.
Results:
No significant difference was observed in the FTAs between hips for any player (lead hip, 20.5° ± 9.2°; trail hip, 19.6° ± 9.8°; P = .276). No significant difference was observed in FTAs of both hips between pitchers and position players (lead hip, 20.1° ± 9.4° and 20.9° ± 9.0°, respectively, P = .957; trail hip, 19.5° ± 9.8° and 19.7° ± 9.8°, P = .999). In terms of HER in 90° of hip flexion in both hips, significant differences were observed in HRM variables between pitchers and position players (lead hip, 33.0° ± 8.9° and 37.5° ± 9.8°, respectively, P = .024; trail hip, 35.6° ± 9.6° and 40.4° ± 10.2°, P = .035). Linear regression analysis revealed a significant agreement between the FTA and HIR at both 0° (R = 0.298, P < .001) and 90° of hip flexion (R = 0.279, P < .001).
Conclusion:
Our findings indicated that FTAs were not different between the hips of elite baseball players. Abnormalities of the HRM are not caused by differences in the FTA but rather involve soft tissue tightness around the hip area or other bony morphologic factors in the hip joint.
Historically, shoulder and elbow injuries occur in approximately 20% to 70% of adult baseball players. 8,9,29,40 To prevent these injuries, studies have investigated several risk factors. 1,3,5,8,27,34,38,49 Recently, the “kinetic chain” concept has become popular, and the importance of the function of the lower extremities has received more attention. 11,14,15,19,20,24 Because the lower extremities provide energy through the trunk to the shoulder, elbow, hand, and the ball during the throwing motion, dysfunction of any component of the chain affects throwing performance and potentially increases the risk of injury in the subsequent segments. 11,14,15,19,20
The hip initiates spinal rotation during trunk rotation required for throwing motions. 26 Symmetric rotational profiles should be observed between hips and across positions in the field 10,39 because abnormalities in hip rotational motion (HRM) have been reported as risk factors for throwing injuries. 3,27,38 Decreased hip internal rotational motion (HIR) at 90° of hip flexion has been indicated as a risk factor for shoulder, elbow, hip, back, groin, and hamstring injuries in baseball players. 3,27,38 Conversely, decreased hip external rotational motion (HER) of the lead hip (contralateral to the side of throwing dominance) at 0° of hip flexion is significantly and negatively related to the dominant shoulder external rotation torque and horizontal adduction motion during the throwing motion. 24 Therefore, decreased HER and decreased HIR can be considered risk factors for throwing injuries. Changes in HRM over the course of the season, and significant decreases from the preseason to the postseason, have been observed for several HRMs in professional baseball players. 4,50 Therefore, HRM should be carefully observed throughout the season to prevent throwing injuries.
To evaluate joint rotational motion, it is necessary to assess the bony morphologic characteristics as well as the range of motion. During the assessment of shoulder rotational motion, the throwing limb of baseball players demonstrates greater humeral retrotorsion than the nonthrowing limb. 23,32,42,43,45 Because humeral retrotorsion significantly correlates with shoulder rotational motion, rotational motion is assessed after adjustment for side-to-side differences in humeral retrotorsion. 16,45 However, to the best of our knowledge, no study has investigated the characteristics of the femoral torsion angle (FTA), which describes the relative rotation between the femoral shaft and neck, 33 and relationships between FTA and HRM variables in a statistically meaningful number of baseball players.
Computed tomography (CT) has been considered the gold standard for an accurate evaluation of the bony morphologic characteristics of the hip joint. 10,31,41,46,48 No significant differences were identified between hips in terms of FTA or acetabular version in a study of 11 adult baseball players. 10 However, because of its additional radiation exposure, CT evaluation of bony morphologic characteristics for a large number of healthy participants is problematic. A recent study reported that ultrasonographic assessment was a valid alternative to CT and provided high accuracy and reliability in FTA evaluation. 44 Ultrasonography is a noninvasive method independent of radiation exposure that is useful for FTA assessments. This study aimed to use ultrasonography to investigate in adult baseball players the differences in the FTA between the hips and across player positions, as well as the relationship between the FTA and HRM. We hypothesized that there would be no differences in FTAs between hips, whereas FTAs would be correlated with HRM variables.
Methods
Participants
This was a cross-sectional study of 151 collegiate or amateur baseball players who attended medical checkups at a single institution during the off-season between December 2018 and January 2019. Questionnaires were administered regarding age, height, weight, throwing arm dominance, baseball playing experience, baseball positions, and current and past extremity injuries, including fractures and epiphysitis. Participants were excluded if they had current or past injuries, pain, or obvious tenderness in the lower extremities. The study was performed after obtaining written informed consent from all participants and approval from the institutional review board of institution.
Ultrasonographic Assessment of the FTA
The bilateral FTA was assessed using ultrasonography as described and validated in our previous study. 44 All assessments were performed by a single orthopaedic surgeon (S.T.) with 7 years of experience performing ultrasonographic assessments.
Participants were in the supine position on a portable treatment table with 0° of hip and knee flexion. Their heels rested on another table separate from the rest of the body to allow ultrasonographic examination of the posterior aspect of the knee. The lower extremities were fixed rigidly and individually in the most relaxed position to avoid extra rotational stress on their knees. A 6- to 15-MHz linear matrix array ultrasound transducer (LOGIQ S7; GE Healthcare) was used. A digital inclinometer (BevelBox; AS ONE Co) was fixed on the anterior surface of the transducer parallel to the transducer lens, which was verified using a bubble level (Figure 1). The digital inclinometer had 0.1° resolution and ±0.1° repeatability.
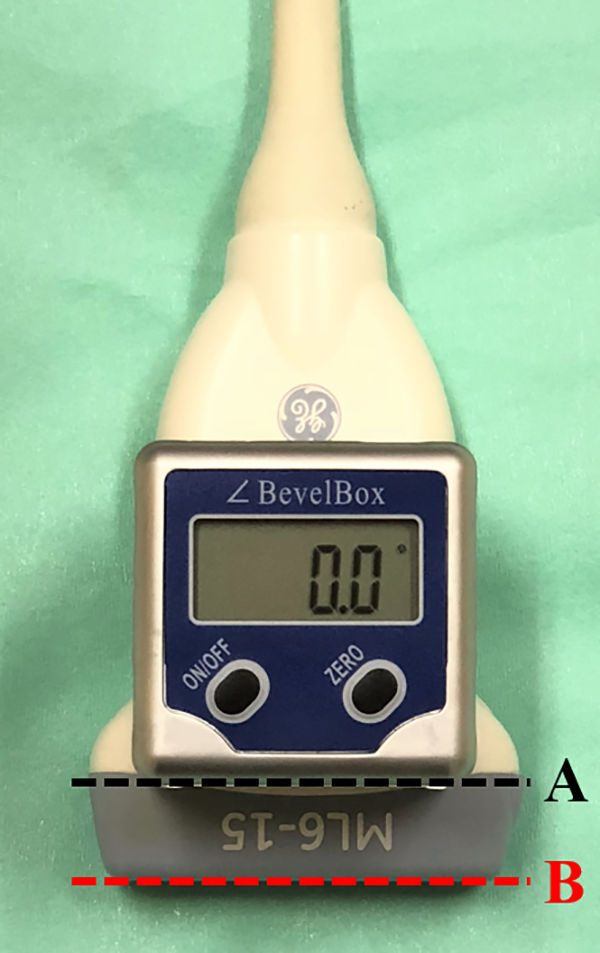
The ultrasound transducer with a digital inclinometer. A digital inclinometer was fixed onto the anterior surface of the transducer to verify that the inferior surface of the inclinometer (line A) is parallel to the transducer lens (line B).
First, to assess the tilting angle of the femoral neck, the transducer was positioned on the participant’s anterior aspect of the thigh with a standard coupling gel (Figure 2A). The frequency, depth, and gain were set to 8 Hz, 40 to 60 mm (depending on the physique of each patient), and 50, respectively. The examiner scanned the femur from the shaft to the greater trochanter, until the anterior tubercle of the greater trochanter, onto which the iliofemoral ligament lateral fascicle attaches (unnamed tubercle), 28,30 appeared on the proximal part of the intertrochanteric line. Subsequently, the transducer was rotated around the unnamed tubercle until the femoral head was clearly visible and tilted so that the line connecting the anterior apices of the femoral head and the unnamed tubercle was parallel to the horizontal plane on the ultrasound display (Figure 3A). Then, the angle between the anterior surface of the femoral neck and the horizontal plane was recorded as the femoral neck angle using an inclinometer. Second, to assess the tilting angle of the condylar axis, the transducer was positioned on the posterior aspect of the knee (Figure 2B). The frequency, depth, and gain were set to 12 Hz, 30 to 40 mm (depending on the physique of each patient), and 50, respectively. The transducer was tilted to ensure that the line connecting the posterior apices of the medial and lateral condyles was parallel to the horizontal plane on the ultrasound display (Figure 3B). Next, the angle between the condylar axis and the horizontal plane was recorded as the condylar axis angle using an inclinometer. Finally, if the condylar axis was externally rotated, then the FTA was calculated by subtracting the condylar axis angle from the femoral neck angle. If the condylar axis was internally rotated, the FTA was calculated by adding the condylar axis angle to the femoral neck angle. On average, it took 10 to 15 seconds for each ultrasonographic assessment of the FTA, which was performed 3 times, and the average of the 3 trials was used for data analysis.

The transducer position during ultrasonographic assessment. The transducer was positioned on the participant’s anterior aspect of the thigh to assess the tilting angle of the femoral neck (A) and on the posterior aspect of the knee to assess the tilting angle of the condylar axis (B).

Ultrasonographic assessment of the femoral torsion angle. (A) Ultrasonographic image of the anterior surface of the femoral neck where the apices of the femoral head and the tubercle (white triangles) are aligned horizontally on the display (white dotted line). (B) Ultrasonographic image of the condylar axis where the posterior apices of the medial and lateral condyles (white triangles) are aligned horizontally on the display (white dotted line). FH, femoral head; LC, lateral condyle; MC; medial condyle; T, anterior tubercle of the greater trochanter.
The side-to-side difference in FTAs between the lead hip and the trail hip (ipsilateral to the side of throwing dominance) was defined as the d-FTA, which was calculated by subtracting the FTA of the lead hip from that of the trail hip.
Intrarater and interrater reliabilities for the ultrasonographic assessment of FTA have been analyzed previously by authors (S.T., M.Y.). 44 The intraclass correlation coefficient (ICC) and SEM for intrarater reliability were 0.994 (95% CI, 0.985-0.998) and 0.93°, respectively. The ICC and SEM for interrater reliability were 0.994 (95% CI, 0.984-0.997) and 0.94°, respectively. 44
Hip Rotational Motion Assessment
The HRM was assessed using a previously validated technique. 7,10,24,35,36 All assessments were performed by 2 physical therapists (M.S., H.F.). First, for HIR and HER in 0° of hip flexion (HIR-0 and HER-0, respectively), participants were placed in the prone position on a portable treatment table with 0° of hip flexion and 90° of knee flexion. The pelvis was stabilized by an examiner and the lower leg was passively rotated by the other examiner until maximal internal rotation and external rotation were achieved. The end range of rotational motion was defined as the point of first resistance without applying any overpressure. 24 The stationary arm of the goniometer was aligned perpendicularly to the floor using a bubble level, and the movable arm was aligned with the shaft of the tibia. Second, for HIR and HER in 90° of hip flexion (HIR-90 and HER-90, respectively), participants were placed in the supine position on a portable treatment table with 90° of hip flexion and 90° of knee flexion. After stabilizing the pelvis and rotating the lower leg in the same manner, the examiners aligned the stationary arm of the goniometer parallel to the long axis of the patient and aligned the movable arm with the shaft of the tibia. The total arc of rotational motion was calculated as the sum of HIR and HER at both 0° and 90° of hip flexion. The average of the 3 trials for each rotational motion direction was used for data analysis.
Intrarater and interrater reliabilities for the HRM assessment of 20 hips were analyzed by the same 2 physical therapists using SPSS Statistics Version 23.0 (IBM Corp). Each examiner was blinded to the results obtained by the other examiner. The ICC and SEM for the intrarater and interrater reliability analyses for all assessments were as follows: HIR-0: 0.973 and 1.2°, 0.963 and 1.4°; HER-0: 0.948 and 1.6°, 0.917 and 1.9°; HIR-90: 0.952 and 1.5°, 0.968 and 1.4°; HER-90: 0.922 and 1.7°, 0.929 and 1.5°, respectively.
Study Group Classification
Participants were classified into 2 groups, the pitcher group and the position player group.
Statistical Analysis
The Kolmogorov-Smirnov test was used to confirm normal distribution for all data. Intrarater reliability and precision for the FTA assessment of all participants were analyzed using ICC and SEM (SPSS Statistics Version 23.0; IBM Corp).
Data related to FTA and HRM were compared between the lead and trail hips and between the pitcher and position player groups using the paired t test or 1-way analysis of variance (ANOVA). When the statistical analysis was performed with the 1-way ANOVA, post hoc Tukey tests were used to test significance. To perform a statistical comparison of demographics and d-FTA of the pitcher and position player groups, data were analyzed using Mann-Whitney U tests, Fisher exact tests, or independent t tests to compare independent groups. Correlation coefficients between FTAs and HRM variables were determined by a linear regression analysis with Pearson correlation coefficients. These statistical analyses were performed using R Version 1.33 (Jichi Medical University), 18 with statistical significance set at P < .05. The post hoc power analysis was performed to evaluate power (1−β) using G*Power3 3.1.9.2 statistical analysis software (Heinrich Heine University, Duesseldorf), 12,13 with significance (α) set at .05.
Results
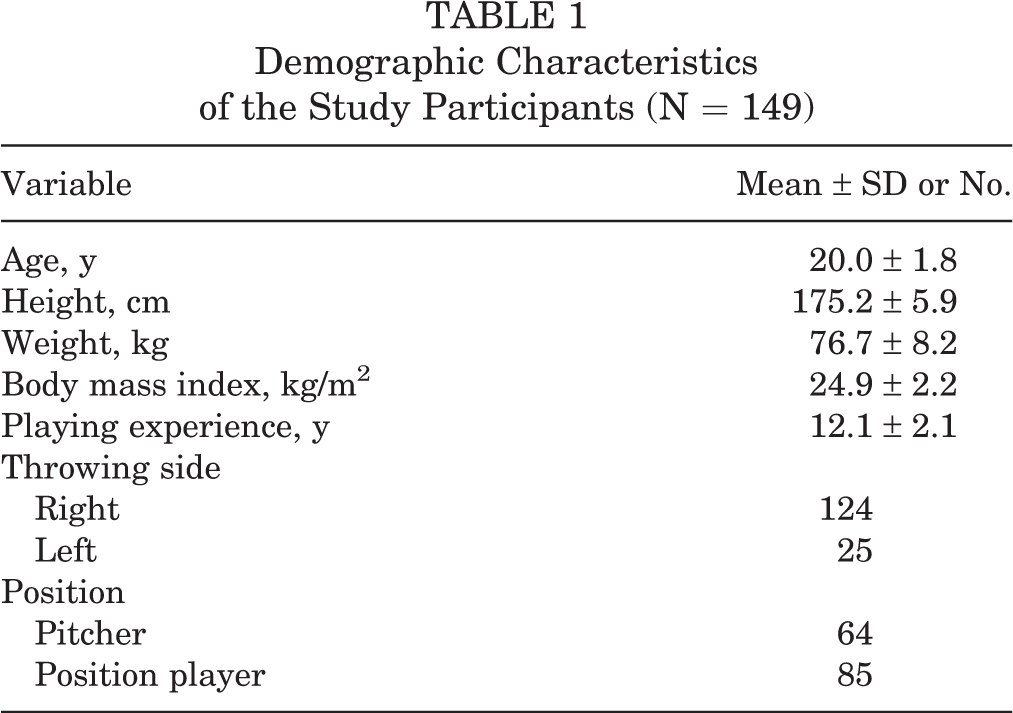
Of the 151 players enrolled, 149 players (age range, 18-31 years) were included in the present study. Two of the original players were excluded because of current hip pain. Table 1 shows the demographic data of all participants. The ICC and SEM for intrarater reliability were 0.991 (95% CI, 0.988-0.994) and 0.62°, respectively.
Demographic Characteristics of the Study Participants (N = 149)
Data from bilateral FTAs and HRM for all participants are shown in Table 2. No significant differences were found in the FTAs between the lead and trail hips for any player (lead hip, 20.5° ± 9.2°; trail hip, 19.6° ± 9.8°; P = .276). In terms of the HRM, significant differences were seen between the lead and trail hips at HIR-0, HER-0, HIR-90, and HER-90 (P < .001, P = .002, P = .001, and P < .001, respectively), whereas no significant differences were observed between the total arc of rotation variables at either 0° or 90° of flexion (P = .775 and P = .825, respectively).
Bilateral Femoral Torsion Angle and Hip Rotational Motion of All Participants a

a Data are shown as mean ± SD. Bolded P values indicate statistically significant between-group differences (P < .05). HER-0, hip external rotational motion at 0° of flexion; HER-90, hip external rotational motion at 90° of flexion; HIR-0, hip internal rotational motion at 0° of flexion; HIR-90, hip internal rotational motion at 90° of flexion; NA, not applicable.
There were 64 pitchers and 85 position players for the comparison based on baseball positions, with no significant differences in demographic data between the 2 groups (Table 3). In terms of HER-90 in both hips, 1-way ANOVA and post hoc pairwise comparisons revealed significant differences between HRM variables in both groups (lead hip: pitcher group, 33.0° ± 8.9°; position player group, 37.5° ± 9.8°; P = .024; trail hip: pitcher group, 35.6° ± 9.6°; position player group, 40.4° ± 10.2°; P = .035) (Table 4).
Comparison of Demographic Data Between the Lead and Trail Hips of the Pitcher and Position Player Groups a

a Data are shown as mean ± SD unless otherwise indicated.
Comparison of the Femoral Torsion Angle and Hip Rotational Motion Between the Lead and Trail Hips and Between the Pitcher and Position Player Groups a

a Data are shown as mean ± SD. Bolded P values indicate statistically significant between-group differences (P < .05). d-FTA, side-to-side difference in femoral torsion angles; HER-0, hip external rotational motion at 0° of flexion; HER-90, hip external rotational motion at 90° of flexion; HIR-0, hip internal rotational motion at 0° of flexion; HIR-90, hip internal rotational motion at 90° of flexion.
Linear regression analysis revealed weak but significant agreement between the FTA and HIR-0 (R = 0.298; 95% CI, 0.191 to 0.398; P < .001) and between the FTA and HIR-90 (R = 0.279; 95% CI, 0.171 to 0.381; P < .001), whereas there was no relationship between the FTA and HER-0 (R = –0.055; 95% CI, –0.168 to 0.059; P = .34), HER-90 (R = –0.166; 95% CI, –0.275 to –0.054; P = .004) or either of the total arcs of rotation (total arc of rotation in 0° of flexion: R = 0.152, 95% CI, 0.039 to 0.261, P = .009; total arc of rotation at 90° flexion: R = 0.035, 95% CI, –0.079 to 0.148, P = .543) (Figure 4).
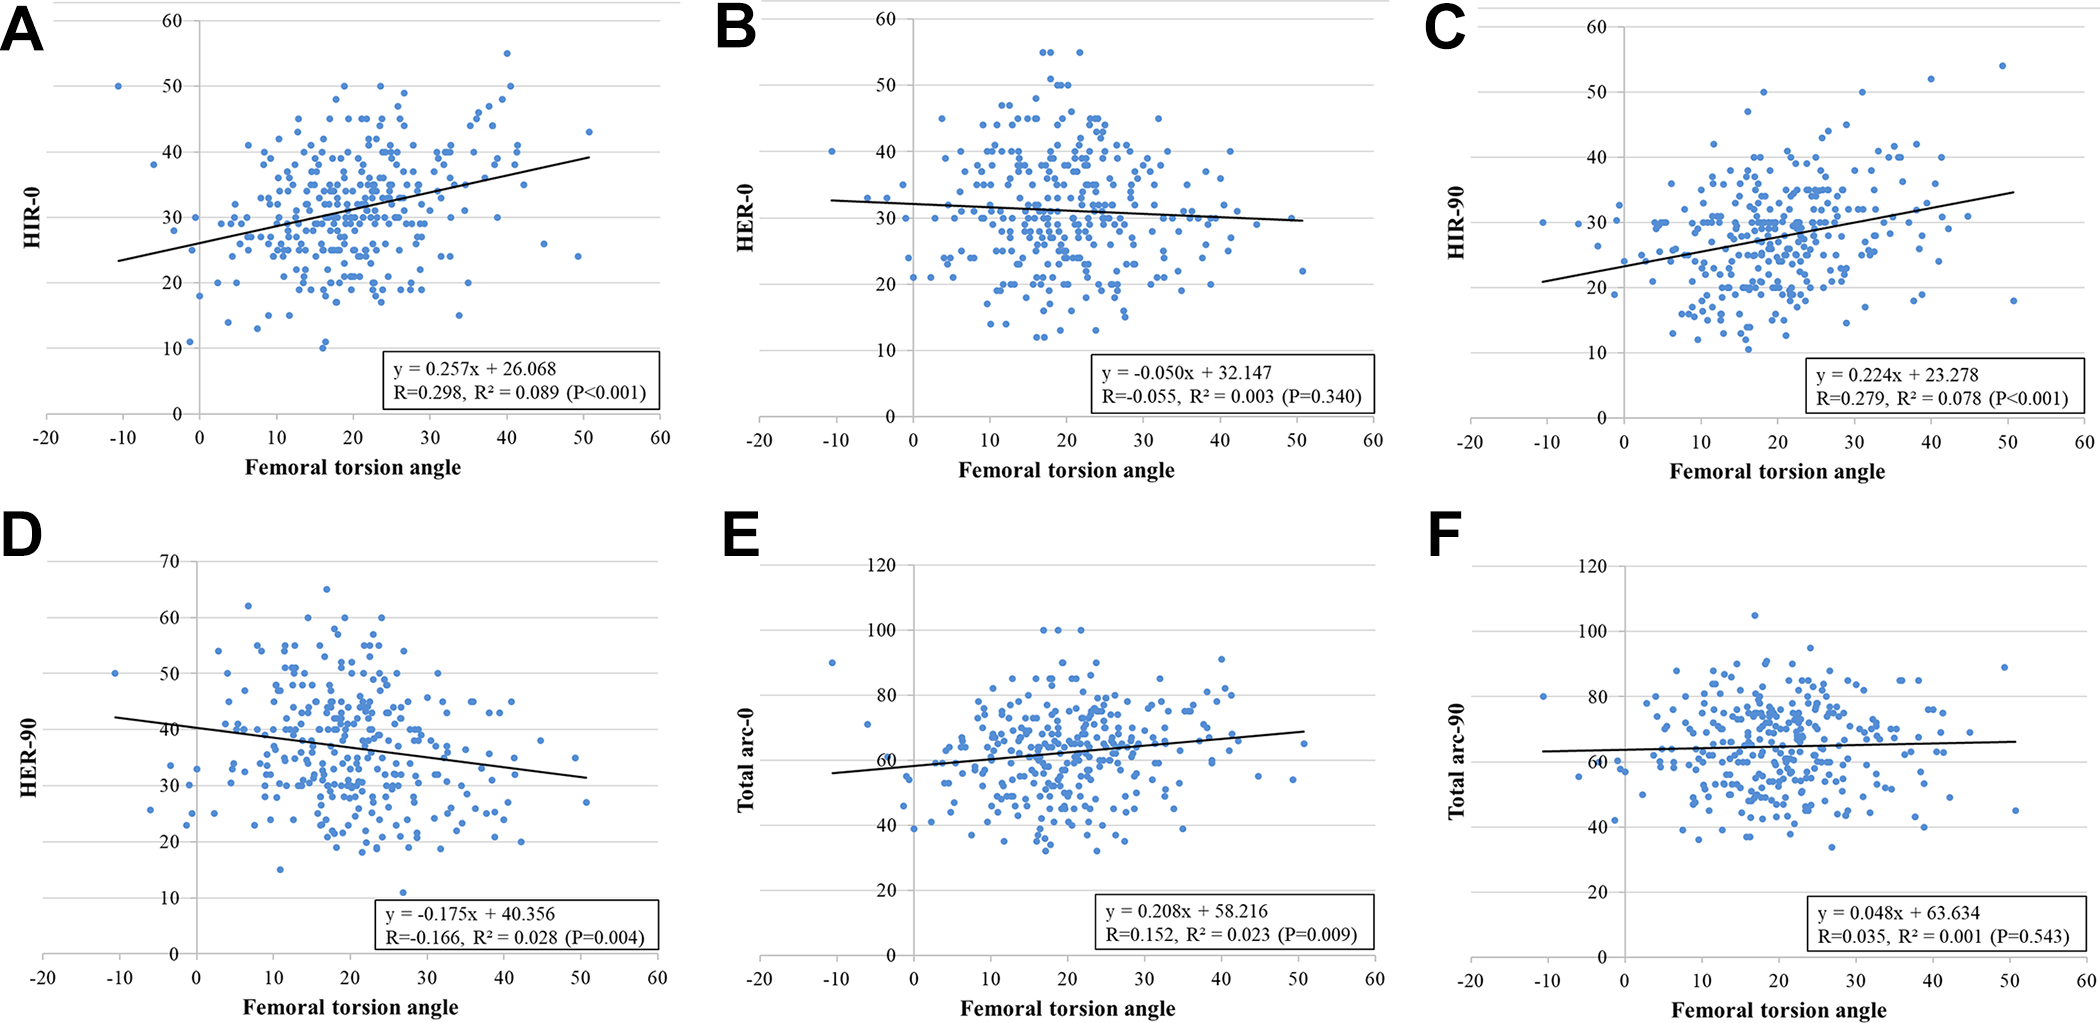
Relationship between the femoral torsion angle and hip rotational motion variables. The linear regression analysis revealed weak but significant agreements between the femoral torsion angle and HIR-0 and HIR-90, whereas there were no relationships between the femoral torsion angle and HER-0, HER-90, or either of the total arcs of rotation. (A) HIR-0 (R = 0.298; P < .001). (B) HER-0 (R = –0.055; P = .340). (C) HIR-90 (R = 0.279; P < .001). (D) HER-90 (R = –0.166; P = .004). (E) Total arc-0 (R = 0.152; P = .009). (F) Total arc-90 (R = 0.035; P = .543). HER-0, hip external rotational motion at 0° of flexion; HER-90, hip external rotational motion at 90° of flexion; HIR-0, hip internal rotational motion at 0° of flexion; HIR-90, hip internal rotational motion at 90° of flexion; total arc-0, total arc of rotation at 0° of flexion; total arc-90, total arc of rotation at 90° of flexion
Discussion
This is the first study to investigate the characteristics of FTA and the relationships between FTA and HRM in adult baseball players. The most important finding in this study was the absence of a significant difference in the FTAs between the lead and trail hips of the players. Moreover, no relationships were observed between the FTA and baseball positions. Abnormality of the HRM is not caused by differences in FTA but involves soft tissue tightness around the hip area or other bony morphologic factors in the hip joint.
Femoral versions of adult baseball players, which were measured by CT, have been reported as 21° ± 12° for the lead hip and 20° ± 12° for the trail hip. 10 Even though the number of participants was limited (n = 9) to prevent additional radiation exposure, that study was the first to report the characteristics of femoral morphologic characteristics in baseball players. 10 Recently, ultrasonographic FTA assessment has allowed for the accurate evaluation of the angle without radiation exposure. 44 In the present study, no significant difference in FTAs between the lead hip and trail hip was identified among players, despite asymmetric hip motions being required between the lead and trail hips during throwing. 10 The mean FTAs of the lead and trail hips were 20.5° and 19.6°, respectively, which are consistent with previous findings 10 and slightly higher compared with that of the general population (8°-16°). 17,21,22,37,47 Because the study participants began playing baseball before the age of 10 years, an age characterized by skeletal immaturity, the relatively high FTA might represent an adaptive change to achieve sufficient HIR, which is required more than HER by both hips during the throwing motion. 10
The relationship between FTA and HRM has been previously reported. 2,6 Botser et al 2 found a significant positive agreement (R = 0.36; P < .001) between the FTA assessed by CT and HIR-90, whereas HER-90 was not correlated with FTA. According to the results of the present study and consistent with previous findings, 3 a weak but significant agreement was identified between the FTA and HIR-90 (R = 0.279; P < .001). Moreover, we noted a significant relationship between the FTA and HIR-0 (R = .298; P <.001), whereas other HRMs did not show any specific relationships. Therefore, HIR was more closely associated with FTA than HER. When differences in the HIR are determined, differences in the FTAs should also be considered.
In general, symmetric HRMs have been observed for both hips and across positions during preseason medical checkups of adult baseball players. 4,10,39 However, previous studies have also revealed significant differences between HRM variables in pitchers and position players. 4,25,39 Laudner et al 25 and Sauers et al 39 reported that position players had significantly more HIRs than pitchers; however, Camp et al 4 reported the opposite results. Therefore, differences in HIRs across positions remain controversial. Furthermore, over the course of a baseball season, HIRs may vary between pitchers and position players for physiological reasons, such as fatigue and overuse. 4,50 For a better understanding of these differences, an assessment of FTAs between pitchers and position players could be helpful. Regarding the comparison of HRMs between hips for all player positions, the present study revealed significant differences in HIR-0, HER-0, HIR-90, and HER-90 for all players; however, the effect sizes for all comparisons were small (range, 0.248-0.323). Therefore, these differences might not be clinically meaningful. In comparing pitchers and position players, the present study revealed that position players had significantly more HER-90 in both hips than pitchers, whereas there were no significant differences in FTA. Thus, differences in the HER-90 between pitchers and position players may be caused not by differences in FTAs, but by differences in soft tissue flexibility or tightness around the hip.
The present study had several limitations. First, the bony landmarks of the femoral neck during the ultrasonographic assessment differed from those used during the CT assessment, considered the gold standard for FTA evaluation. Therefore, each FTA assessed with ultrasonography could not be evaluated using the same parameters as those used for CT. However, the ultrasonographic assessment method has been validated, and a very strong correlation coefficient between the FTAs obtained using ultrasonography and CT has been reported (R = 0.939; P < .001). 44 Therefore, an ultrasonographic assessment may be an alternative to CT for FTA evaluations, although standard limitations of the ultrasonography, such as repeatability and applicability, should be recognized. Second, other bony morphologic factors that might influence HRM (acetabular version, alpha angle, and others) could not be addressed because CT was the only way to evaluate them. No significant differences in those factors were identified previously between hips because the number of participants was small 10 ; therefore, their contribution might be relatively small compared with the tissue tightness around the hip area in terms of HRM abnormalities in adult baseball players. Third, the present study was a cross-sectional study; thus, we could not investigate the incidence rates of shoulder and elbow injuries. Further prospective studies should be conducted to investigate relationships relative to injury risk based on the differences in HRMs and FTA.
Conclusion
The femoral torsion angle did not differ between the lead and trail hips or across player positions on the field in elite baseball players. Abnormalities of the hip rotational motion are not caused by differences in femoral torsion angle but rather involve soft tissue tightness around the hip area or other bony morphologic factors in the hip joint.
Footnotes
Acknowledgment
The authors thank the staff of the Department of Orthopaedic Surgery at Nagoya City University Graduate School of Medical Science, Nagoya Sports Clinic, and Meitetsu Hospital for their assistance with medical check-ups.
Final revision submitted April 30, 2020; accepted June 8, 2020.
The authors declared that there are no conflicts of interest in the authorship and publication of this contribution. AOSSM checks author disclosures against the Open Payments Database (OPD). AOSSM has not conducted an independent investigation on the OPD and disclaims any liability or responsibility relating thereto.
Ethical approval for this study was obtained from Nagoya City University (ref No. 60-17-0083).