
Abstract
Keywords
Introduction
Hyperuricemia is a metabolic disorder characterized by elevated serum uric acid levels resulting from increased production or impaired renal excretion of uric acid, the end product of purine metabolism.1,2 It has been associated with an increased risk of cardiovascular diseases (CVDs), which remain a major cause of illness and death among people living with human immunodeficiency virus (PLHIV). 3 Elevated uric acid contributes to the development of metabolic syndrome and endothelial dysfunction, both of which are established risk factors for atherosclerotic cardiovascular disease (ASCVD) in the general population and among PLHIV. 4
Among PLHIV, the burden of hyperuricemia is of particular concern. Both HIV infection itself and long-term exposure to antiretroviral therapy (ART) contribute to altered uric acid metabolism.5,6 HIV-related factors, including accelerated cell turnover, chronic immune activation, and persistent systemic inflammation, can increase uric acid production and disrupt renal handling, thereby increasing the risk of hyperuricemia.7,8 Furthermore, ART-related toxicities play a central role. Older nucleoside reverse transcriptase inhibitors (eg, stavudine) and tenofovir disoproxil fumarate, are known to impair renal uric acid excretion due to mitochondrial toxicity and proximal tubular dysfunction. 9 In addition, metabolic complications associated with ART, such as lipodystrophy, insulin resistance, and weight gain, further predispose PLHIV to hyperuricemia. 10 Recent studies have also reported that dolutegravir (DTG)-based regimens are associated with significant hyperglycemia and weight gain compared to non-nucleoside reverse transcriptase inhibitors, potentially elevating the risk of hyperuricemia.5,11,12
Several factors have been associated with the prevalence of hyperuricemia among PLHIV on ART. These include non-modifiable factors such as older age and male sex, as well as modifiable lifestyle factors such as overweight or obesity, physical inactivity, high-purine diets, and alcohol consumption.6,12–14 In addition, comorbid conditions like type 2 diabetes mellitus, hypertension, or both, along with HIV-related factors including the specific ART regimen, longer duration of HIV infection, and prolonged ART exposure, have been linked to an elevated risk of hyperuricemia.5,14 Early identification and management of these risk factors are essential to improving metabolic health outcomes in PLHIV receiving ART.
The prevalence of hyperuricemia among PLHIV varies widely across regions and populations but is generally higher than in the general population. Although specific figures differ between studies, a considerable proportion of PLHIV are affected.15,16 For instance, a study conducted in the United States reported a hyperuricemia prevalence of 18.9% among ART-naive PLHIV, 14 while research from Italy found that 25.2% of those on ART had elevated serum uric acid levels. 17 In sub-Saharan Africa, prevalence rates range from 13% in Zimbabwe 18 to 21.3% in Uganda. 6 Notably, a cross-sectional study from Southwest Ethiopia reported a significantly higher prevalence of 46.5%, 5 highlighting substantial regional disparities and the urgent need for more comprehensive investigations into this emerging metabolic complication.
Despite this, there is limited evidence documenting the prevalence of hyperuricemia and its associated factors among PLHIV receiving ART in Ethiopia, particularly in the study area. Understanding the prevalence and contributing factors of hyperuricemia is essential for predicting cardiovascular risk in PLHIV, enabling timely screening and preventive interventions. Therefore, the general objective of this study was to assess the magnitude of hyperuricemia and its associated factors among PLHIV who enrolled in first-line ART in the Amhara Region, Ethiopia. The specific objectives were (1) to determine the magnitude of hyperuricemia among PLHIV who enrolled in first-line ART in the Amhara Region, Ethiopia and (2) to identify factors associated with hyperuricemia PLHIV who enrolled in first-line ART in the Amhara Region, Ethiopia.
Method and Materials
Study Area and Period
This study was conducted between March 15 and June 15, 2024, in three randomly selected referral hospitals in the Amhara region. Among the eight referral hospitals providing follow-up care for PLHIV, Debre Markos, Dessie, and Debre Tabor Referral Hospitals were selected as the study sites. Debre Markos Referral Hospital, located in Debre Markos town, provides ART follow-up services for more than 3600 PLHIV. Dessie Referral Hospital, situated in Dessie town, offers comprehensive ART care to more than 6400 PLHIV. Debre Tabor Referral Hospital, located in Debre Tabor town, provides ART follow-up services for a total of 3050 PLHIV.
Study Design
A multi-center, institution-based cross-sectional study was conducted.
Population
The source population consisted of all adults living with HIV who were receiving first-line ART at referral hospitals in the Amhara region, Ethiopia. The study population included all eligible patients who were on first-line ART during the data collection period at the three selected referral hospitals. The study unit was each individual adult patient meeting the inclusion criteria.
Eligibility Criteria
Inclusion Criteria
Adults (≥18 years old) living with HIV who had been on first-line ART for at least 12 months. 12 Participants receiving either DTG-based or efavirenz (EFV)-based ART regimens were included in the study.
Exclusion Criteria
Pregnant women, individual with known kidney diseases or history of organ transplantation, participants currently taking medications known to alter serum uric acid levels, patients with severe mental or neurological disorders that precluded informed participation, as confirmed from medical records.
Sample Size Determination
The sample size was determined using a single population proportion formula, based on a reported hyperuricemia prevalence of 46.5% among PLHIV on DTG-based ART at the ART clinic of Jimma University Medical Center
5
with the assumption of 95% confidence interval (CI) and 5% margin of error (d = 0.05). Then, the minimum sample size was determined by using:

Then,

Sampling Technique
In this study, three referral hospitals were randomly selected using a simple random sample procedure (lottery method). A systematic random sampling technique was then employed to recruit participants from each hospital. Every seventh participant was included (K = N/n = 2662/401 ≈ 7), where N represents the total number of PLHIV enrolled in first-line ART during the same period as this study at the selected hospitals, and n denotes the sample size. A random starting point (number 3) was chosen, and to ensure representativeness, a proportional number of participants were selected from each hospital (Figure 1).

Flowchart depicting the selection of study participants among PLHIV who enrolled in first-line antiretroviral therapy in the Amhara Region, Ethiopia, 2024. PLHIV, people living with human immunodeficiency virus.
Study Variables
Dependent Variable
Hyperuricemia (Yes/No)
Independent Variable
Socio-demographic factors: age, sex, residence, education level, marital status, and monthly income.
Behavioral factors: alcohol consumption, smoking, khat chewing, and physical activity.
Clinical factors: duration of HIV/ acquired immunodeficiency syndrome (AIDS) infection, duration of ART, World Health Organization (WHO) clinical staging, CD4+ T-cell count, viral load, history of opportunistic infections, type of ART regimen, drug adherence, and family history of hypertension, kidney disease, or CVD.
Physical measurements: body mass index (BMI), waist circumference (WC), waist to hip ratio (WHR), systolic blood pressure (SBP), diastolic blood pressure (DBP).
Biochemical measurements: Fasting blood glucose (FBG), total cholesterol (TC), triglyceride (TG), high-density lipoprotein cholesterol (HDL-C), low-density lipoprotein cholesterol (LDL-C).
Operational Definition
Hyperuricemia was defined as a serum uric acid level is >6 mg/dL for females and >7 mg/dL for males. 12
Dyslipidemia was defined as having a TC ⩾200 mg/dL, TG ⩾150 mg/dL, LDL-C ⩾130 m/dL, and HDL-C (<40 mg/dL for men and <50 mg/dL for women), either in isolation or in combination. 19
FBG was considered elevated (hyperglycemia) at level ⩾110 mg/dL. 20
BMI was categorized as follows: underweight (BMI < 18.5 kg/m²), normal weight (18.5-24.9 kg/m²), overweight (25-29.9 kg/m²), and obese (BMI ≥ 30 kg/m²). 21
Elevated WC was defined as >80 cm in females and >94 cm in males. 22
Elevated WHR was defined as ≥0.85 in females and ≥0.90 in males. 22
Hypertension was defined as SBP/DBP ≥140/90 mm Hg, current use of antihypertensive medication or a medically confirmed self-reported history of hypertension.23,24
Alcohol drinking status was defined as “alcohol drinker” for participants who consumed any type of alcoholic beverage more than once per week over the past year, regardless of the amount.25,26
Smoking status was defined as “smoker” for individuals who had smoked at least one cigarette within the past year. 27
Khat chewing status was defined as “chewer” for participants who consumed any amount of khat in the last one year; otherwise, they were classified as “non-chewer”. 28
Low fruit and vegetable intake was defined as the consumption of fruits and vegetables on less than 4 days in a given week, reflecting a level below the recommended threshold. 29
Physical activity was assessed using the WHO Stepwise approach and categorized into three levels: vigorous, moderate, and low (inadequate) physical activity. Vigorous-intensity activity was defined as any activity that causes a significant increase in breathing or heart rate (eg, running, carrying or lifting heavy loads, digging, or construction work) sustained for at least 30 min on a minimum of 3 days per week. Moderate-intensity activity referred to activities causing a moderate increase in breathing or heart rate (eg, brisk walking or carrying light loads), performed for at least 30 min on at least 3 days per week, or for at least 20 min per day on 5 or more days per week, or engaging in vigorous-intensity activity for at least 20 min per day on 3 or more days per week. Low-level (sedentary) physical activity was defined as physical activity that did not meet any of the above criteria. 30
Data Collection Instruments
The data collection questionnaire was adapted from the WHO's standardized stepwise questionnaire. 31 It was originally prepared in English and then translated into Amharic. The questionnaire covered the following sections: socio-demographic factors, behavioral factors, clinical factors, physical measurements, and biochemical measurement.
Data Collection Procedures
Socio-demographic, behavioral factors, and family history medical illness (such as family history of hypertension, kidney disease and CVD) were collected through patient interviews. In addition, clinical data were extracted from patients’ medical records using a standardized checklist. Anthropometric measurements (including height, weight, WC, and hip circumference (HC)) and blood pressure were also collected. Body weight and height of each participant were measured using a digital scale equipped with a built-in height gauge, recorded in kilograms and centimeters, respectively. Subsequently, BMI was calculated by dividing weight in kilograms by height in meters squared (kg/m²). WC and HC were measured with a non-elastic tape, and the WHR was calculated by dividing WC by HC. Blood pressure was measured on the left arm, supported on a flat surface, using an appropriately sized mercury sphygmomanometer cuff with the participant seated. Participants rested for at least 5 min before measurement, or 30 min if they had consumed caffeinated drinks. Two measurements were taken 5 min apart, and the average was recorded. Furthermore, a 5 mL blood sample was aseptically collected from each participant after overnight fasting using a serum separator tube, following sterile technique. To separate the serum, blood samples were allowed to clot at room temperature for 30 min and then centrifuged at 3000 rpm for 7 min in a thermostable Rotanta 960 centrifuge. Finally, biochemical parameters including serum uric acid, FBG, and lipid profile were analyzed using an automated COBAS 6000 analyzer.
Data Quality Control and Management
The questionnaires were originally prepared in English, translated into Amharic to facilitate data collection, and then back-translated into English to ensure consistency. A pretest was conducted at Bichena Primary Hospital on 5% (20) of the sample size before the start of the actual data collection. The principal investigator provided 2 days of essential training at each hospital for data collectors on the data collection procedures and the questionnaire. All data were collected by trained nurse professionals and laboratory technologists under the close supervision of the principal investigator. The collected data were reviewed for completeness, clarity, and consistency prior to analysis. The overall quality of laboratory analysis was ensured by strictly adhering to the manufacturers’ instructions and standard operating procedures) throughout the pre-analytic, analytic, and post-analytic stages.
Statistical Analysis
The collected data were cleaned, coded, and entered into EpiData version 4.6 (EpiData Association, Odense, Denmark), then exported to Statistical Package for the Social Sciences version 26 (IBM Corp., Armonk, NY, USA) for analysis. Descriptive statistics were employed to summarize the characteristics of study participants across relevant variables. Binary and multivariable logistic regression analyses were performed to identify factors associated with hyperuricemia. Variables with a P-value below .25 in the binary analysis were entered into the multivariable logistic regression model. Statistical significance was determined at a P-value < .05. Before conducting the multivariable analysis, multicollinearity among factors was evaluated using the variance inflation factor (VIF). The VIF values ranged from 1.038 to 2.172, suggesting acceptable independence among predictors and indicating that multicollinearity was not a concern. Crude and adjusted odds ratios with 95% CI were presented, with statistical significance defined as a P-value less than .05. Model fit was assessed using the Hosmer-Lemeshow test, with a P-value greater than .05 indicating an adequate fit. In the present study, the Hosmer-Lemeshow test yielded χ² = 7.92, P = .441, confirming that the final model adequately fit the data.
The Strengthening the Reporting of Observational Studies in Epidemiology Statement
The reporting of this study conforms to the Strengthening the Reporting of Observational Studies in Epidemiology (STROBE) statement. 32 A STROBE checklist is included as Supplemental Material A.
Results
Socio-demographic Characteristics of the Study Participants
This study included 397 participants, achieving a 99% response rate. The mean age was 43 ± 8.3 years, with the majority (42.3%) falling within the 31-40 age group; 57.4% were female, 50.6% lived in urban areas, and 37.8% could not read and write. Most participants were farmers (35%) and married (64%) (Table 1).
Socio-Demographic Characteristics of PLHIV Who Enrolled in First-Line Antiretroviral Therapy in the Amhara Region, Ethiopia, 2024.

Note: 1 ETB = 0.0176 USD during the study. PLHIV, people living with human immunodeficiency virus.
Behavioral Characteristics of the Study Participants
Among the participants, 10.3% had a history of smoking, 17.6% were current alcohol consumers, 54.4% engaged in moderately intense physical activity, and 52.9% reported low intake of fruits and vegetables (Table 2).
Behavioral Characteristics of PLHIV Who Enrolled in First-Line Antiretroviral Therapy in the Amhara Region, Ethiopia, 2024.

PLHIV, people living with human immunodeficiency virus.
Clinical Characteristics of the Study Participants
The mean duration since HIV diagnosis was 7.3 ± 3.4 years, and they had been on ART for a mean duration of 6.5 ± 3.1 years. The majority (74.6%) were classified as HIV clinical stage I, and 12.8% had a history of opportunistic infections. Overall, 91.9% were on DTG-based ART regimen, 8.3% had a non-suppressed viral load, 39.8% had cluster of differentiation 4 (CD4) + T-cell counts below 500 cells/mm³, and 8.1% reported a family history of kidney disease (Table 3).
Clinical Characteristics of PLHIV Who Enrolled in First-Line Antiretroviral Therapy in the Amhara Region, Ethiopia, 2024.

PLHIV, people living with human immunodeficiency virus; ART, antiretroviral therapy; CVD, cardiovascular disease; DTG, dolutegravir; CD4, cluster of differentiation 4; EFV, efavirenz.
Anthropometric and Biochemical Characteristics of the Study Participants
Among the study participants, 45.6% had a normal BMI, 21.9% had increased WC, and 40.6% had an elevated WHR. Elevated SBP and DBP were found in 7.6% and 9.1% participants, respectively. Regarding biochemical parameters, abnormal levels were observed in FBG (11.8%), TC (31.2%), LDL-C (39.3%), and TG (21.9%), while 41.1% had low serum HDL-C levels (Table 4).
Prevalence of Hyperuricemia among the Study Participants
Among 397 study participants 112 were found to have hyperuricemia, resulting in an overall prevalence of 28.2% (95% CI: 23.7-32.5%), as illustrated in Figure 2. Although the prevalence was higher in males (30.2%, n = 51) than in females (26.8%, n = 61), the difference was statistically insignificant (P = .454). Similarly, the prevalence was higher among PLHIV on DTG-based ART (29.3%, n = 107) compared to those on EFV-based ART (15.6%, n = 5), though this difference was also statistically insignificant (P = .099).
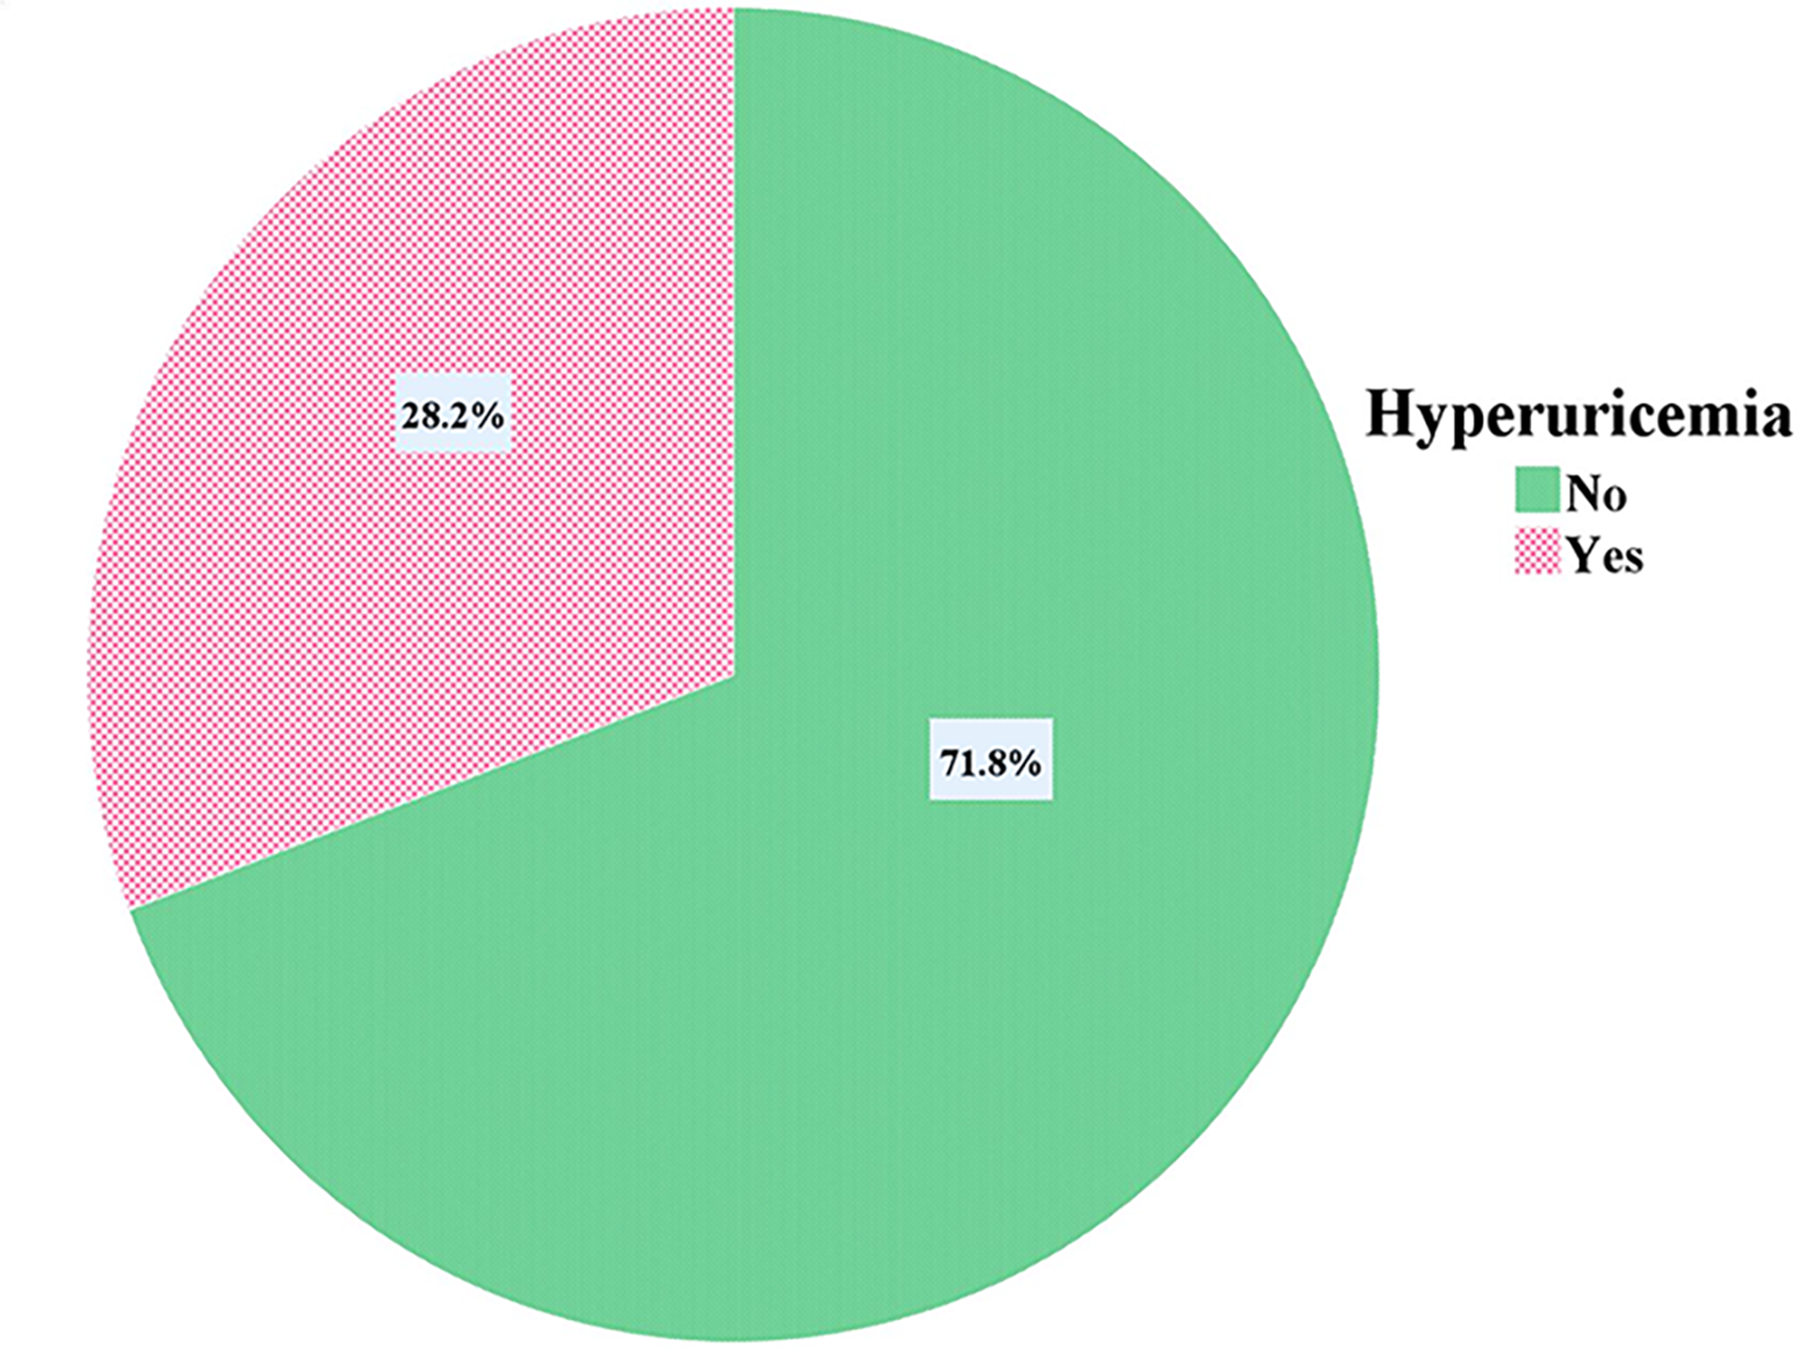
Prevalence of hyperuricemia among PLHIV who enrolled in first-line antiretroviral therapy in the Amhara Region, Ethiopia, 2024. PLHIV, people living with human immunodeficiency virus
Factors Associated with Hyperuricemia among the Study Participants
The bivariate logistic regression analysis revealed that sex, age, smoking status, alcohol consumption, duration on HIV/AIDS, duration on ART, BMI, DBP, FBG, TG, LDL-C, WC, type of ART regimen, and fruit and vegetable intake were significantly associated with hyperuricemia among PLHIV on ART. As presented in Table 5, all variables listed had a P-value of less than .25 in the bivariate analysis and were therefore included in the multivariate logistic regression analysis. Controlling for the effect of confounders sex, age, BMI, and duration on ART were found to be significantly associated with hyperuricemia among PLHIV on ART. Accordingly, male study participants were 1.79 times more likely to have hyperuricemia as compared to female study participants (AOR = 1.79, 95% CI: 1.07, 2.98). In addition, age was significantly associated with hyperuricemia among PLHIV on ART. For each 1-year increase in age, the odds of developing hyperuricemia increased by 3% (AOR = 1.03; 95% CI: 1-1.06). Furthermore, participants with obesity had 2.21 times higher odds of developing hyperuricemia compared to those with a normal BMI (AOR = 2.21; 95% CI: 1.04-4.73). Moreover, duration on ART was significantly associated with hyperuricemia among PLHIV. For each additional duration on ART, the likelihood of developing hyperuricemia increased by 13% (AOR = 1.13; 95% CI: 1.01-1.27).
Anthropometric and Biochemical Characterstics of PLHIV Who Enrolled in First-Line Antiretroviral Therapy in the Amhara Region, Ethiopia, 2024.

PLHIV, people living with human immunodeficiency virus; BMI, body mass index; WC, waist circumference; WHR, waist to hip ratio; SBP, systolic blood pressure; DBP, diastolic blood pressure; FBG, fasting blood glucose; TC, total cholesterol, TG, triglyceride; HDL-C, high-density lipoprotein cholesterol; LDL-C, low-density lipoprotein cholesterol.
Factors Associated with Hyperuricemia among PLHIV Who Enrolled in First-Line Antiretroviral Therapy in the Amhara Region, Ethiopia, 2024.

Note: * = statistically significant at P < .05. PLHIV, people living with human immunodeficiency virus; ART, antiretroviral therapy; DTG, dolutegravir; CI, confidence interval; BMI, body mass index; WC, waist circumference; DBP, diastolic blood pressure; FBG, fasting blood glucose; TG, triglyceride; LDL-C, low-density lipoprotein cholesterol; AIDS, acquired immunodeficiency syndrome; EFV, efavirenz.
Discussion
This study aimed to assess the prevalence of hyperuricemia and its associated factors among PLHIV receiving ART. The prevalence of hyperuricemia was found to be 28.2% (95% CI: 23.7-32.5%). In addition, sex, age, BMI, and duration on ART were identified as significant factors associated with hyperuricemia in this population.
The prevalence of hyperuricemia in our study was comparable to that reported in a cross-sectional study conducted in Italy (25.2%). 17 However, it was lower than the prevalence found in a previous study conducted in Southwest Ethiopia (46.5%). 5 Conversely, the prevalence in this study was higher than that reported in studies from the Central Region of Uganda (21.3%), 6 South-Western Uganda (23.48%), 12 Zimbabwe (13%), 18 and USA (18.4%). 14 These discrepancies may be attributed to differences in the cut-off values used to define hyperuricemia. For instance, the study conducted in Ethiopia 5 employed lower cut-off values to define hyperuricemia (4.9 mg/dL for women and 6.3 mg/dL for men), which may partly explain the higher prevalence reported. In addition, this inconsistency in findings could be due to differences in socio-demographic and clinical characteristics, lifestyle factors, and study methodologies (including differences in study populations, inclusion criteria, and sample sizes). For example, cross-sectional studies from Southwest Ethiopia, 5 USA, 14 and Zimbabwe 18 had smaller sample sizes than the current study. Additionally, the study from Zimbabwe 18 excluded alcohol drinkers, whereas our study included them. Such factors may account for the discrepancy in findings.
After comparing prevalence with other studies, we also examined potential risk factors associated with hyperuricemia. In this study, sex, age, BMI, and duration on ART were significantly associated with hyperuricemia. Specifically, male participants were 1.79 times more likely to develop hyperuricemia compared to their female counterparts. This finding aligns with results from a study conducted in South-Western Uganda. 12 The increased risk of hyperuricemia among males may be explained by hormonal differences, particularly the role of estrogen in females. Estrogen is thought to enhance uric acid excretion, thereby contributing to lower serum uric acid levels in women.33,34 In addition, men may have greater exposure to environmental and dietary influences that stimulate purine synthesis, potentially resulting in elevated uric acid production. This could be linked to sex-related differences in purine metabolism regulation, which may lead to increased uric acid accumulation in the bloodstream.35,36 Furthermore, males may have a higher tendency to consume alcohol than females, and alcohol intake can trigger the expression of ATP-binding cassette transporter subfamily G member 2 (ABCG2). This activation of ABCG2 promotes the reabsorption of urate in the renal tubules, which subsequently raises serum uric acid levels.37,38
In addition, the findings of this study offer strong evidence of a significant association between age and the prevalence of hyperuricemia among PLHIV on ART. Although no prior studies have specifically demonstrated this association within PLHIV, it has been consistently observed in the general population39,40 and other study groups. 41 This association may be explained by the fact that advancing age is a well-established risk factor for hyperuricemia, primarily due to the progressive decline in renal function that reduces the kidneys’ ability to excrete uric acid efficiently. After the age of 40, kidney efficiency typically decreases by approximately 10% per decade, resulting in increased uric acid accumulation in the bloodstream. 42 In addition, aging is accompanied by increased levels of inflammation and oxidative stress, which may further contribute to the development and severity of hyperuricemia in older individuals.43,44
Furthermore, duration on ART was significantly associated with hyperuricemia among PLHIV. This finding is consistent with studies conducted in Ethiopia, 5 Nigeria, 45 and China. 46 A possible explanation for this association may be ART-induced mitochondrial toxicity, which can elevate lactate levels that in turn compete with uric acid for excretion by the renal tubules. In addition, increased cellular turnover and subsequent nucleotide degradation may also contribute to elevated serum uric acid levels in PLHIV on ART.47–49
Moreover, the current study showed an association between obesity and hyperuricemia among PLHIV on ART. This finding aligns with studies conducted in Uganda, 12 Zimbabwe 18 and Nigeria. 50 Although the exact mechanism by which obesity contributes to elevated uric acid levels is not yet fully understood, two primary factors are thought to play a role: increased production and impaired renal excretion of uric acid. A study conducted in a Japanese population with visceral fat obesity reported that elevated uric acid levels were significantly influenced by both excessive synthesis and reduced urinary excretion of urates. 51 Furthermore, the accumulation of visceral fat may promote the flow of free fatty acids from the plasma into the liver and hepatic portal vein, which in turn may stimulate TG synthesis and potentially enhance uric acid production through activation of the purine degradation pathway.52,53
Strengths and Limitations of the Study
The strength of this study was assessing the prevalence and associated factors of hyperuricemia among PLHIV on first-line ART in multi-center settings, which makes it relatively more representative. Despite this strength, several limitations should be noted. As a cross-sectional study, it cannot establish causal relationships. Information on alcohol consumption, khat chewing, and smoking was self-reported by participants, which may have introduced recall bias. Furthermore, dietary patterns were not assessed in detail, which are believed to be one of the factors associated with hyperuricemia. Moreover, data on kidney function among the study participants could not be assessed. Finally, as the study was conducted in hospital-based settings, the findings may not be fully generalizable to the broader community.
Conclusion
Overall, our study revealed that hyperuricemia (28.2%) was relatively common among PLHIV receiving first-line ART. A significant association was observed between hyperuricemia and several factors, including sex, age, BMI, and duration on ART. These findings underscore the importance of routine screening for hyperuricemia and the implementation of targeted lifestyle interventions among PLHIV on ART, particularly males, older individuals, those with prolonged ART exposure, and those with obesity. Furthermore, we recommend that future research include longitudinal studies to better establish causal relationships.
Supplemental Material
sj-docx-1-jia-10.1177_23259582251400988 - Supplemental material for Magnitude of Hyperuricemia and Its Associated Factors Among People Living with Human Immunodeficiency Virus Who Enrolled in First-Line Antiretroviral Therapy in Amhara Region, Ethiopia
Supplemental material, sj-docx-1-jia-10.1177_23259582251400988 for Magnitude of Hyperuricemia and Its Associated Factors Among People Living with Human Immunodeficiency Virus Who Enrolled in First-Line Antiretroviral Therapy in Amhara Region, Ethiopia by Mohammed Jemal, Desalegn Abebaw, Tabarak Malik, Muluken Getinet Mekuriaw, Dagmawi Abiy Abate, Temechew Munaw Abebe, Tilahun Bitew, Enatnesh Essa Osman and Adane Adugna in Journal of the International Association of Providers of AIDS Care (JIAPAC)
Supplemental Material
sj-docx-2-jia-10.1177_23259582251400988 - Supplemental material for Magnitude of Hyperuricemia and Its Associated Factors Among People Living with Human Immunodeficiency Virus Who Enrolled in First-Line Antiretroviral Therapy in Amhara Region, Ethiopia
Supplemental material, sj-docx-2-jia-10.1177_23259582251400988 for Magnitude of Hyperuricemia and Its Associated Factors Among People Living with Human Immunodeficiency Virus Who Enrolled in First-Line Antiretroviral Therapy in Amhara Region, Ethiopia by Mohammed Jemal, Desalegn Abebaw, Tabarak Malik, Muluken Getinet Mekuriaw, Dagmawi Abiy Abate, Temechew Munaw Abebe, Tilahun Bitew, Enatnesh Essa Osman and Adane Adugna in Journal of the International Association of Providers of AIDS Care (JIAPAC)
Footnotes
Acknowledgements
We would like to acknowledge the study participants, data collectors, and supervisors for their willingness, valuable support, and assistance during this work.
Ethics Approval and Consent to Participate
Ethical approval for the study was obtained from the Ethical Review Committee of the School of Medicine, Debre Markos University (Ref. No. 22/02/2024), and a permission letter was secured from the Amhara Public Health Institute (Ref. No. 1061/02/2024). The study was conducted in compliance with local regulations and institutional ethical standards. Prior to participation, the purpose of the study was clearly explained to all eligible participants. Written informed consent was obtained from each participant, and strict confidentiality of their information was maintained throughout the study.
Consent for Publication
Not applicable.
Authors’ Contribution
MJ contributed to conceptualization, manuscript draft, design, manuscript writing-up, manuscript editing, and validation. DA contributed to conceptualization, writing—original draft, writing—review and editing. TM contributed to writing—original draft, writing—review and editing, and validation. MGM contributed to writing—original draft, writing—review and language editing. DAA contributed to writing—original draft, writing—review and language editing. TMA contributed to visualization, supervision, writing—original draft, and writing—review and editing. TB contributed to writing—original draft, writing—review and editing, and validation. EEO contributed to writing—original draft, writing—review and language editing. AA contributed to conceptualization, visualization, supervision, writing—original draft, and writing—review and editing.
Funding
The authors received no financial support for the research, authorship, and/or publication of this article.
Declaration of Conflicting Interests
The authors declared no potential conflicts of interest with respect to the research, authorship, and/or publication of this article.
Availability of Data and Material
The data that support the findings of this study are available from the corresponding author upon reasonable request.
Supplemental Material
Supplemental material for this article is available online.
References
Supplementary Material
Please find the following supplemental material available below.
For Open Access articles published under a Creative Commons License, all supplemental material carries the same license as the article it is associated with.
For non-Open Access articles published, all supplemental material carries a non-exclusive license, and permission requests for re-use of supplemental material or any part of supplemental material shall be sent directly to the copyright owner as specified in the copyright notice associated with the article.