
Abstract
Aim:
To investigate the surface roughness, surface hardness, and solubility of bulk-fill composites after exposure to food-simulating liquids (FSLs).
Materials and Methods:
A total of 200 disc-shaped samples (8 mm diameter × 4 mm depth) were prepared using four bulk-fill composites (SonicFillTM, Tetric® EvoCeram Bulk Fill, Beautifil-Bulk Restorative, FiltekTM Bulk Fill Posterior Restorative) and a microhybrid composite (FiltekTM Z250) (n = 40). Following the measurement of initial weights of the samples (m1), the surface roughness measurements were gauged using a contact-profilometer. The samples were stored in four different FSLs for 7 days, and then the second surface roughness values were recorded. The samples were stored in a desiccator to reach the constant mass and the values were recorded as m2, then the solubility levels were calculated. The Vickers microhardness values of the samples were determined. A total of 20 specimens were evaluated in terms of surface morphology with a scanning electron microscope (SEM). Data were statistically analyzed with the two-way ANOVA and Bonferroni tests (P < .05).
Results:
Beautifil-Bulk Restorative was affected at most in terms of surface roughness after storage in FSLs and citric acid caused the highest values in this group (P < .005). Beautifil-Bulk Restorative and Filtek Z250 showed the highest surface hardness values, while the Tetric EvoCeram group had the lowest. The highest solubility values were found in Beautifil-Bulk Restorative, and citric acid and ethanol yielded the highest solubility values for all of the composites.
Conclusion:
Beautifil-Bulk Restorative is the most affected group in all parameters evaluated and also affected overly by citric acid among the FSLs in consequence of its prereacted glass ionomer fillers.
Abbreviations
AFM: Atomic force microscopy
ANOVA: Analysis of variance
FDA: Food and Drug Administration
FSL: Food-simulating liquids
HV: Vickers hardness
SEM: Scanning electron microscopy
VHN: Vickers hardness number
Introduction
Recent advancement in the mechanical properties of resin-based materials created a wide area of use by addressing the increasing esthetical demands.1,2 Due to this progress their use in wide and deep cavities has become a routine.3,4 In such cases, the incremental technique based on the polymerization of composite layers with 2 mm thickness is accepted as a gold standard. 5 However, in order to overcome the problems arising from the placement and polymerization of each layer separately, such as failure of bonding between the layers, risk of gap formation, contamination risk, and prolonged treatment procedure,6,7 the bulk-fill composites that can be polymerized up to 4 or 5 mm were introduced to the market.
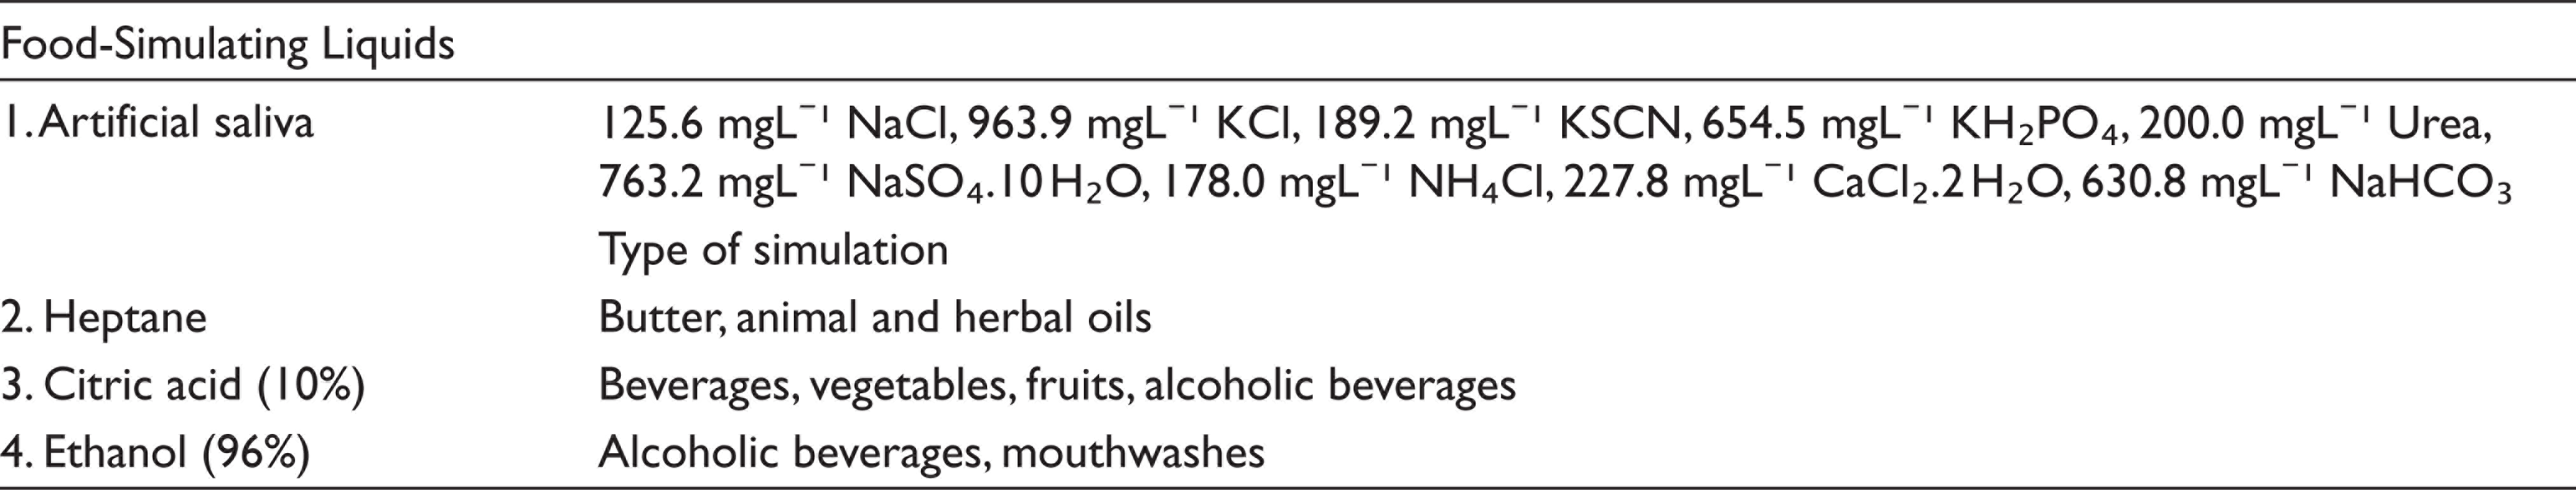
Daily consumed various chemicals in foods and beverages may cause deterioration on the surface of composite restorations and it results in unaesthetic appearance, increased surface roughness, and abrasions. 8 According to the guideline prepared by the American Food and Drug Administration (FDA), the food-simulating liquids (FSLs) were specified as citric acid, ethanol, and heptane.9,10 The citric acid is present in beverages, fruits, and candy-like foods, whereas the ethanol is present in alcoholic beverages and mouthwashes and heptane simulates butter, fatty meats, and vegetable oils. The factors such as chemical destruction and mechanical abrasion that occur due to the exposure to various solutions within the mouth may damage the surfaces of resin composite restorations and cause discoloration by making the surface roughened, increase in the plaque accumulation, soft tissue inflammation, and recurrent caries. 11
One of the most important properties of restorative materials for dentistry is the hardness of material being used. Hardness is defined as the penetration- or deformation-resistance of surface. 12 The high hardness values of resin composites enable them to successfully resist the effects that they are subject to within the mouth. The solubility, which is another important parameter, is defined as the dissolution of resins in the presence of oral liquids. 13 Having knowledge about the solubility of restorative materials is important in order to estimate their behavior in the oral environment. 14 The FSLs negatively affect their adaptation to the biological structures by increasing the chemical solubility of restorations. In conclusion, the solubility is an important parameter for the integrity of restoration, mechanical properties, surface characteristics, and esthetical appearance. 2
Despite recent studies carried out on bulk-fill composites, the number of studies reporting the effects of FSLs on the bulk-fill composites is limited in the literature. In this study, it is aimed to compare the surface roughness, surface hardness, and solubility of the bulk-fill composites, which are increasingly used in the dentistry routine, with the traditional resin composite after exposed to FSLs. The null hypothesis of the study is that FSLs will not have any effect on the surface roughness, surface hardness, and solubility of bulk-fill composites.
Materials and Methods
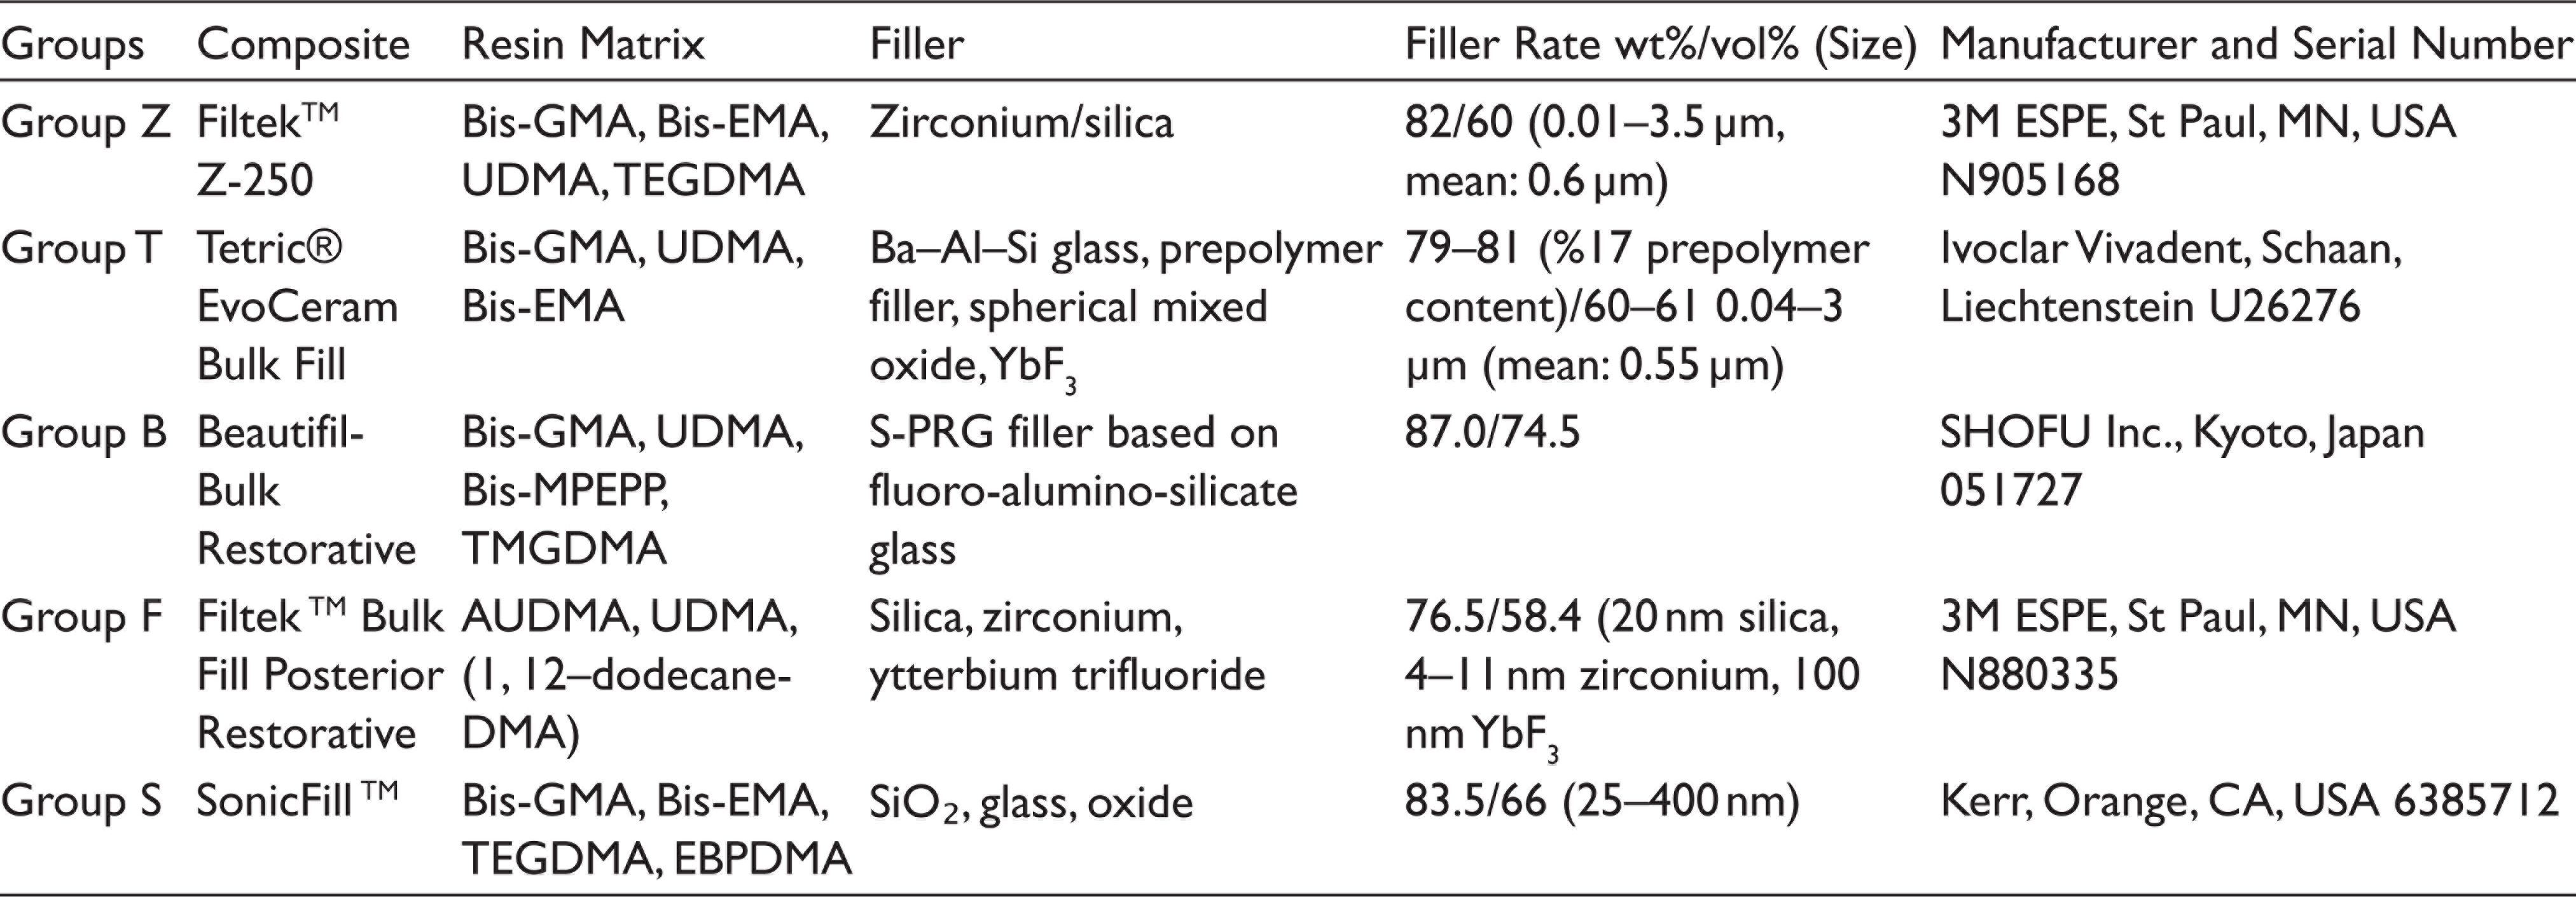
In presented study, four different high-viscosity bulk-fill composites [Tetric® EvoCeram Bulk Fill (Ivoclar Vivadent), SonicFillᵀᴹ (Kerr), Filtekᵀᴹ Bulk Fill Posterior Restorative (3M ESPE), Beautifil-Bulk Restorative (Shofu Inc.)], conventional microhybrid composite resin [Filtekᵀᴹ Z250 (3M ESPE)] were used and four different FSLs [ethanol (Teksoll 96%, Tekkim Chemical Ind. Trade. Co. Ltd., Turkey), heptane (n-Heptane, Tekkim Chemical Ind. Trade. Co. Ltd, Turkey), citric acid (citric acid 10%, Norateks, Turkey), and artificial saliva (control group)] were used.
The content, characteristics, and manufacturer information of the composite resins used in this study are presented in Table 1 and those of FSLs in Table 2. Disc-shaped specimens (8 mm diameter × 4 mm depth) were prepared using stainless-steel molds. Samples were prepared by applying bulk-fills in one step and were applied in layers at 2 mm thickness in accordance with the instructions of conventional composite Filtek Z250 manufacturer. The specimens were polymerized for 20 seconds with a polymerization unit [Eliparᵀᴹ S10 (3M ESPE, St Paul, MN, USA)]. Light intensity was periodically checked by a radiometer (LED Radiometer, SDI, Australia) after processing every five specimens, and it was verified to be higher than 1,000 mW/
Chemical Compositions and Manufacturer Details of the Tested Composite Resins
Food-Simulating Liquids Used in This Study
In this study, the same specimens were used for solubility, roughness, and microhardness tests.
Solubility
The specimens were inserted into a desiccator and maintained at 37 ± 1 °C for 22 hours and at 23 ± 1 °C for two additional hours, and then weighed using a digital balance (Precisa XB 220 A, Zurich, Switzerland). This procedure was repeated until a constant mass was obtained and the values were recorded in microgram (µg) as M1. The diameters and thickness of specimens were measured using a caliper (Mitutoyo–Absolute Digimatic NTD12-15C., Kanagawa, Japan) and the average volume of samples (V) was calculated in mm³.
Then the specimens were divided into four groups to be stored in FSLs. After this procedure, the specimens were placed in tubes containing different solutions and kept in a drying oven (EN025, Nüve, Turkey) at 37 ± 1 ºC for 7 days. At the end of the seventh day, the specimens were removed and reconditioned in the desiccator until they reached a constant weight (M2) using the same cycle described for M1. The water solubility values of composite specimens were calculated by using the following formula:
Wsʟ (µg/mm³) = M1 (µg) – M2 (µg)/V (mm³),
where Wsʟ: water solubility.
Surface Roughness
To measure the surface roughness of the specimens, a surface profilometer (Perthometer M2, Mahr, Germany) was used, with a 0.25-mm cutoff value and 2-mm tracing length. Three measurements were performed at the center of each sample in different directions, and the average surface roughness (Ra1) was determined and recorded in µm for each specimen. The profilometer was calibrated to meet the standards before each new measuring session.
After storage in FSLs, the second surface roughness measurements (Ra2) of the specimens were performed, as described earlier.
Surface Hardness
Surface hardness measurement was performed in the specimens only after exposure to FSLs, following the calculation of the solubility values, as the notches that will be formed by hardness measurement may affect the solubility values, which are sensitive parameters.
Lastly, the hardness value (P/d²) of each specimen was determined using a microhardness tester (Buehler UK Ltd, England) with a diamond Vickers indenter. By applying 200 g force on the surface for 10 seconds, a diagonal notch was prepared, and then measured by using a microscope connected to the device. Vickers hardness number (VHN) was calculated using the device according to the following formula:
HV = 1.8544 (P/d²), P = load (kgf) d = mean length of the notch’s two diagonals (mm).
Three indentations were recorded at different points on each specimen no closer than 1 mm to the adjacent indentations, and the mean values were calculated and recorded as VHN.
Five initial samples from each composite group and 20 samples from all the tested groups after storage in FSLs were sputter-coated with a 20 nm layer of Au/Pd to support the conductivity and examined using scanning electron microscope (SEM) (JEOL, JSM-7001FT-TLS LV, Oxford Nordlys EBSD) at an operating voltage of 10 kV at 1,500× magnification.
Statistical Analysis
IBM SPSS for Windows Version 22.0 software (Armonk, IBM Corp. NY) was used for the statistical analyses. The Shapiro–Wilk test was employed to verify the normal distribution of the data. The two-way variance analysis (ANOVA) was used for the comparisons between the groups in terms of surface hardness and solubility values. Variance analysis was used for the repetitive measurements in intergroup and intragroup comparisons of surface roughness. The pairwise comparisons were performed using the Bonferroni test. The level of significance was set as P < .05.
Results
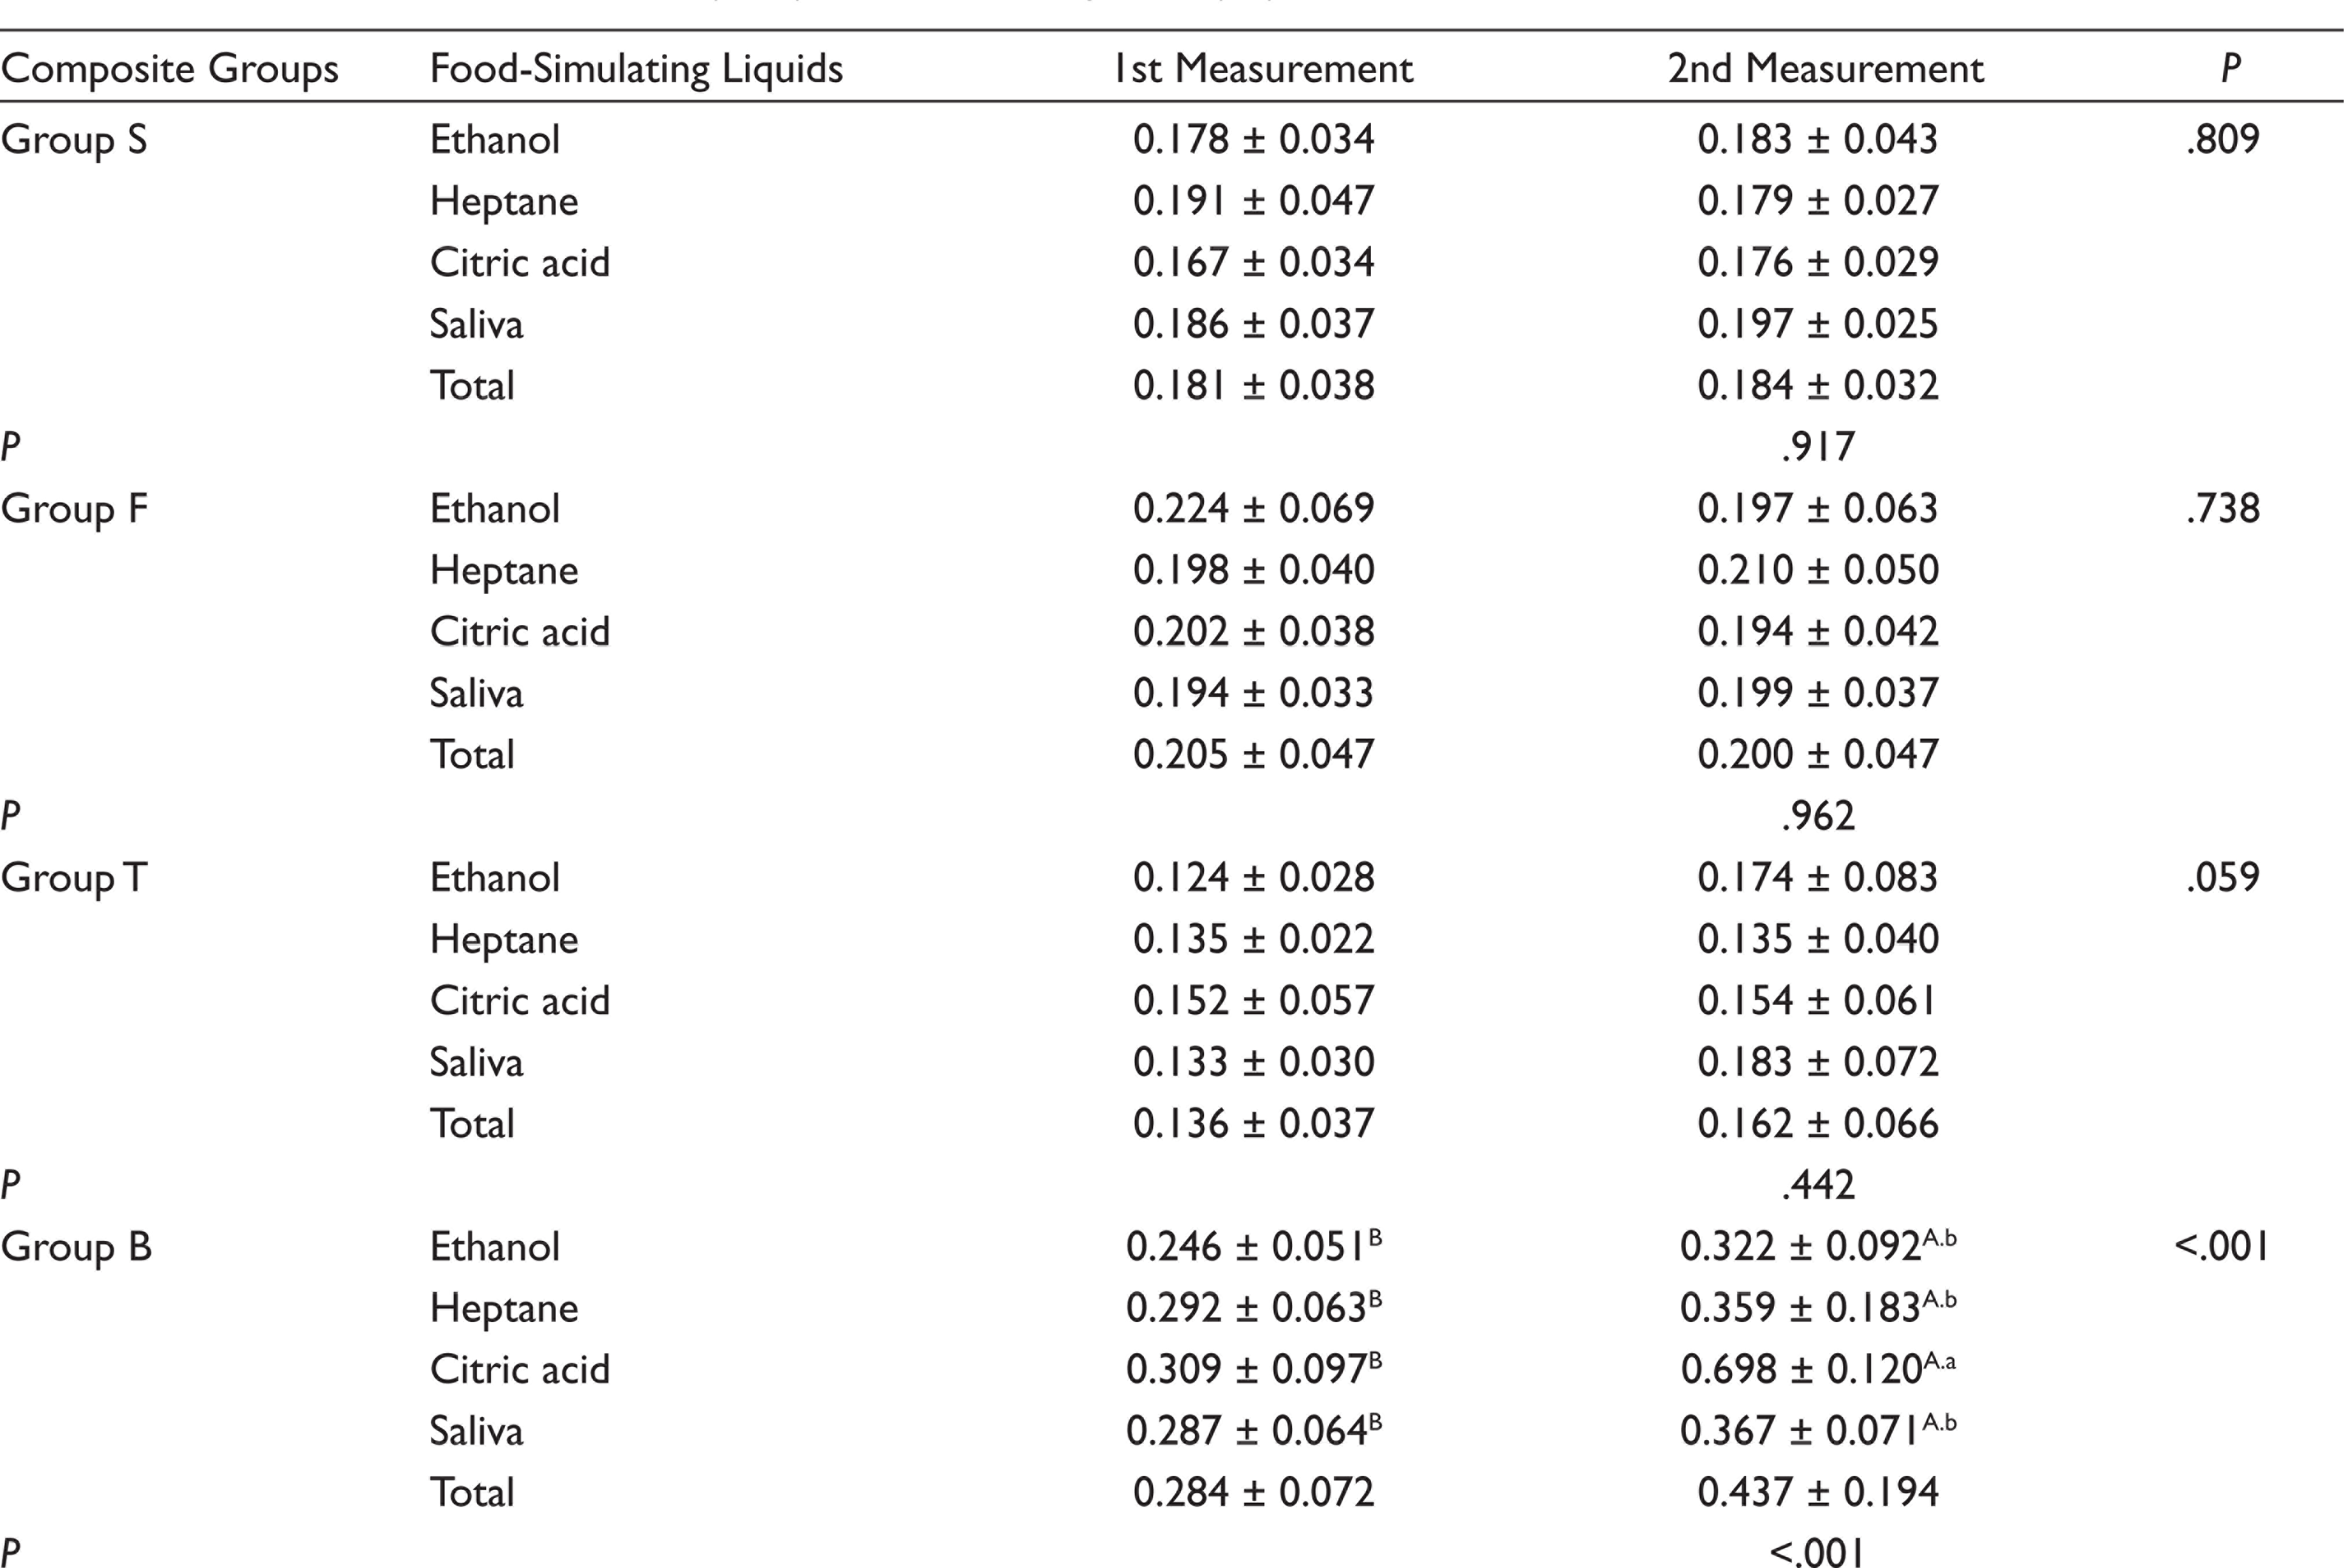
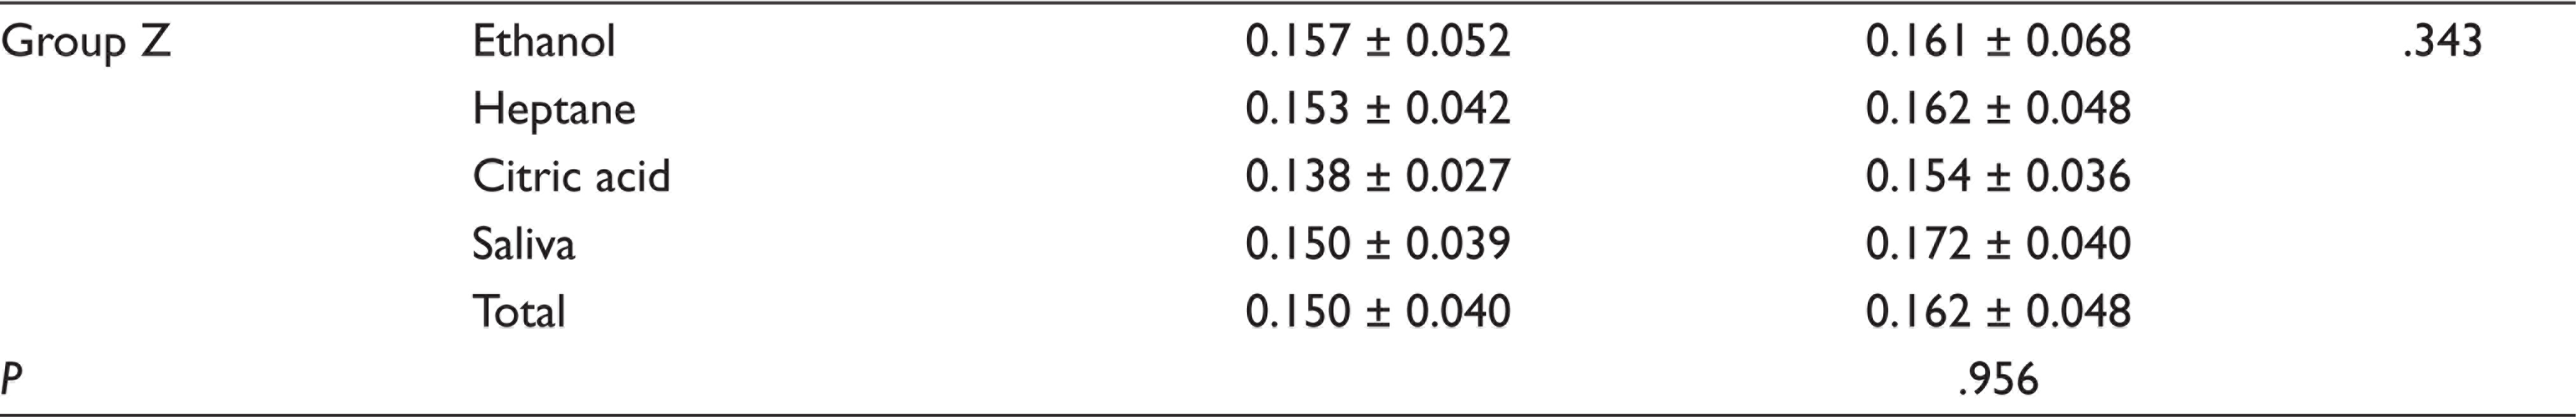
For five composite groups used in the study, the mean and standard deviation of the initial and second surface roughness values (µm) are presented (Table 3). Examining the initial surface roughness values, it was detected that the highest value was in Group B (0.284 ± 0.072), whereas the lowest values were found in Group T (0.136 ± 0.037) and Group Z (0.150 ± 0.040), and there was no statistically significant difference between Group T and Z. The difference between the second surface roughness values of the composites tested after storage in FSLs was significant only for Group B (0.437 ± 0.194). The highest surface roughness value was obtained in Group B stored in citric acid (0.698 ± 0.120), and this value was statistically significant (P < .01). In Group B, there was no significant difference between the surface roughness values of ethanol, saliva, and heptane groups (P > .05).
Means ± Standard Deviations (±SD) of Surface Roughness (Ra)
The mean ± standard deviation values of the surface hardness values of tested composites after exposure to each solution are presented (Table 4). According to these results, among the specimens stored in ethanol, the highest surface hardness value was found in Group Z (108.87 ± 8.57) and the lowest value was found in Group T (67.99 ± 7.48). After storage in saliva, the highest surface hardness without any statistically significant difference was detected in Group Z (111.57 ± 7.64) and Group B (105.93 ± 15.05), respectively, whereas the lowest value was found in Group T (64.78 ± 5.87). Among the specimens exposed to citric acid, Group B (164.84 ± 33.09) and Group T (61.66 ± 4.29) exhibited the highest and lowest surface hardness values respectively. In heptane group, Group Z (101.44 ± 7.68) and Group B (90.37 ± 5.78) exhibited the highest surface hardness, whereas the lowest value was found in Group T (63.07 ± 2.82).
Means and Standard Deviations (±SD) of Microhardness Values (VHN) After Exposure
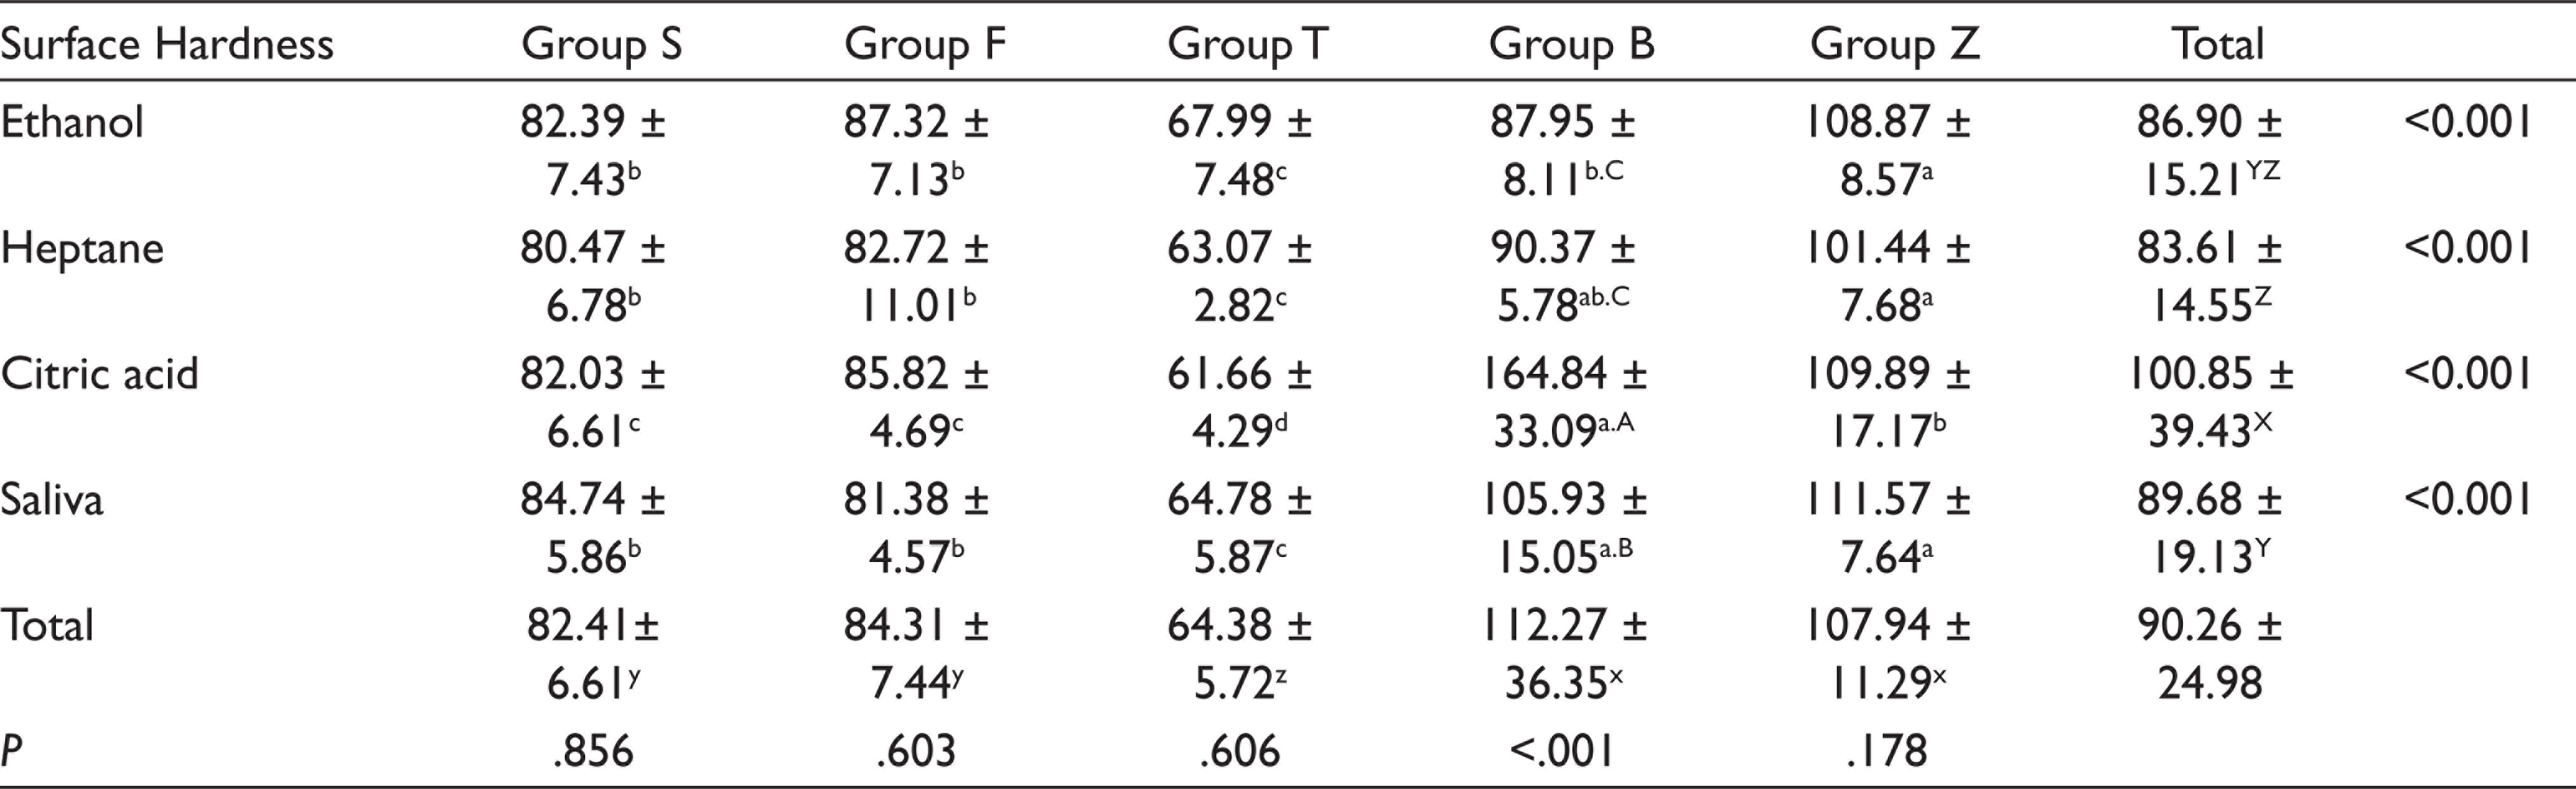
On the basis of four different solutions, a statistically significant result was obtained only in Group B (P < .001). In Group B, the highest surface hardness value was obtained in citric acid and the lowest values were in ethanol and heptane groups. The mean ± standard deviation of the solubility values tested composites after the exposure to FSLs is shown in Table 5.
Means and Standard Deviations (±SD) of WSL in µg/mm3
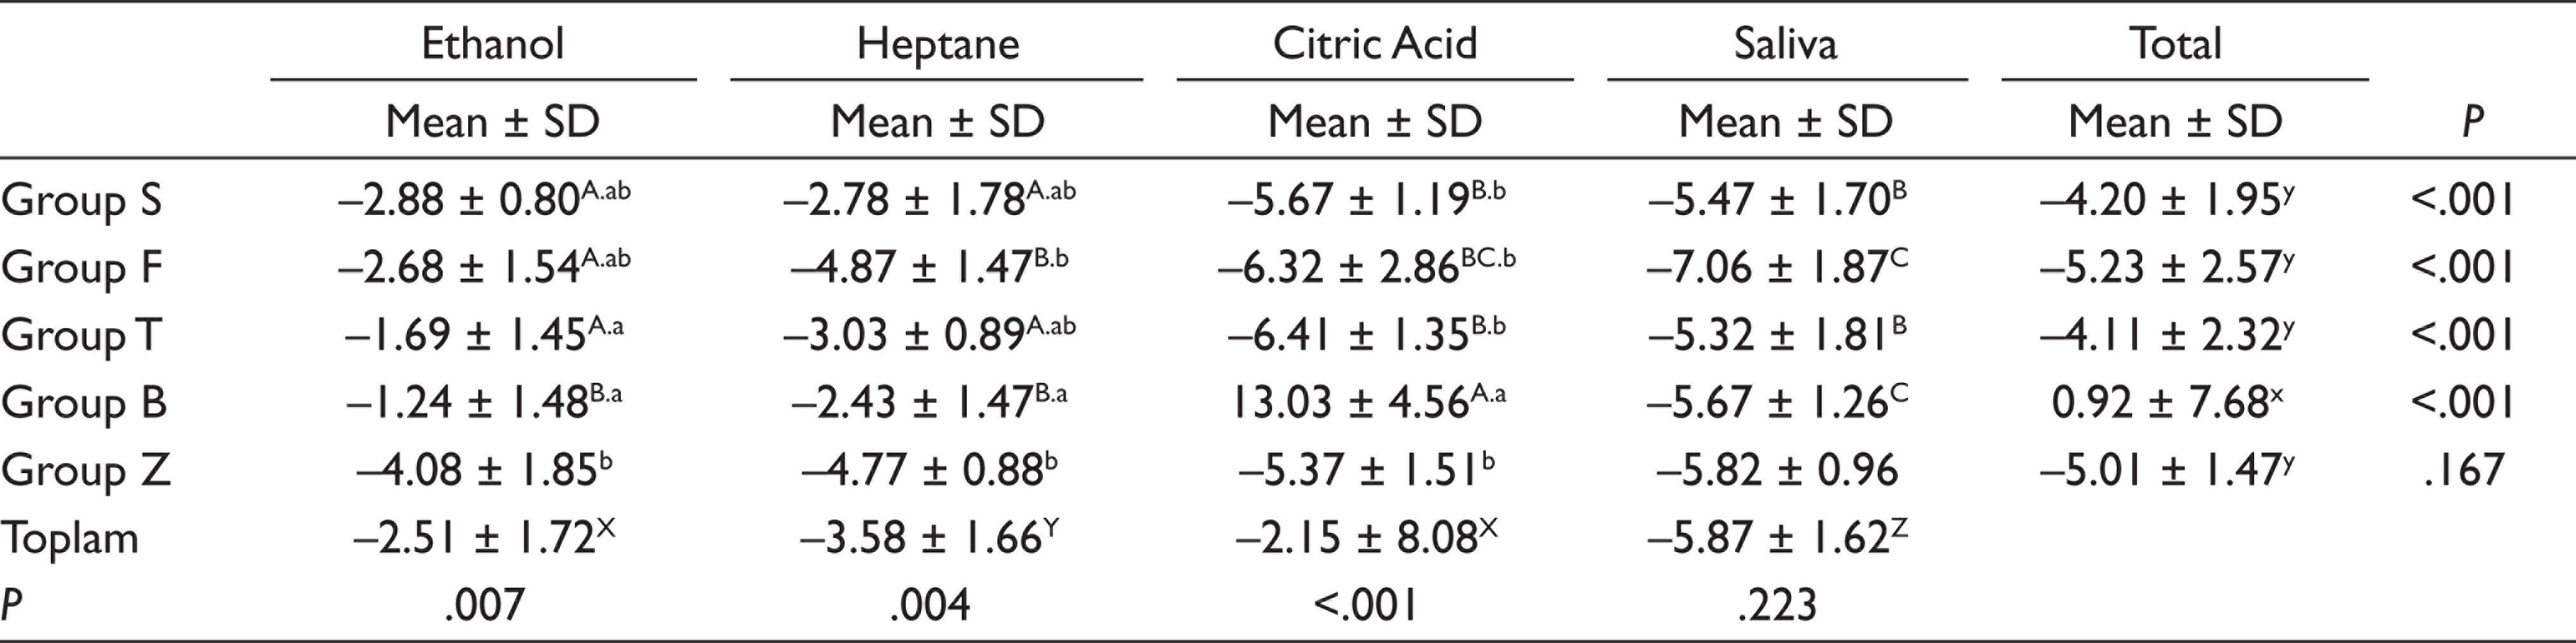
Given the solubility values of the composites, it was found that the highest solubility was obtained in Group B (0.92 ± 7.68 µg/mm3) and statistical significance of this value was higher than the other groups (P < .05), and the highest solubility value was found for citric acid.
SEM Images
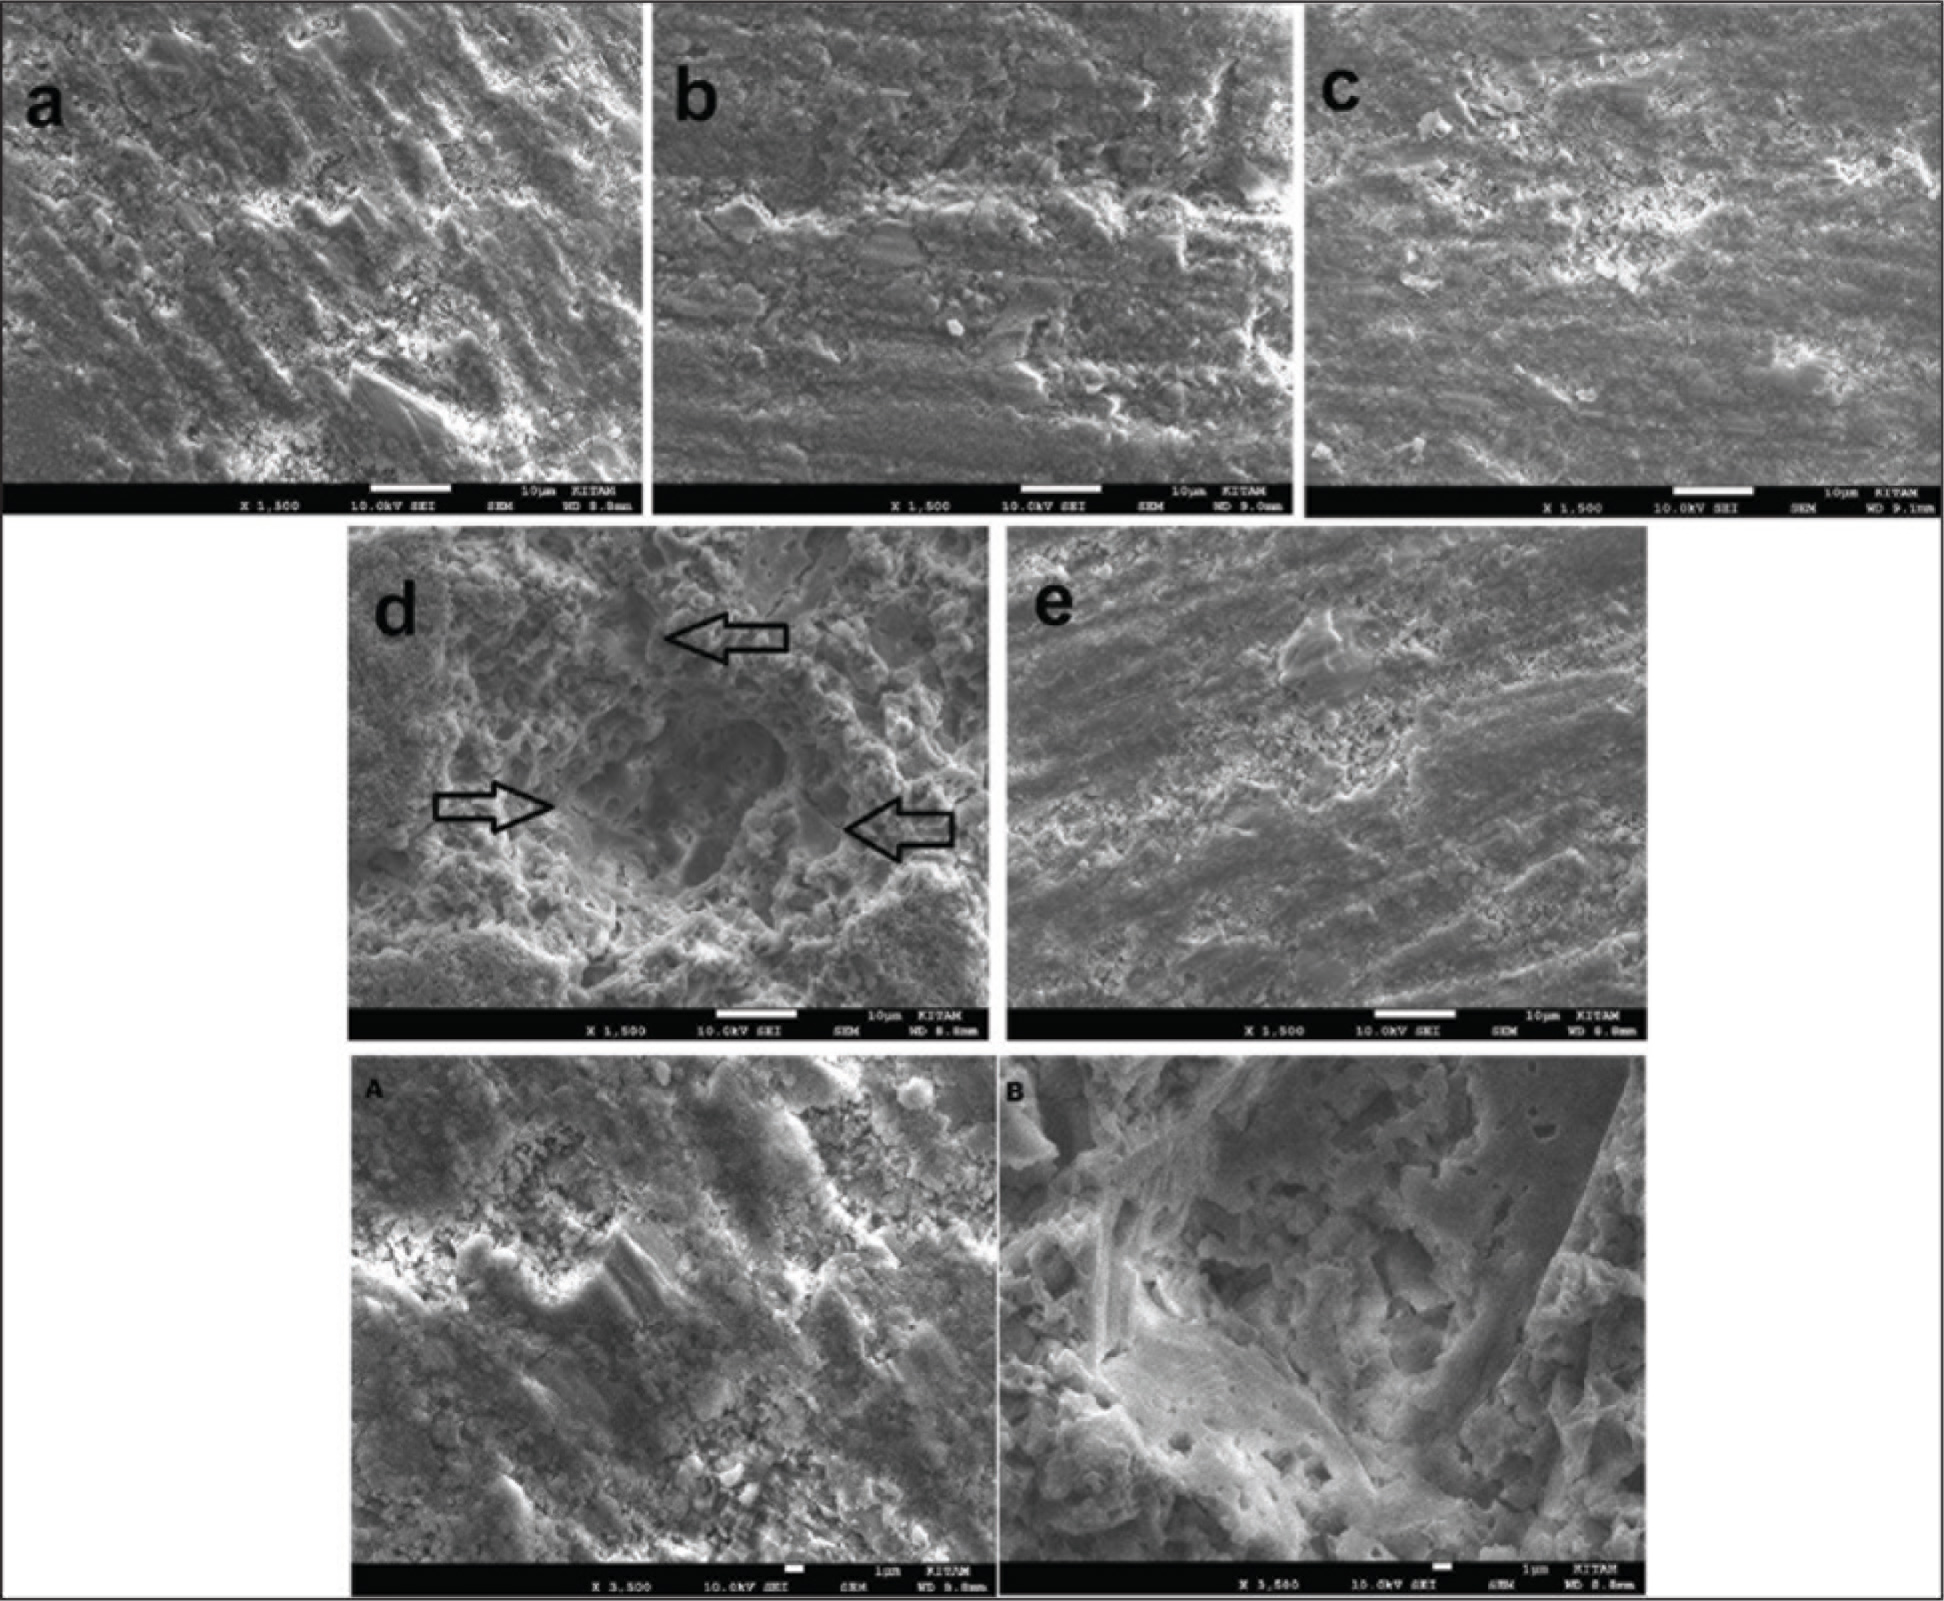
SEM images (Figures 1–3) that were obtained after storing the tested composites in FSLs are presented below. In Beautifil-Bulk Restorative group, increase in the surface roughness values in all solutions was supported by the surface images obtained from SEM. In these images, the gaps occurring because of the removal of inorganic fillers from the surface are pointed (Figure 1d).
SEM Images of Beautifil-Bulk Restorative Group at 1,500× Magnification, (a) Before Immersion, After Immersion in (b) Ethanol, (c) Heptane, (d) Citric Acid, (e) Saliva; and at 3,500× Magnification, (A) Before Immersion, (B) After Immersion in Citric Acid
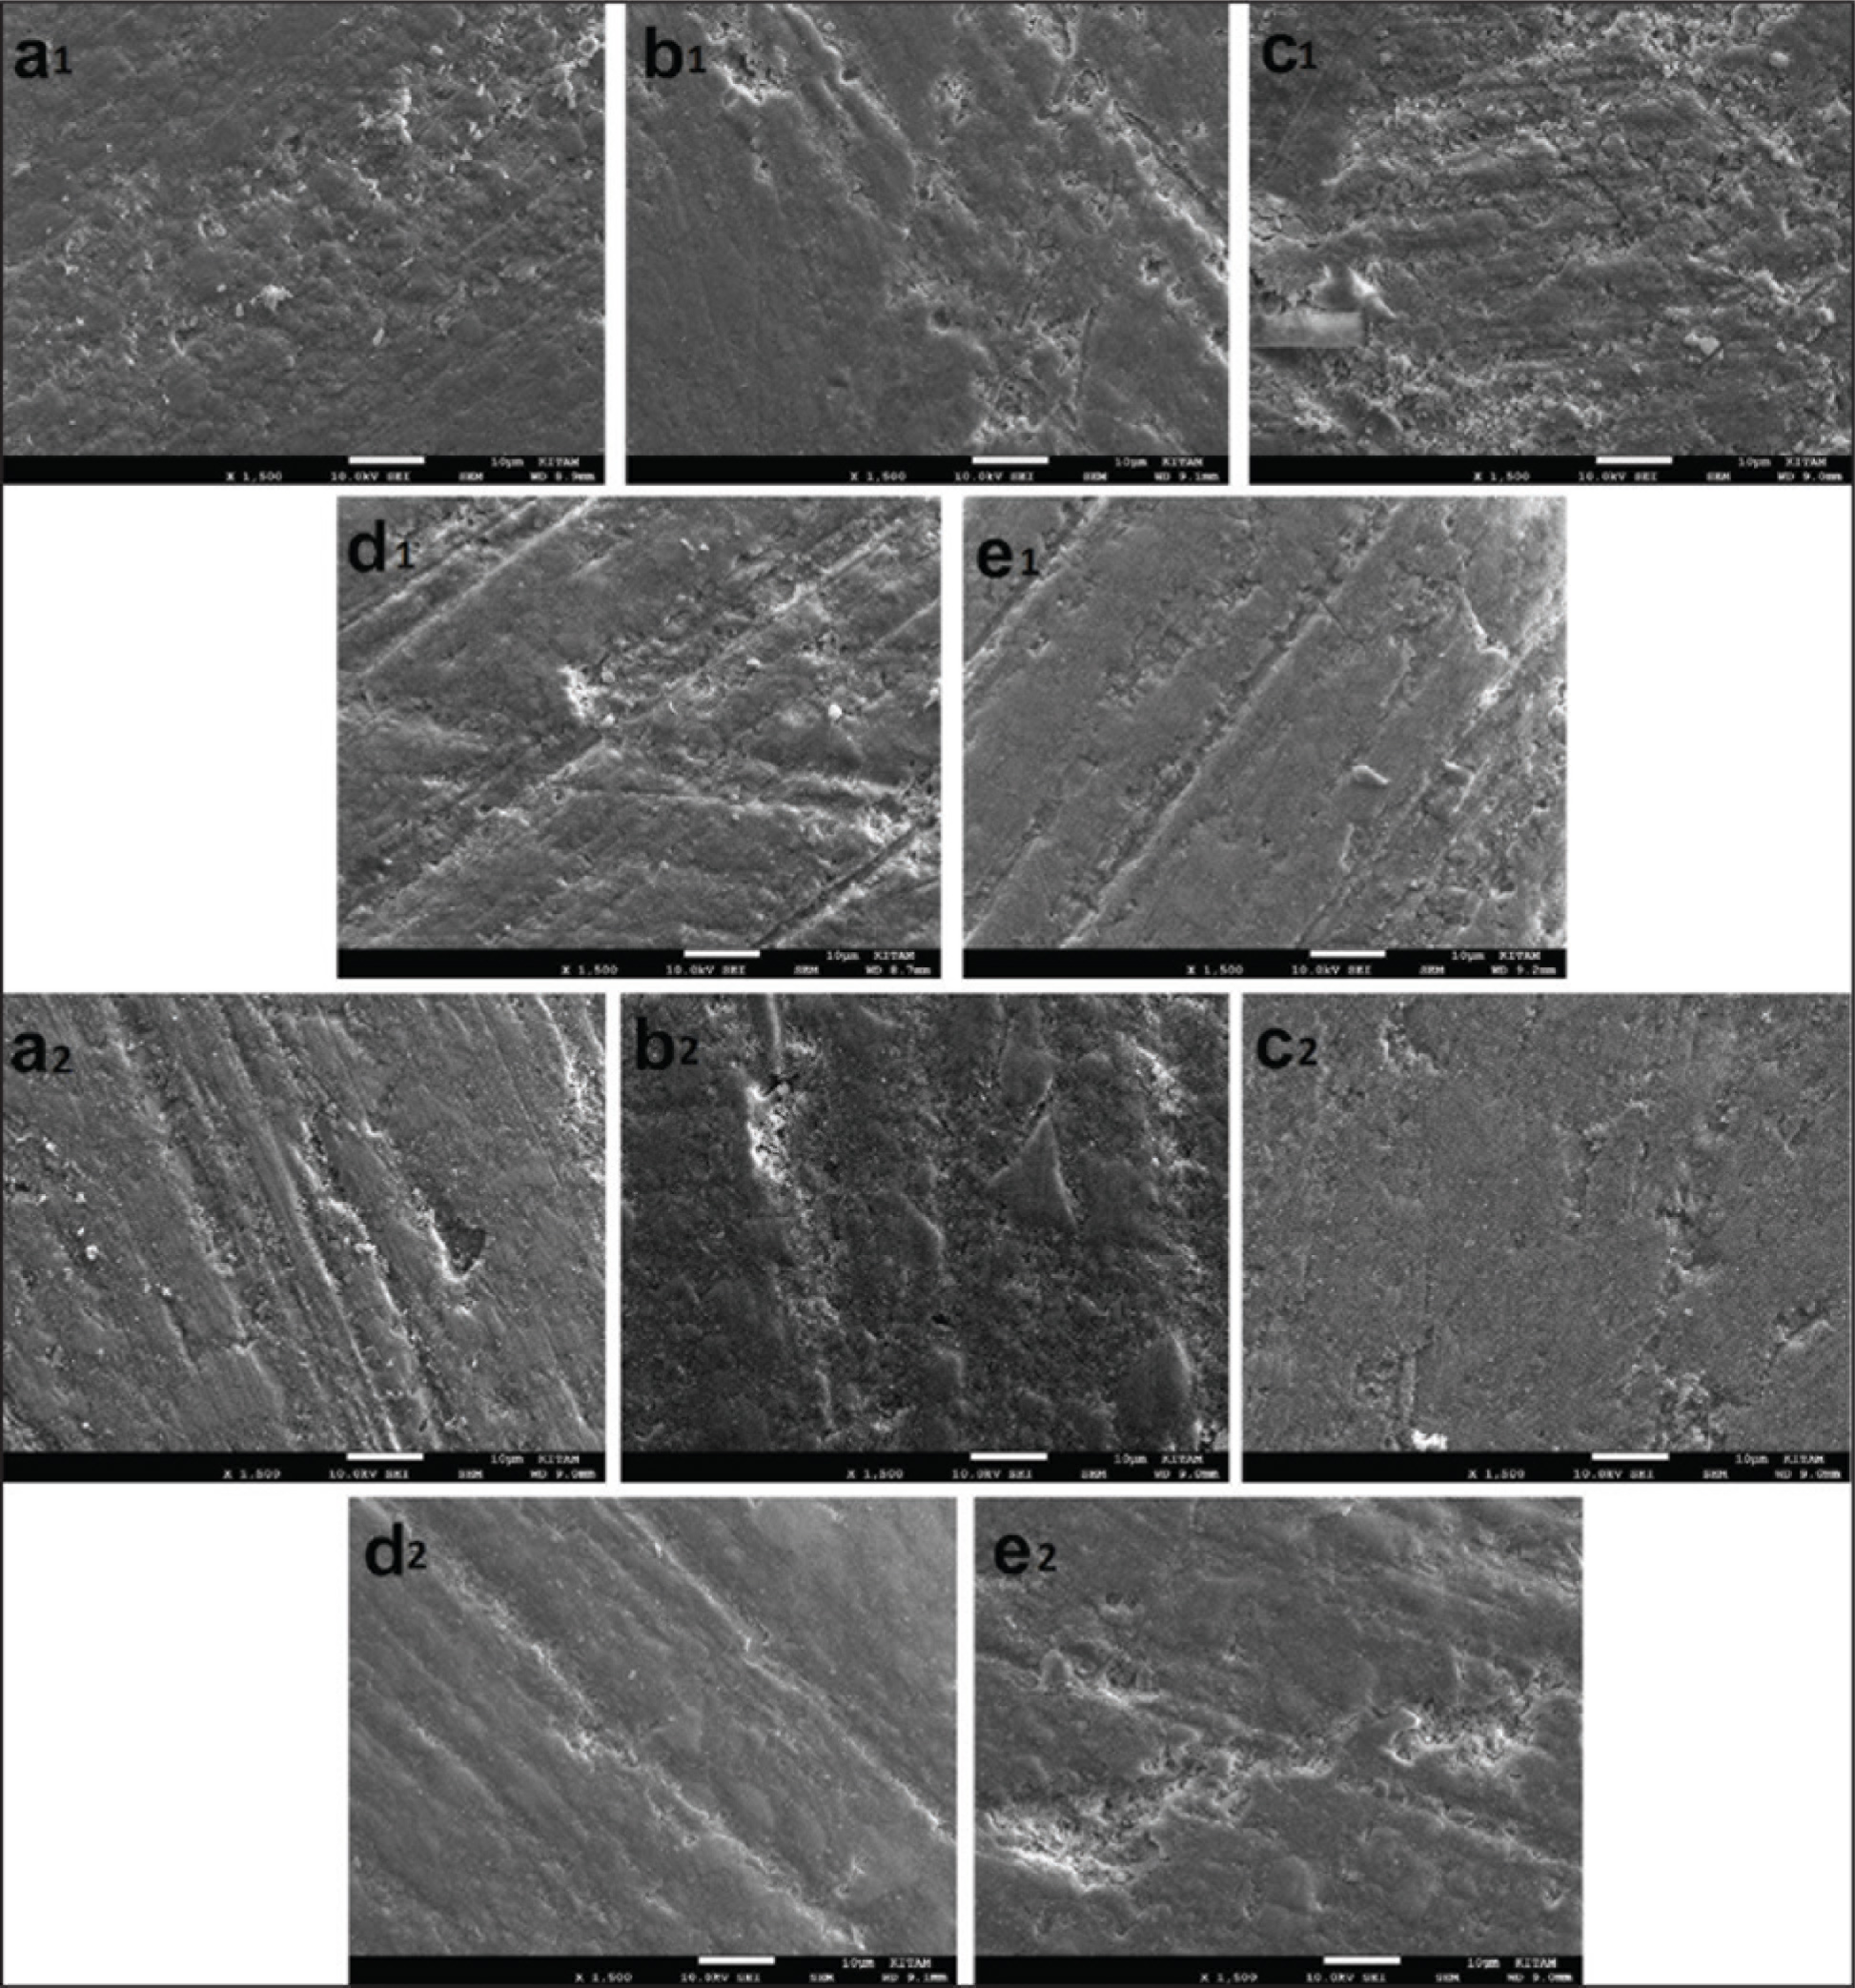
SEM Images of FiltekTM Bulk Fill Posterior Restorative group at 1,500× Magnification, (a1) Before Immersion, After Immersion in (b1) Ethanol, (c1) Heptane, (d1) Citric Acid, (e1) Saliva; and SonicFillTM Group at 1,500× Magnification, (a2) Before Immersion, After Immersion in (b2) Ethanol, (c2) Heptane, (d2)Citric Acid, (e2) Saliva
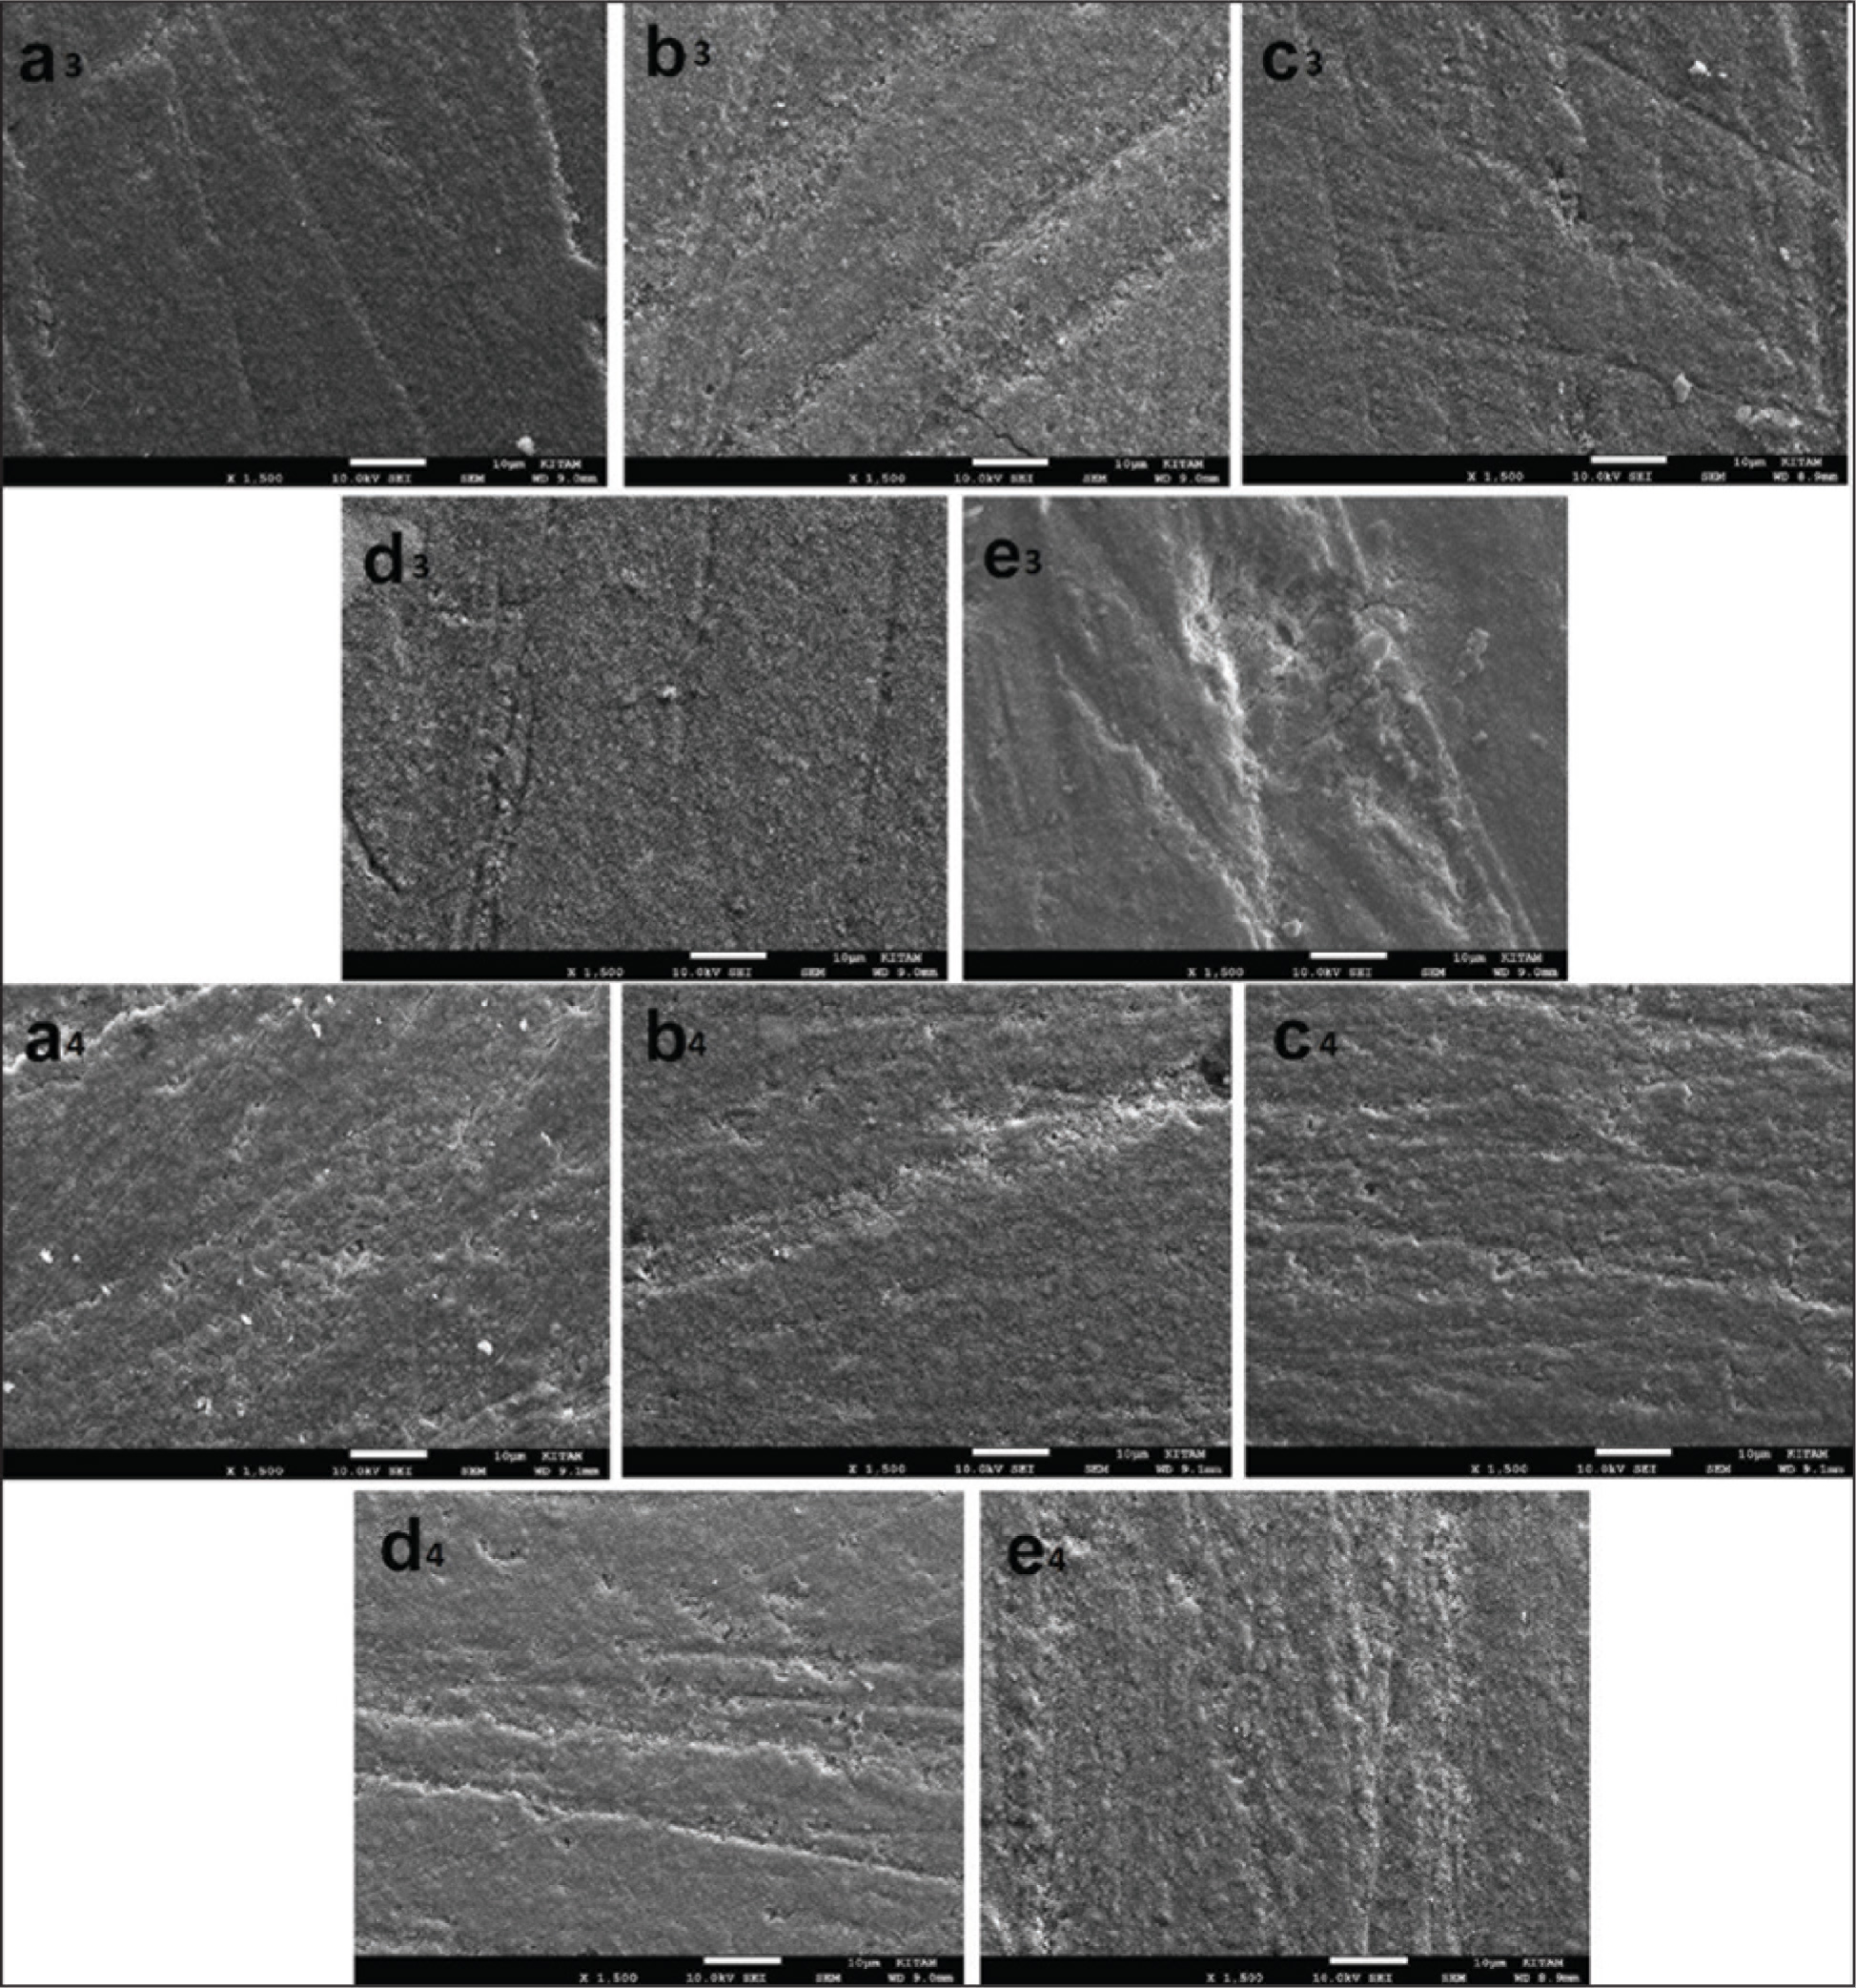
SEM Images of Tetric® EvoCeram Bulk Fill Group at 1,500× Magnification, (a3) Before Immersion, After Immersion in (b3) Ethanol, (c3) Heptane, (d3) Citric Acid, (e3) Saliva; and FiltekTM Z250 Group at 1,500× Magnification, (a4) Before Immersion, After Immersion in (b4) Ethanol, (c4) Heptane, (d4) Citric Acid, (e4) Saliva
Discussion
The null hypothesis that “the FSLs would not have any effect on the surface roughness, surface hardness, and solubility of bulk-fill composites” was partially rejected since the solutions yielded significant changes only in S-PRG fillers of Beautifil-Bulk Restorative composite. The degradation of the fillers in this group caused a significant increase in all tested parameters.
In the list of chemicals that were identified by the FDA as FSLs are heptane, ethanol, citric acid, and distilled water.9,10 Each solution caused the destruction of mainly one component of resin-based materials. As reported by Yap et al., 15 Bis-GMA matrix is sensitive to the softening effect of FSLs. Besides that, the inorganic fillers may be destructed by weak acids such as citric acid and the water. 1 Thus, it can be stated that the environment, to which the restorative materials are exposed, has an important effect on the destruction of materials. Kooi et al. 16 reported that various resin composite restorations were chemically destructed in FSLs (air, distilled water, citric acid, and ethanol) and there was a negative correlation between increased surface roughness values and decreased hardness values. Yap et al. 17 reported that the abrasion levels of composite materials may be affected by the chemical solvents, they might soften when contacted with chemical materials and fillers may come out.
Regarding the previous studies, it can be said that various qualitative and quantitative methods were used in determining the surface roughness. Some of them are atomic force microscopy (AFM), two dimensional (mechanical) and three dimensional (optic) profilometer, and SEM. 18 The mechanical profilometer is the measurement instrument most widely used in assessing the surface properties of resin composites, and it was also used in the present study. Also, the mechanical profilometers were found to be more useful in assessing the surface treatments applied afterwards on the surfaces of materials. 19 Moreover, SEM was used in this study, and it was aimed to examine the surface topography of specimens in a more detailed manner.
Previous studies16,20 stated that giomer-based composites exhibited higher roughness values compared to traditional resin-based materials because of the large particle size of S-PRG fillers. Similarly, in the present study after ensuring surface standardization of the tested composites with Sof-Lex discs, initial Ra measurement exhibited that Beautifil-Bulk Restorative group had the highest surface roughness values among the tested composites. Tanthanuch et al. 21 reported an increase in surface roughness and a decrease in microhardness values, for the bulk-fill composites stored in food-simulating solutions and beverages for 28 days.
A previous study researched the effect of FSLs (distilled water, 50% ethanol, 0.02 N citric acid, air-control) on the surface roughness and hardness values of giomer (Beautifil II, Beautifil Flow Plus F00), direct (Filtek Z250) and indirect (Ceramage) hybrid composites. It was reported that giomers were destroyed by these solutions, surface hardness was significantly affected by citric acid and ethanol, and the citric acid caused a significant increase in surface roughness. 16 In this study it was found that specimens in Beautifil-Bulk Restorative group were affected by citric acid at most after being kept in FSLs (Figure 1d–1B). The mean initial Ra value of specimens in this group was found to be 0.284 ± 0.072 µm, whereas the mean Ra value increased to 0.698 ± 0.120 µm after being kept 7 days in citric acid. Similar to the present study, Kooi et al. 16 stated that specimens in giomer-based Beautifil II group were significantly destructed by citric acid, and they reported that this might be because fluorosilicate glass fillers are more sensitive to the decomposition of weak acids.
Given the SEM images of the samples tested in the present study, it was observed that other composites were affected by the FSLs less than Beautifil-Bulk Restorative group. Because they have smaller particle structures, the gaps occurring after the removal of inorganic fillers did not cause a significant difference in the surface roughness. The size of gaps occurring because of the removal of S-PRG fillers as a result of the exposure of Beautifil-Bulk Restorative group to solutions can be clearly distinguished by SEM images, and this is thought to be an indicator of a significant increase in the surface roughness. It was determined that surface roughness of composite restorations is affected by the duration of contact with an aqueous environment, in which they are. 15 In a previous study, it was reported that the properties of restorative material, the type of storage solution, and the assessment period play an effective role in the microhardness of composites, whereas the prolonged duration of exposure to the solutions may have more effect on the resin properties. 22
In another study, the surface hardness values of restorative materials were compared, after aging in distilled water for 30 days and applying 5,000 thermal cycles, and it was reported that giomer (Beautifil) showed higher surface hardness (78.97 kgf/mm2) than conventional composites (Esthet-x: 64.42 kgf/mm2, Admira: 49.11 kgf/mm2) and compomer (Dyract: 56.01 kgf/mm2). 23 In the study of Tanthanuch et al., 21 on comparing the microhardness of various bulk-fill composites (SDR, SonicFill, Tetric N-Ceram Bulk Fill, Filtek Bulk Fill), after exposed to food-simulating solutions and beverages, it was detected that the most significant decrease in the microhardness values was observed with passion-fruit juice having a high concentration of citric acid, whereas SDR was found to be the bulk-fill composite that is affected at most. In the present study, it is considered that white opaque layer, which can be macroscopically observed on the surfaces of specimens in giomer-based Beautifil-Bulk Restorative group exposed to citric acid, might be due to the ions precipitating to the surface. Beautifil-Bulk Restorative group is thought to exhibit higher surface hardness values due to this layer. By storing the restorative materials (Beautifil II, Gradia Direct X, Tetric EvoCeram, and Fuji IX Extra) in deionized water (pH 6.5) and lactic acid (pH 4.0) in a previous study, it was comparatively examined how the fluor release, recharge properties, and mechanical properties (surface hardness and elasticity module) were affected. 24 Similar to the present study, it was reported that the surface hardness value of Beautifil II group stored in deionized water and lactic acid (0.7–0.8 GPa) was approximately twice as much in comparison to valuesobtained in Tetric EvoCeram group (0.4–0.5 GPa).
In a study evaluating the specimens prepared by using giomer (Beautifil II), compomer (Dyract Extra), glass ionomer (Ketac), and resin composite (Tetric EvoCeram) in terms of surface hardness, Condò et al. 25 reported that the surface hardness value of Beautifil II group was approximately twice of surface hardness values of Tetric EvoCeram and Dyract Extra groups. In a previous study that was comparing giomer- (Beautifil-Bulk Restorative, Beautifil-Bulk Flow) and resin-based composites’ (Tetric EvoCeram Bulk Fill, SDR) characteristics such as surface hardness and polymerization depth, it was reported that micromechanical properties of giomer materials were higher than resin composites, as stated in the present study. 26 ISO 4049, which is used to determine the water sorption and solubility values, is one of the reliable standards. 27 According to ISO 4049 (2009a), water sorption and solubility values must be lower than 40 µg/mm3 and 7.5 µg/mm3, respectively.27,28 In this study, the solubility values obtained by using the formula given in the standard were found lower than the values specified in the ISO criteria in all groups except Beautifil-Bulk Restorative group stored in citric acid. The solubility value of Beautifil-Bulk Restorative group stored in citric acid was found to be 13.03 ± 4.56 µg/mm3 at the end of seventh day. In the present study, it was determined that the solubility values for all of the composite groups, except for the Beautifil-Bulk Restorative group, were negative. Considering that materials might have not completed the dehydration process, negative solubility values can be interpreted as a sign of solubility of the materials occurred at low levels, rather than not occurring at all. In their study, Lopes et al. 29 reported that negative solubility values of tested composites might occur due to the resin composite is more sensitive to water sorption, which causes an increase in mass and which may mask the real solubility. In another study, it was stated that negative solubility values might be related with partially absorption of water within the resin matrix and they cannot be removed irreversibly. 30
According to the solubility values in the present study, it can be concluded that dissolution of Beautifil-Bulk Restorative at highest level in citric acid might be due to presence of fluorosilicate glass fillers in Beautifil-Bulk Restorative, which are very sensitive to weak acids.
Restorations can be exposed to solutions at different temperatures and mechanical forces such as chewing forces and toothbrushing, and it is thought that this situation may affect the surface roughness, hardness, and solubility values of the composites. Therefore, inability to completely simulate oral environment is the limitation of this study. Further research investigating whether these properties of composite materials change in different storage environments, periods, temperatures, even under different forces is needed.
Conclusions
In the lights of data obtained from this study, it can be concluded that the effects of FSLs on the tested high-viscosity bulk-fill composites are similar to conventional ones, except giomer-based bulk-fills. As giomer-based ones are highly negatively affected especially from acidic solutions, the clinicians should avoid using these ones on patients having acidic diets in their daily lives.
Author Contributions
ÖGC: acquisition of data, analysis, and interpretation of data, drafting the article, final approval of the version to be published. NG: conception and design of the study, revising it critically for important intellectual content, final approval of the version to be published. All authors read and approved the final manuscript.
Footnotes
Declaration of Conflicting Interests
The authors declared no potential conflicts of interest with respect to the research, authorship, and/or publication of this article.
Funding
The authors disclosed receipt of the following financial support for the research, authorship, and/or publication of this article: This study was supported by Ondokuz Mayıs University, Scientific Research Committee (# project number: PYO.DIS.1904.17.022).