
Abstract
This study analyzed post match data from the men's singles events at the 2025 Australian Open, French Open, and Wimbledon Championships to examine the relationship between match outcomes and technical performance across different court surfaces. Technical variables were compared between winners and losers using paired-samples t-tests, followed by exploratory binary logistic regression to identify key performance indicators. Surface-related differences in champions’ performance were examined descriptively across hard, clay, and grass courts. The results indicated that first serve points won and return points won were key predictors of match outcomes across all surfaces, with return points won showing predictive value specifically at the Australian Open and Wimbledon, and break point conversion rate being predictive at the French Open. Championship players recorded a higher number of winners at the French Open compared with the Australian Open and Wimbledon, suggesting that surface-specific bounce characteristics may facilitate more aggressive offensive play.
Keywords
Introduction
In modern high-intensity men's professional tennis, technical versatility and performance stability are essential competencies. In the four Grand Slam tournaments, differences in court surfaces can critically affect match outcomes and technical performance (Cui et al., 2017; Ulusoy and Söğüt, 2025). Among them, the Australian Open (hard court), French Open (clay court), and Wimbledon Championships (grass court) represent distinct surface types that influence stroke patterns. Players must quickly adapt to surface induced variations in ball bounce and speed to implement tactical adjustments (Carboch et al., 2019; Gao et al., 2024).
Raizada et al. (2025) reported that clay courts at the French Open produce higher ball bounces, allowing more time for positioning and longer baseline rallies, emphasizing consistency and spin. Grass courts at Wimbledon, with lower friction, generate faster and lower bounces, favoring shorter rallies and aggressive net play (Fitzpatrick et al., 2024a). The Australian Open features a more balanced hard court, requiring high physical fitness and movement ability, with serve and return performance being crucial (Gao et al., 2024). Grambow et al. (2020) noted that competition intensifies in later rounds as players adjust to surface conditions. Only the top 32 seeded players participate in these stages, reflecting high competitiveness and influence (Fitzpatrick et al., 2024a; Hizan et al., 2015).
The analysis of athletic performance is a critical component of competitive tennis. Traditionally, post match data were recorded by tactical analysts through video observation, requiring substantial time and effort. Modern technology allows precise tracking of every stroke, providing more accurate and representative information (Bozděch and Zháněl, 2023; Krizkova et al., 2021). Player performance can be influenced by physiological, psychological, and environmental factors, making it crucial to understand how athletes maintain stability under high-intensity pressure (Deng et al., 2023; Verschueren et al., 2020). Bozděch et al. (2024) and Fernández-García et al. (2019) emphasized that elite match analysis should integrate post match data, court advantages, and tactical execution, as these interrelated factors require quantitative verification.
On court performance reflects both training and match experience. Baseline rally strategies may favor clay courts, but their effectiveness on hard or grass courts remains uncertain (Bozděch et al., 2024; Pluim et al., 2023). Mecheri et al. (2016) noted that key winning strategies can be identified through post match quantitative analysis. Most studies focus on single surface comparisons, with few examining technical performance across surfaces or analyzing champions. This study used official 2025 Australian Open, French Open, and Wimbledon men's singles data (round of 32 to final) to examine the relationship between court characteristics, match outcomes, and technical variables. The objectives were: (1) to explore surface effects on match outcomes and technical variables; (2) to examine champions’ pathways, providing evidence based insights for coaching and training.
Method
Participants
This study collected and analyzed official post match data from the men's singles events of the 2025 Australian Open, French Open, and Wimbledon Championships. Data from the round of 32 to the final were compiled, resulting in a total of 92 matches: 31 matches from the Australian Open, 30 matches from the French Open (excluding one walkover by Arthur Fils), and 31 matches from Wimbledon. A summary of the match distribution across tournaments is presented in Table 1.
Match distribution across Grand Slam tournaments.

Data scope
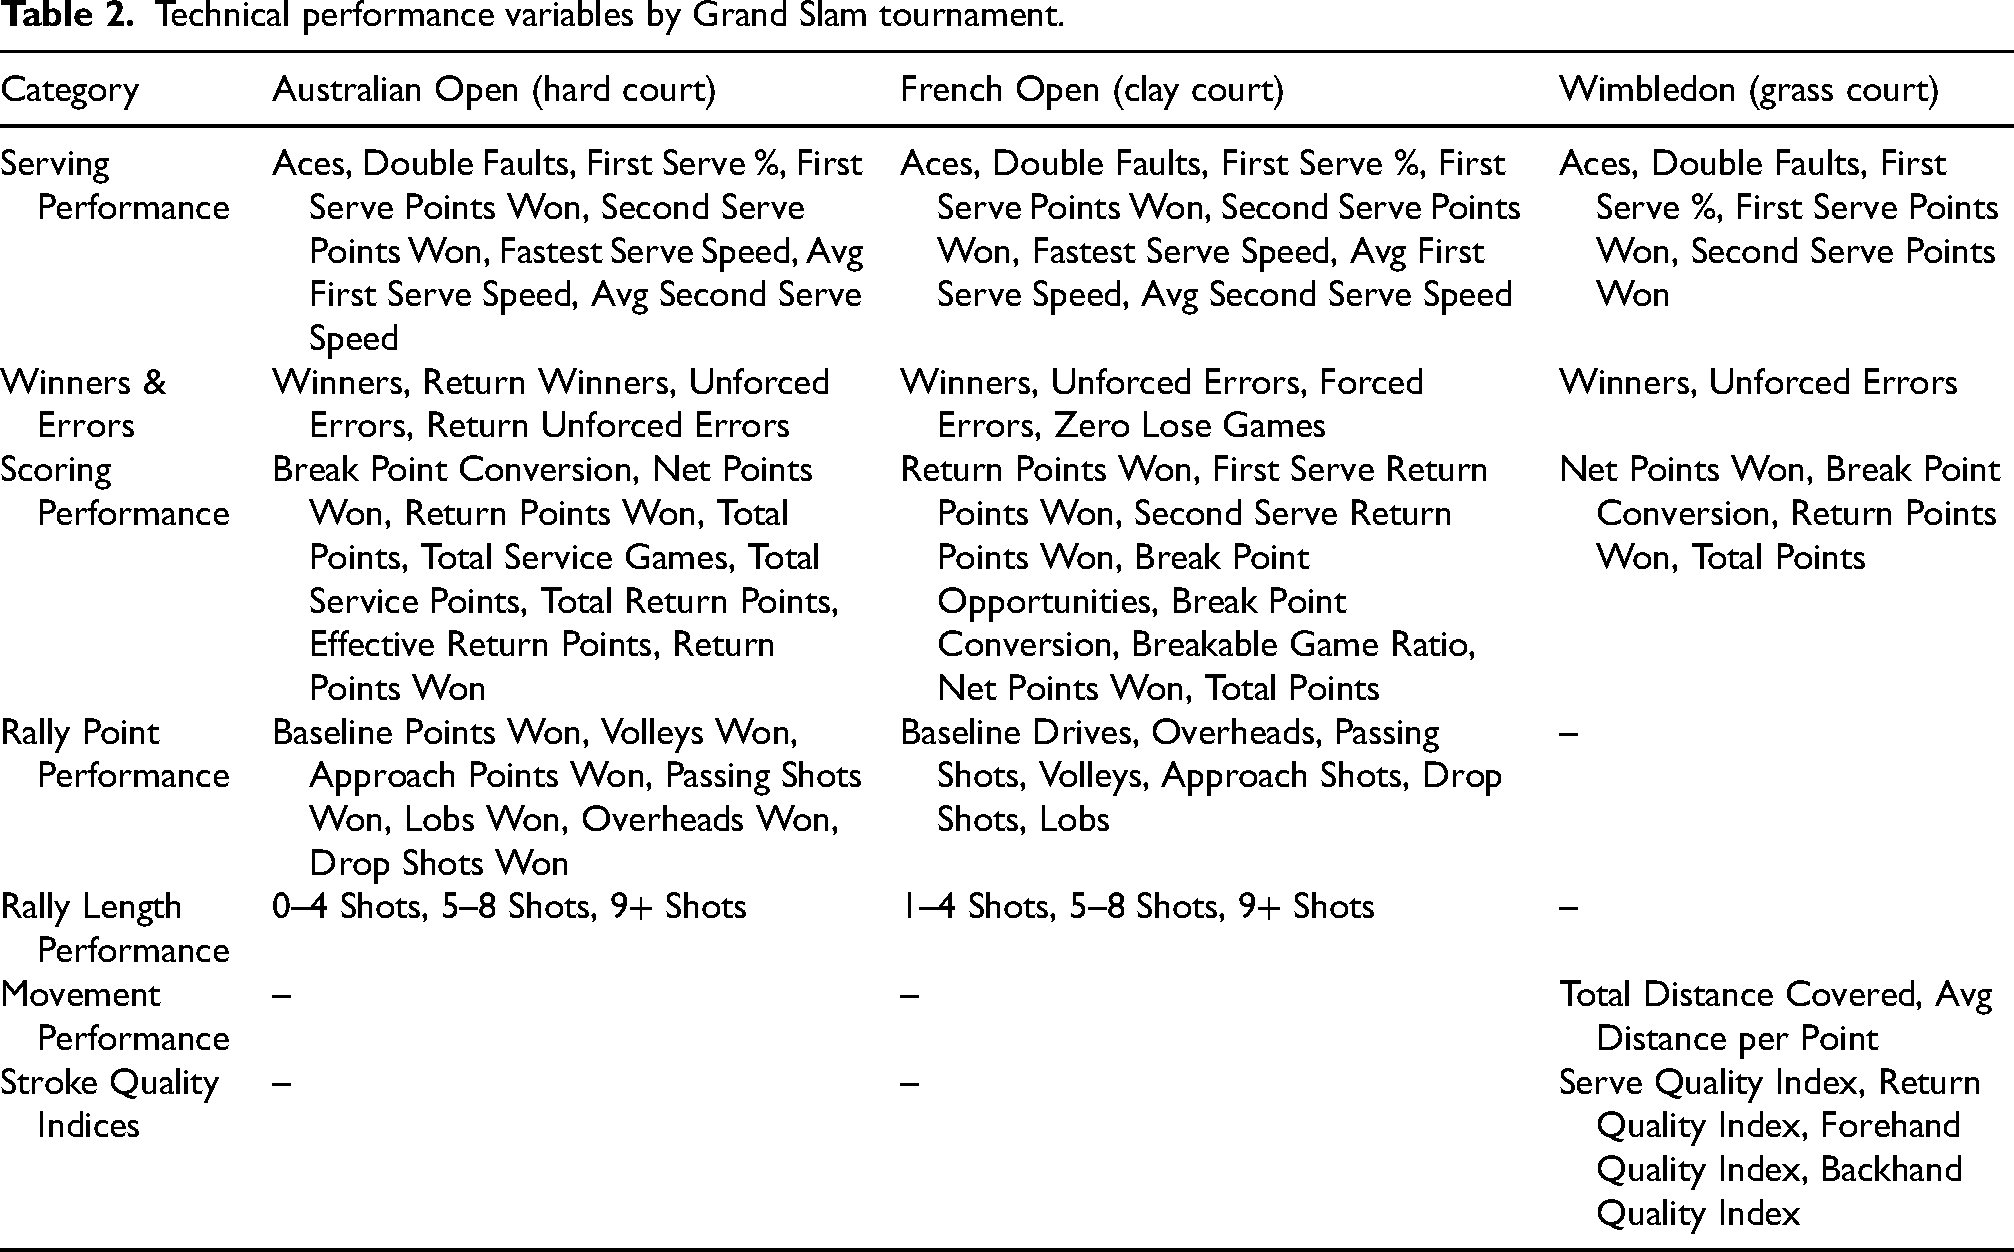
Technical performance variables were categorized and analyzed according to the data provided by each tournament's official website. Due to differences in available metrics across tournaments, variables were grouped accordingly. Overall, the categories included: serving performance, winners and errors, scoring performance, point winning performance during rallies, rally characteristics, rally length, movement distance, and stroke quality indices. The detailed classification of these technical performance variables is shown in Table 2.
Technical performance variables by Grand Slam tournament.
Statistical analysis
All analyses were conducted using SPSS 23.0, with significance set at α = .05.
Objective 1: Differences in technical variables between winners and losers from the round of 32 to the final were analyzed using paired-samples t-tests, as each match produces paired observations. To control for multiple comparisons, statistical significance was assessed using a Šidák correction, with the per-test significance level calculated as
Classification performance of each logistic regression model was evaluated using the classification table to determine overall and per-class accuracy. Classification accuracy was calculated as the proportion of correctly predicted matches, according to the formula:
In addition, the discriminative ability of the final models was assessed using receiver operating characteristic (ROC) curves and the area under the curve (AUC). ROC curves and AUC values were generated only for models including statistically significant predictors, providing an indication of how well the model could distinguish between winners and losers.
Objective 2: To explore potential surface-related patterns among champions, the technical performance of the three eventual champions from the Round of 32 to the final was summarized descriptively for each surface (hard, clay, and grass). Mean values and standard deviations of selected technical variables were compared across surfaces to illustrate similarities and differences in the champions’ technical profiles.
Results
Differences in technical performance between winners and losers at the Australian Open, French Open, and Wimbledon
Australian Open: Differences Between Winners and Losers and Match Outcome Prediction
As shown in Table 3, Paired-samples t-tests revealed several significant differences between winners and losers at the Australian Open after controlling for multiple comparisons using a Šidák correction (p < .0016).
Comparison of technical performance between winners and losers at the Australian Open.

Note: Paired-samples t-tests were conducted to compare technical performance variables between match winners and losers (n = 31 matches). To control for multiple comparisons, a Šidák correction was applied, with a per-test significance level of p < 0.0016. Effect sizes were calculated using Cohen's d and interpreted as small (0.2), medium (0.5), and large (0.8). * Indicates statistical significance based on the Šidák-adjusted threshold.
Serving performance: Winners achieved significantly higher percentages of first serve points won (78.97% vs. 67.77%, p < .001, d = 1.13) and second serve points won (55.65% vs. 44.48%, p < .001, d = 0.96) compared with losers.
Scoring performance: Winners demonstrated superior break point conversion (43.48% vs. 24.84%, p < .001, d = 0.82), net points won (73.74% vs. 63.29%, p < .001, d = 0.84), return points won (%)(37.81% vs. 25.59%, p < .001, d = 1.33), total points (116.03 vs. 96.45, p < .001, d = 1.91), service points won (72.16% vs. 64.94%, p < .001, d = 1.05), effective return points (77.39 vs. 67.81, p < .001, d = 0.65), and return points won (40.19% vs. 28.39%, p < .001, d = 1.34) relative to losers.
Rally length performance: Winners were more successful in 0–4 shot rallies (67.71% vs. 58.13%, p < .001, d = 0.85), 5–8 shot rallies (30.68% vs. 25.10%, p < .001, d = 0.74), and 9+ shot rallies (17.68% vs. 13.23%, p < .001, d = 0.89) than losers.
Paired-samples t-tests were conducted to compare technical performance variables between match winners and losers. Variables that reached statistical significance after the Šidák adjustment (p < 0.0016) were further evaluated for multicollinearity using VIF. Only variables with VIF ≤ 5 were retained as key performance indicators for subsequent binary logistic regression analyses. These included first serve points won (VIF = 1.685), second serve points won (VIF = 1.508), break point conversion (VIF = 1.731), net points won (VIF = 1.310), and return points won (VIF = 3.328).
As shown in Table 4, Binary logistic regression was conducted to examine the predictive effects of technical variables on match outcomes at the Australian Open. Three variables were retained in the final model and reached statistical significance: return points won (B = −0.593, 95% CI: 0.347–0.880, p = .012, Exp(B) = 0.553), first serve points won (B = −0.307, 95% CI: 0.544–0.995, p = .046, Exp(B) = 0.736), and second serve points won (B = −0.344, 95% CI: 0.514–0.977, p = .035, Exp(B) = 0.709). Higher performance in these variables was associated with an increased probability of winning the match.
Overview of the predictive effects of eight technical variables on match outcomes in the men's singles event at the Australian Open using logistic regression.

Note: B = unstandardized coefficient; Exp(B) = odds ratio. The dependent variable is coded as 1 = winner and 2 = loser; therefore, a negative B indicates that higher values are associated with an increased probability of winning. * Indicates statistical significance at p < .05. Nagelkerke R² = 0.985, indicating strong model explanatory power.
The remaining two technical variables—break point conversion and net points won—did not reach statistical significance (p > .05) and were not retained in the regression model, suggesting that their predictive contribution to match outcomes was limited.
Table 5 shows the classification accuracy of the stepwise logistic regression models for Australian Open match outcomes. Overall accuracy improved across steps, reaching 95.2% in Step 3, with correctly predicted wins and losses also increasing across the steps.
Classification accuracy of logistic regression models for Australian Open match outcomes.
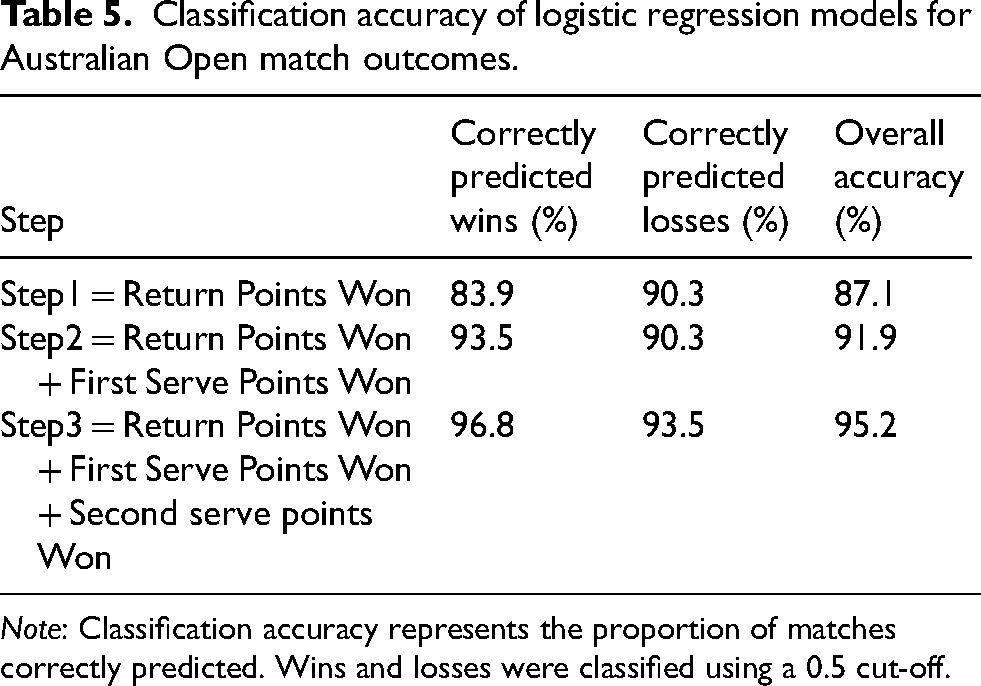
Note: Classification accuracy represents the proportion of matches correctly predicted. Wins and losses were classified using a 0.5 cut-off.
As shown in Figure 1, the ROC curve analysis for the Australian Open indicates that the three significant technical variables demonstrate good predictive ability for match outcomes. The AUC for first serve points won was 0.880 (95% CI = 0.795–0.966, p < .001), representing excellent discriminatory power. The AUC for second serve points won was 0.806 (95% CI = 0.696–0.917, p < .001), indicating good predictive performance. Return points won showed the highest discriminatory ability with an AUC of 0.939 (95% CI = 0.882–0.995, p < .001). These results further support the importance of these technical indicators in predicting match outcomes.
Differences in Technical Performance Between Winners and Losers and Predictive Overview of Match Outcomes at the French Open

ROC curves for significant technical variables in Australian Open Men's singles matches.
As shown in Table 6, paired-samples t-tests revealed multiple significant differences between winners and losers at the French Open after controlling for multiple comparisons using a Šidák correction (p < .0017).
Comparison of technical performance between winners and losers at the French Open.

Note: Paired-samples t-tests were conducted to compare technical performance variables between match winners and losers (n = 30 matches). To control for multiple comparisons, a Šidák correction was applied, with a per-test significance level of p < 0.0017. Effect sizes were calculated using Cohen's d and interpreted as small (0.2), medium (0.5), and large (0.8). * Indicates statistical significance based on the Šidák-adjusted threshold.
Serving performance: Winners achieved significantly higher percentages of first serve points won (75.73% vs. 63.17%, p < .001, d = 1.17) and second serve points won (59.63% vs. 44.57%, p < .001, d = 0.93) compared with losers.
Scoring performance: Winners demonstrated superior performance across return points won (43.80% vs. 30.03%, p < .001, d = 1.44), first serve return points won (36.87% vs. 24.30%, p < .001, d = 1.17), second serve return points won (55.47% vs. 40.40%, p < .001, d = 0.93), break point opportunities (11.33% vs. 5.07%, p < .001, d = 1.04), break point conversion (49.90% vs. 30.10%, p < .001, d = 0.70), breakable games ratio (44.87% vs. 19.77%, p < .001, d = 1.33), total points (116.73 vs. 94.23, p < .001, d = 2.11) compared with losers.
Winners and Errors: Winners scored significantly more winners (39.53 vs. 31.50, p < .001, d = 0.70), committed fewer unforced errors (30.83 vs. 41.17, p < .001, d = −0.82), and achieved more zero-lose games (3.73 vs. 1.83, p < .001, d = 0.83) than losers.
Rally length performance: Winners were more successful in 1–4 shot rallies (70.03% vs. 56.20%, p < .001, d = 1.41), 5–8 shot rallies (30.57% vs. 25.70%, p < .001, d = 0.66), and 9 + shot rallies (16.10% vs. 12.27%, p < .001, d = 0.70).
Paired-samples t-tests were conducted to compare technical performance variables between match winners and losers. Variables that reached statistical significance after the Šidák adjustment (p < 0.0017) were further evaluated for multicollinearity using variance inflation factors (VIF). Only variables with VIF ≤ 5 were retained as key performance indicators for subsequent binary logistic regression analyses. These included first serve points won (VIF = 2.284), second serve points won (VIF = 2.014), Break Point Conversion (VIF = 2.500), winners (VIF = 4.596), unforced errors (VIF = 4.068), zero-lose games (VIF = 3.208), 1–4 shot rallies (VIF = 4.033), 5–8 shot rallies (VIF = 3.839), and 9+ shot rallies (VIF = 2.526).
As shown in Table 7, binary logistic regression was conducted to examine the predictive effects of technical variables on match outcomes at the French Open. Three variables were retained in the final model and reached statistical significance: first serve points won (B = −0.321, 95% CI: 0.587–0.897, p = .003, Exp(B) = 0.726), second serve points won (B = −0.263, 95% CI: 0.636–0.928, p = .006, Exp(B) = 0.769), and Break Point Conversion (B = −0.071, 95% CI: 0.881–0.984, p = .011, Exp(B) = 0.931). Higher performance in these variables was associated with an increased probability of winning the match.
Summary of binary logistic regression analysis of eight technical variables predicting match outcomes in men's singles at the French Open.

Note: B = unstandardized coefficient; Exp(B) = odds ratio. The dependent variable is coded as 1 = winner and 2 = loser; therefore, a negative B indicates that higher values are associated with an increased probability of winning. * Indicates statistical significance at p < .05. Nagelkerke R² = 0.829, indicating strong model explanatory power.
The remaining six technical variables—winners, unforced errors, zero-lose games, and 1–4/5–8/9+ shot rallies—did not reach statistical significance (p > .05) and were not retained in the regression model, suggesting that their predictive contribution to match outcomes was limited.
Table 8 shows the classification accuracy of the stepwise logistic regression models for French Open match outcomes. Overall accuracy improved across steps, reaching 90% in the final model.
Classification accuracy of logistic regression models for French Open match outcomes.

Note: Classification accuracy represents the proportion of matches correctly predicted. Wins and losses were classified using a 0.5 cut-off.
As shown in Figure 2, the ROC curve analysis for the French Open indicates that the three significant technical variables demonstrate good predictive ability for match outcomes. The area under the curve (AUC) for first serve points won was 0.861 (95% CI = 0.771–0.950, p < .001), representing excellent discriminatory power. The AUC for second serve points won was 0.854 (95% CI = 0.761–0.946, p < .001), indicating similarly strong predictive performance. Break point conversion showed moderate discriminatory ability with an AUC of 0.770 (95% CI = 0.647–0.893, p < .001). These results further support the importance of these technical indicators in predicting match outcomes.
Differences in Technical Performance Between Winners and Losers at Wimbledon and Overview of Match Outcome Prediction

ROC curves for significant technical variables in French Open Men's singles matches.
As shown in Table 9, paired-samples t-tests revealed multiple significant differences between winners and losers at the Wimbledon Championships after controlling for multiple comparisons using a Šidák correction (p < .0030).
Comparison of technical performance between winners and losers at the Wimbledon championships.
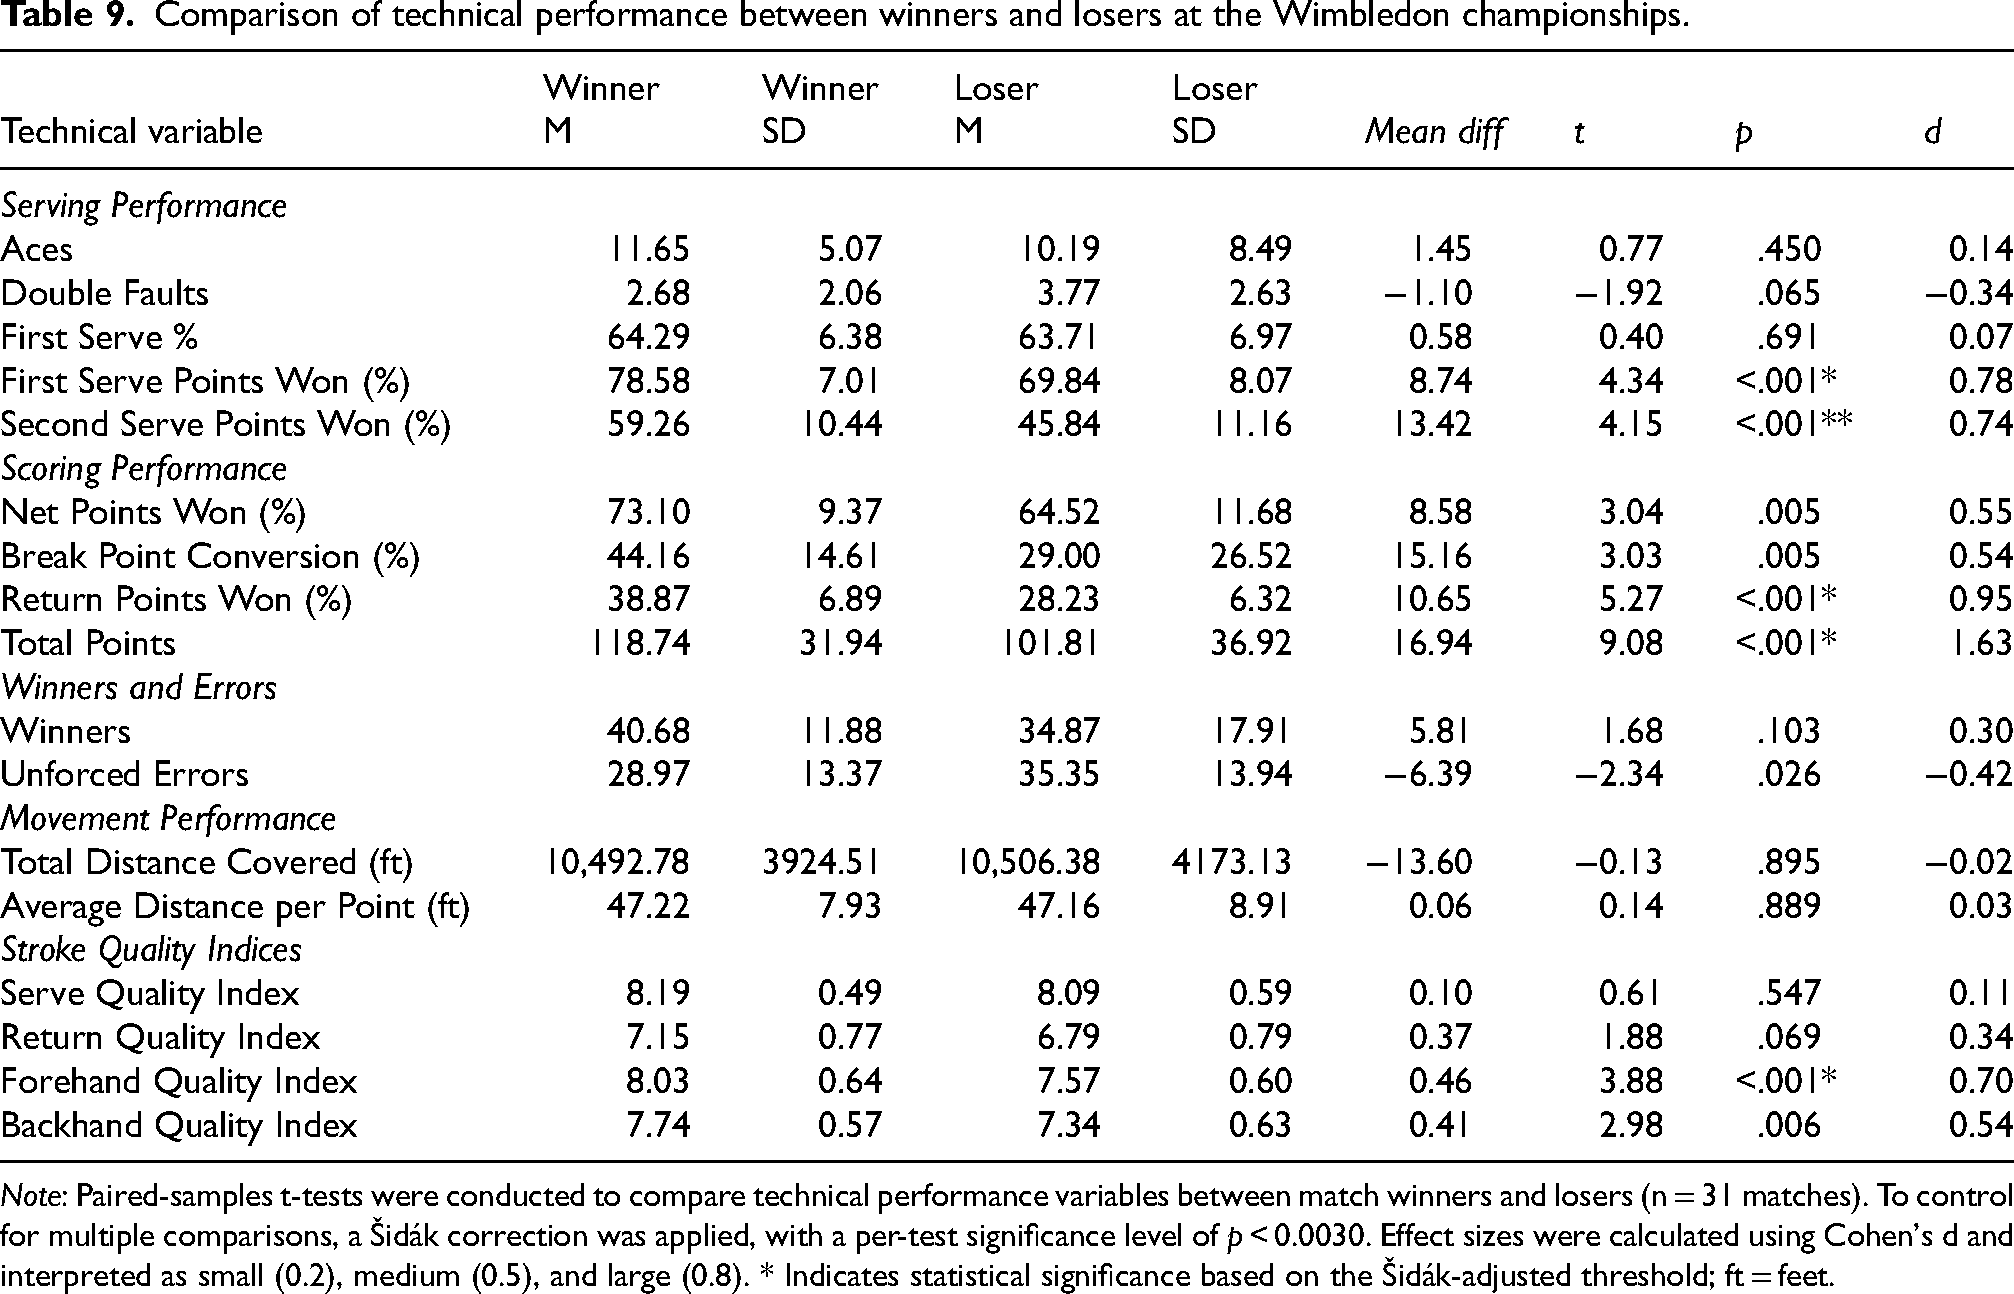
Note: Paired-samples t-tests were conducted to compare technical performance variables between match winners and losers (n = 31 matches). To control for multiple comparisons, a Šidák correction was applied, with a per-test significance level of p < 0.0030. Effect sizes were calculated using Cohen's d and interpreted as small (0.2), medium (0.5), and large (0.8). * Indicates statistical significance based on the Šidák-adjusted threshold; ft = feet.
In Serving Performance, winners achieved higher first serve points won (78.58% vs. 69.84%, p < .001, d = 0.78) and second serve points won (59.26% vs. 45.84%, p < .001, d = 0.74), while other serving variables did not reach statistical significance. In Scoring Performance, winners outperformed losers in return points won (38.87% vs. 28.23%, p < .001, d = 0.95), and total points (118.74 vs. 101.81, p < .001, d = 1.63). In Stroke Quality Indices, winners demonstrated higher forehand quality index (8.03 ± 0.64 vs. 7.57 ± 0.60, p < .001, d = 0.70). Winners and Errors, Movement performance variables did not show significant differences between winners and losers.
Paired-samples t-tests were conducted to compare technical performance variables between match winners and losers. Variables that reached statistical significance after the Šidák adjustment (p < 0.0030) were further evaluated for multicollinearity using variance inflation factors (VIF). Only variables with VIF ≤ 5 were retained as key performance indicators for subsequent binary logistic regression analyses. These included first serve points won (VIF = 1.454), second serve points won (VIF = 2.004), Return Points Won (VIF = 1.924), Total Points (VIF = 1.199), Forehand Quality Index (VIF = 1.205).
As shown in Table 10, binary logistic regression was conducted to examine the predictive effects of technical variables on match outcomes at the Wimbledon. Three variables were retained in the final model and reached statistical significance: first serve points won (B = −0.326, 95% CI: 0.572–0.909, p = .006, Exp(B) = 0.721), second serve points won (B = −0.237, 95% CI: 0.662–0.940, p = .008, Exp(B) = 0.789), and return points won (B = −0.583, 95% CI: 0.382–0.815, p = .003, Exp(B) = 0.558). Higher performance in these variables was associated with an increased probability of winning the match.
Summary of binary logistic regression analysis of seven technical variables predicting match outcomes in men's singles at the Wimbledon championships.

Note: B = unstandardized coefficient; Exp(B) = odds ratio. The dependent variable is coded as 1 = winner and 2 = loser; therefore, a negative B indicates that higher values are associated with an increased probability of winning. * Indicates statistical significance at p < .05. Nagelkerke R² = 0.858, indicating strong model explanatory power.
The remaining technical variables—total points and forehand quality index—did not reach statistical significance (p > .05) and were not retained in the regression model, suggesting that their predictive contribution to match outcomes was limited.
Table 11 shows the classification accuracy of the stepwise logistic regression models for Wimbledon Championships match outcomes. Overall accuracy improved across steps, reaching 93.5% in Step 3, with correctly predicted wins and losses also increasing across the steps.
Classification accuracy of logistic regression models for Wimbledon championships match outcomes.

Note: Classification accuracy represents the proportion of matches correctly predicted. Wins and losses were classified using a 0.5 cut-off.
As shown in Figure 3, the ROC curve analysis for Wimbledon indicates that the three significant technical variables demonstrate good predictive ability for match outcomes. The area under the curve (AUC) for first serve points won was 0.794 (95% CI = 0.685–0.904, p < .001), representing moderate to good discriminatory power. The AUC for second serve points won was 0.837 (95% CI = 0.734–0.939, p < .001), indicating good predictive performance. Return points won showed the highest discriminatory ability with an AUC of 0.915 (95% CI = 0.845–0.984, p < .001). These results further support the importance of these technical indicators in predicting match outcomes.

ROC curves for significant technical variables in Wimbledon Men's singles matches.
Differences in technical performance among champions at the Australian Open, French Open, and Wimbledon championships
Descriptive analyses were conducted for 11 technical variables commonly available across the three Grand Slam tournaments, focusing on the champions of the Australian Open (Jannik Sinner), French Open (Carlos Alcaraz), and Wimbledon (Jannik Sinner), as summarized in Table 12.
Descriptive technical performance of champions across the three Grand Slam tournaments.

Note: M = mean; SD = standard deviation. Values represent the average match statistics of the tournament champion in each Grand Slam event.
Across the three tournaments, champions demonstrated consistently strong performance in serving and returning. For serving-related variables, the mean number of aces ranged from 4.0 at the French Open to 8.4 at Wimbledon, while double faults remained low across tournaments (2.0–3.2). First serve percentage varied from 59.4% (Australian Open) to 66.8% (French Open), with first serve points won ranging from 71.0% to 81.6% and second serve points won between 59.0% and 65.6%.
In scoring-related variables, net points won and break point conversion rates were generally high and comparable across tournaments. Return points won ranged from 39.2% to 43.0%, and total points per match varied from 96.8 at Wimbledon to 133.2 at the French Open.
Within the winners and errors category, the number of winners showed the most notable variation, with the French Open champion producing the highest mean (48.0) compared to the Australian Open (30.4) and Wimbledon (34.8). Unforced errors were relatively similar across tournaments, ranging from 25.2 to 42.8.
Overall, these descriptive results indicate that champions maintain consistently high levels of technical performance across Grand Slam tournaments. Variations observed in specific variables, such as the number of winners, may reflect differences in surface characteristics and playing strategies, such as the slower clay courts at the French Open facilitating more aggressive shot-making. These observations are intended as descriptive insights, given the small sample size and repeated inclusion of one player (Jannik Sinner).
Discussion
The influence of court surface characteristics on technical variables predicting match outcomes in the three Grand Slam tournaments
An in-depth examination of technical performance in men's singles matches from the round of 32 to the final across the three Grand Slam tournaments was conducted, focusing on the relationship between court surface characteristics and technical variables associated with match outcomes. The results indicate that at the Australian Open, winners exhibited significantly superior performance in a substantial proportion of serving- and scoring-related technical variables compared to losers. Many of these scoring advantages were associated with return performance, indirectly highlighting the critical influence of serve and return effectiveness on match outcomes at the Australian Open (Gao et al., 2024).
Regarding rally length, winners achieved significantly higher scoring proportions across short, medium, and long rallies. These findings suggest that winners effectively combined tactical planning with technical execution to gain an advantage during rallies, enabling aggressive shot-making and point accumulation. Consequently, on hard courts, scoring strategies across all rally lengths appear to play a pivotal role in determining match outcomes (Carboch et al., 2019; Gao et al., 2024). Effect sizes ranged from small to large (Cohen's d 0.2–1.3), suggesting that some differences, particularly in first serve points won and return points won, are not only statistically significant but also practically meaningful.
In contrast, at the French Open, winners demonstrated significant advantages across all return-related scoring variables, whereas among serving-related metrics, only first and second serve points won reached statistical significance. This pattern emphasizes the strategic importance of return play on clay courts (Raizada et al., 2025). Notably, winners scored significantly more points in 1–4 shot rallies (70.03% vs. 56.20%), likely reflecting the adoption of aggressive tactical patterns. Significant differences were also observed in winners and unforced errors, indicating that, despite the slower bounce and longer rally potential on clay, successful players were able to employ forward-moving offensive strategies to control points and exert considerable pressure on their opponents (Gallagher et al., 2021; Takahashi et al., 2022). Effect sizes for key return-related metrics ranged from medium to large (Cohen's d 0.5–1.2), highlighting their practical relevance.
Serve and return performance remain critical determinants of match outcomes, as evidenced by Wimbledon data. In particular, break point conversion (15.16% higher for winners) and return points won (10.64% higher for winners) both exceeded a 10% difference, demonstrating that while serve performance is important on grass courts, strategic return play and the ability to capitalize on break opportunities are even more decisive in influencing match results (Fitzpatrick et al., 2024b). Furthermore, the significant difference in the forehand quality index reinforces the role of shot spin and velocity in disrupting opponents’ stability during rallies, enabling winners to execute aggressive play and accumulate points efficiently in short rallies (Gupta et al., 2025; Söğüt, 2019).
From a predictive standpoint, first serve points won, second serve points won, and return points won were consistently significant predictors at the Australian Open and Wimbledon. Effect sizes for these variables ranged from medium to large (Cohen's d 0.8–1.3), suggesting that these differences are not only statistically significant but also practically meaningful. At the French Open, first and second serve points won, along with break point conversion, were the key predictive variables. These findings suggest that improving serve and return efficiency can substantially reduce the likelihood of defeat in hard and grass court tournaments. On clay courts, while return points may not always reach significance, effectively capitalizing on break-point opportunities can positively influence overall match outcomes. It should be noted, however, that logistic regression models were built on a relatively small number of matches per tournament, and their predictive performance may vary when applied to other seasons or different player populations. Integrating strategic planning with technical execution, enhancing shot quality, and creating more offensive opportunities not only increases scoring efficiency but also minimizes the probability of match loss (Carboch et al., 2019; Gupta et al., 2025; Takahashi et al., 2022).
It is important to note, however, that some of these predictors are inherently linked to the tennis scoring system. For example, winning a higher proportion of return points directly contributes to winning games and matches. As a result, the very high model fit observed across tournaments largely reflects this structural relationship rather than providing entirely novel predictive insights.
Technical performance characteristics and practical implications of Grand Slam champions
Grand Slam champions are the ultimate winners who excel across the most prestigious tournaments. Based on the present study, key technical factors contributing to championship success on different court surfaces were examined. The findings indicate that champions consistently demonstrated exceptional performance in both serving and returning. Notably, the number of winners differed between the French Open (48.00) and Australian Open (30.40), suggesting that champions exploit the slower bounce of clay courts by adopting forward-moving offensive strategies to increase winner production and maintain control during rallies.
Descriptive statistics of Grand Slam champions (Table 12) indicate variation in technical performance across tournaments. At the French Open, Carlos Alcaraz recorded a higher number of winners compared with the Australian Open and Wimbledon champions, consistent with patterns reported for clay-court play (Gillet et al., 2009; Raizada et al., 2025). Jannik Sinner's match statistics at the Australian Open and Wimbledon show relatively high first and second serve points won, as well as consistent return performance across surfaces, reflecting observations from prior analyses of elite player adaptability (Fitzpatrick et al., 2024b; Gao et al., 2024; Vaverka et al., 2018). These data illustrate differences in champion performance characteristics without inferring causality or superiority.
The perspectives discussed above validate the findings of the present study. Analyses of match outcomes from the round of 32 to the finals, together with examinations of champion-level performance, illustrate the relationship between key technical variables required at each stage and different court surface characteristics. The results also demonstrate how the integration of technical proficiency with surface-specific stability contributes to factors underlying match success. By leveraging high-intensity match data from the latter stages of tournaments, this study generates strategically valuable insights that can effectively enhance technical performance.
Practical applications and future research directions
The findings of this study provide practical insights for coaches, performance analysts, and elite tennis players. Understanding surface-specific performance patterns can guide the design of training programs and tactical strategies tailored to hard, clay, and grass courts. For example, clay-court preparation may focus on rally endurance and consistent point construction, while hard and grass courts may require emphasis on serve effectiveness and efficient short-point play.
Regarding future research, studies could examine multiple seasons of Grand Slam tournaments to assess whether these surface-specific patterns remain consistent over time. Additional contextual variables, such as player ranking, match status, or situational pressure, could be incorporated to deepen understanding of match outcomes. Furthermore, integrating advanced tracking data and spatial metrics may provide more detailed insights into tactical adaptations across different surfaces, ultimately informing evidence-based performance strategies at the elite level.
Conclusion
This study examined technical performance from the round of 32 to the final stages of the 2025 Australian Open, French Open, and Wimbledon Championships, focusing on the influence of court surface characteristics on match outcomes and the identification of key predictive technical variables. The results indicate that, regardless of surface type, first serve points won and second serve points won consistently functioned as critical predictors of match outcomes. Additionally, return points won played a particularly influential role at the Australian Open and Wimbledon, while break point conversion was especially relevant at the French Open, indirectly highlighting that superior serving and returning abilities constitute the most decisive factors for success across the three Grand Slam tournaments.
Descriptive analysis of champions’ performance shows that more winners were recorded on the slower clay courts of the French Open, whereas the Australian Open and Wimbledon champions had different distributions of technical variables.
Overall, by adopting court surface characteristics and match outcomes as an analytical framework, this study confirms that technical performance variables are significantly influenced by surface conditions. In the high-intensity environment of Grand Slam tournaments, the consistent execution of effective serving and returning substantially enhances winning probability, representing a critical determinant of competitive success.
Footnotes
Funding
The authors received no financial support for the research, authorship, and/or publication of this article.
Declaration of conflicting interests
The authors declared no potential conflicts of interest with respect to the research, authorship, and/or publication of this article.