
Abstract
This study explores the feasibility of an Expected Points metric for rugby union, aiming to shift performance analysis from descriptive indicators to a predictive metric of possession quality. Notational analysis was conducted on 132 Premiership Rugby matches, producing a dataset of 35,199 unique phases of play containing variables such as team in possession, pitch location, play type, score differences, time remaining and scoring outcomes. Four machine learning algorithms were explored to predict scoring outcomes: multinomial logistic regression, random forest, support vector machine and k-nearest neighbors. After extensive feature engineering and hyperparameter optimisation, the best-performing model achieved 39.7% accuracy, below a literature-derived baseline for practical usability (44.3%), making it unsuitable for applied contexts. A key challenge was predicting minority scoring outcomes due to severe class imbalance. SMOTE was explored to address this imbalance, resulting in a lower accuracy (35.7%) but an improved 34.4% F1-score. This study highlights the limitations of modelling scoring outcomes in open-play team sports, challenging the predominant positivist paradigm in sports performance analysis. The methodology provides critical foundational groundwork and a benchmark for future research to build upon. It recommends exploring advanced samplers for minority classes, expanded feature sets and alternative modelling techniques, such as recurrent neural networks.
Keywords
Introduction
The analysis of performance in invasion team sports begins with assessing the successful execution of individual plays (Yurko et al., 2019). Conventional studies have approached this problem by relying on descriptive methods to establish key determinants of success and draw generalised conclusions on which on-pitch actions are most influential to winning (Bremner et al., 2013; James et al., 2005). A common methodology has been narrowing down multiple performance factors into a concise set of key performance indicators with strong associations to scoring or winning matches, such as territory gained (Hunter and O’Donoghue, 2001), attacking and defensive profiles (Hendricks et al., 2013), set piece outcomes (Jones et al., 2004) or tackling success (Hughes et al., 2012).
However, reducing rugby union analysis to isolated measures oversimplifies the complexity of human behaviour in sports, as it assumes linear and predictable outcomes from simple cause-and-effect observations (Colomer et al., 2020). This descriptive approach fails to account for situational context. For example, a 10-metre carry may hold different value if performed at a team’s own 22-metre line or the opponent’s 22-metre line. Therefore, establishing success factors using descriptive methods on, for instance, carries (Bishop and Barnes, 2013) or metres gained (Watson et al., 2017), in isolation conflates explanatory power with true predictive capability (Shmueli, 2010).
This paradigm has resulted in poor generalisability and inconsistent results, causing a profound lack of scientific consensus, with over 392 unique performance indicators identified in the literature (Colomer et al., 2020). This reflects the absence of a common framework capable of capturing how complex interactions between performance indicators in a given situation influence match outcomes. Identifying success determinants in the sport may first require the quantification of the expected situational value of match scenarios. Predictive modelling may bring research in rugby union a step closer to that goal. However, over the last two decades, rugby union has lagged behind other sports in the application of contemporary data analytics methods, with 80% of published articles omitting these critical contextual considerations (Colomer et al., 2020).
This methodological challenge has been exacerbated by issues with data accessibility. Unlike sports like American football, where organisations like the National Football League (NFL) publish vast, free play-by-play datasets (Romer, 2006), major rugby bodies have not offered similarly detailed records. Researchers are therefore forced to rely on time-consuming manual notational analysis from match footage (Bremner et al., 2013; Vahed et al., 2016). This has restricted studies to small sample sizes, averaging 67
Sports such as American football (Romer, 2006; Yurko, 2017) or rugby league (Kempton et al., 2016) have recognised this methodological limitation and progressed by developing standardised metrics to account for contextual factors influencing performance. These efforts, supported by the vast publicly and commercially available data in these sports, have resulted in the development of an Expected Points metric. Expected Points assigns a singular points value to each game scenario. This value is derived from the probabilities of all possible scoring outcomes (and their associated point values) occurring next, given the current play’s context (Burke, 2008; Carter and Machol, 1971).
Carter and Machol (1971) introduced the concept of Expected Points in American football by analysing 8,373 plays from 56 games of the 1969 NFL season to quantify possession value at specific field locations. Expected Points were calculated by adding the products of each possible scoring outcome’s true value and its probability of occurrence, expressed as
The theoretical framework established by Carter and Machol (1971) on Expected Points methodology in American football inspired numerous subsequent studies to expand on this foundational work and improve the scientific rigour of its calculation (Goldner, 2017; Romer, 2006). It also gained traction beyond academia, extending to NFL clubs, media and its fan base (Causey, 2015). Burke (2008) popularised the concept of average net point advantage through their website Advanced Football Analytics, challenging conventional performance metrics by arguing that the value of performance metrics is relative to field position.
The proliferation of Expected Points across American football literature produced several approaches for deriving expected values, such as dynamic programming (Romer, 2006), absorbing Markov chain models (Goldner, 2017), bootstrapping (Causey, 2015), linear regression (Burke, 2008) and logistic regression (Yurko, 2017). Adaptations of the Expected Points metric also emerged. Burke (2010) developed Expected Points Added (EPA) to quantify the change in Expected Points between plays and assess their effectiveness. Katz and Burke (2016) also developed positional, player-level EP metrics by distributing EPA among all players involved in a play, including a Total Quarterback Rating (QBR). Expected Points research also ventured into other sports, such as rugby league (Kempton et al., 2016), ice hockey (Thomas, 2006), basketball (Cervone et al., 2016), Australian rules football (O’Shaughnessy, 2006) and association football (Green, 2012).
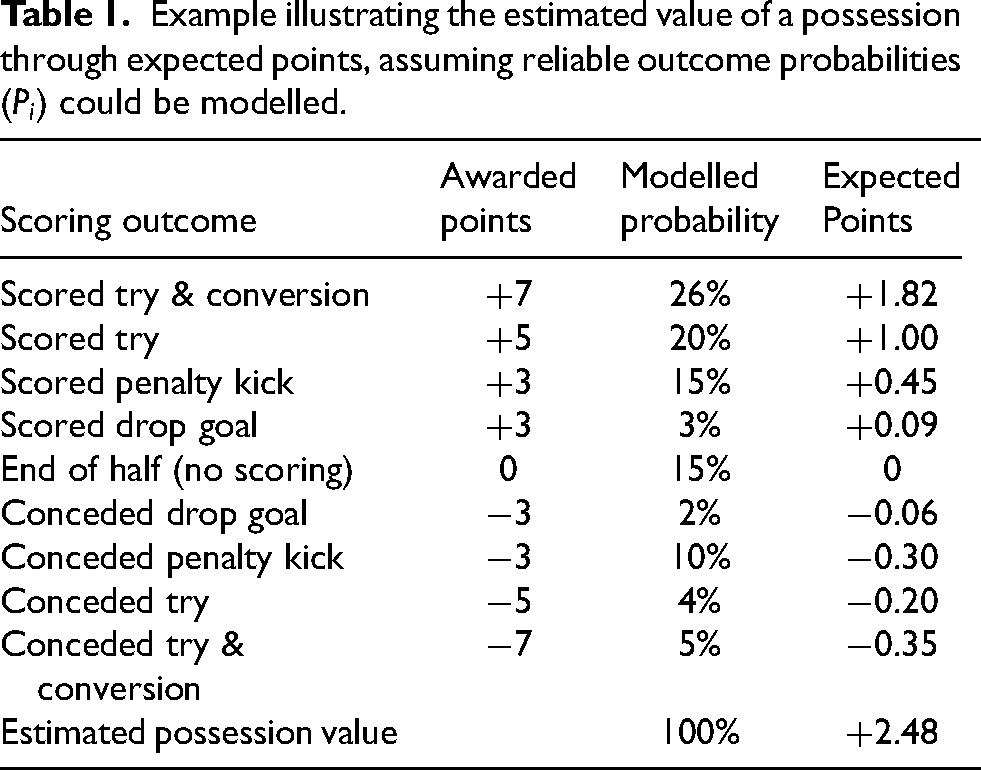
Despite its similarities with other invasion team sports, rugby union has yet to fully embrace model-based analytical approaches prevalent in the NFL and rugby league. The primary aim of this study is to explore the extension of the Expected Points framework to rugby union, assessing its feasibility and practicality. It builds on the hypothesis originating from NFL studies (Burke, 2008; Carter and Machol, 1971; Yurko et al., 2019) that the development of a model that reliably estimates the points value of any given match situation has the potential to change the way rugby union is analysed and understood. As illustrated in Table 1, this approach assigns a quantifiable points value to each unique match situation by multiplying the points awarded from each scoring method (e.g., +3 points for a scored penalty kick) by their modelled probability. The aggregation of all these products represents the overall estimated points value for that specific match situation.
Example illustrating the estimated value of a possession through expected points, assuming reliable outcome probabilities (
This study represents a foundational proof-of-concept for the feasibility of reliably deriving such probabilities. The objective is not to deliver a deployable Expected Points metric but to rigorously document the methodological process, establish a performance benchmark and transparently identify the primary obstacles to creating such a model for rugby union. The aim is to provide the critical groundwork that will guide future research in the shift of the research paradigm in sports performance analysis in rugby union from descriptive statistical methods to predictive modelling techniques (Shmueli, 2010).
The successful development of an Expected Points metric in rugby union has the potential to provide practitioners with a standardised, universally interpretable framework to benchmark performance, enabling consistent evaluations and coherent comparisons of possession value across teams and match scenarios. The quantification of scoring probabilities across a range of contextual factors could help coaches adapt tactics, exploit opponent weaknesses, prioritise specific strategies and make more informed decisions on play selection. The analysis of Expected Points fluctuations between plays could indicate how a team’s actions affect their scoring chances. Coaching practices could be informed by a detailed evaluation of a team’s over- or under-performance relative to the Expected Points value of particular contexts. Player performance analysis could also gain greater consistency with the evaluation of individual actions based on their relative contribution to the team’s overall Expected Points.
The development process of Expected Points in rugby union presented in this study also aims to provide transparency and reproducibility of its methodology to inspire future sports performance analysis research. Previous Expected Points studies have lacked comprehensive explanations of their statistical methodologies (Carter and Machol, 1971) or have failed to share model performance evaluations necessary to demonstrate the generalisability of results (Romer, 2006; Yurko, 2017). This study aims to overcome such gaps by presenting a detailed account of data pre-processing (Kotsiantis et al., 2006), feature engineering (Zheng and Casari, 2018), hyperparameter optimisation (Feurer and Hutter, 2019), cross-validation (Kohavi, 1995) and model performance evaluation processes (Powers, 2020).
Methods
Participants
Event-level data for 35,199 phases of play was collected through the notational analysis of all 132 matches played during the 2018/19 English Premiership Rugby season. Twelve rugby union clubs competed in the round-robin competition, playing each opposing team twice over 22 rounds. This match sample was 95% larger than the mean sample size (67 matches) reported in rugby union literature (Colomer et al., 2020), and also exceeded the 8,373 plays analysed by Carter and Machol (1971) and 11,112 by Romer (2006) in early NFL Expected Points studies.
Data collection
Full match video recordings were analysed using Sportscode Elite (Version 10, Hudl, Nebraska, United States) by notating key data points at every breakdown and start of play. Full match video recordings were obtained from publicly available broadcasts. The use of this footage for notational analysis falls under fair dealing principles for non-commercial research purposes. The operational definitions in Table 2 ensured the validity and reliability of the descriptive variables notated (Williams, 2012). These definitions were cross-validated using the existing literature, such as the Rugby Union Video Analysis Consensus publication by Hendricks et al. (2020). Descriptive variables included phase sequence number, team in possession, pitch location, play type, match score, points difference, match clock and disciplinary cards.
Operational definitions of data variables.
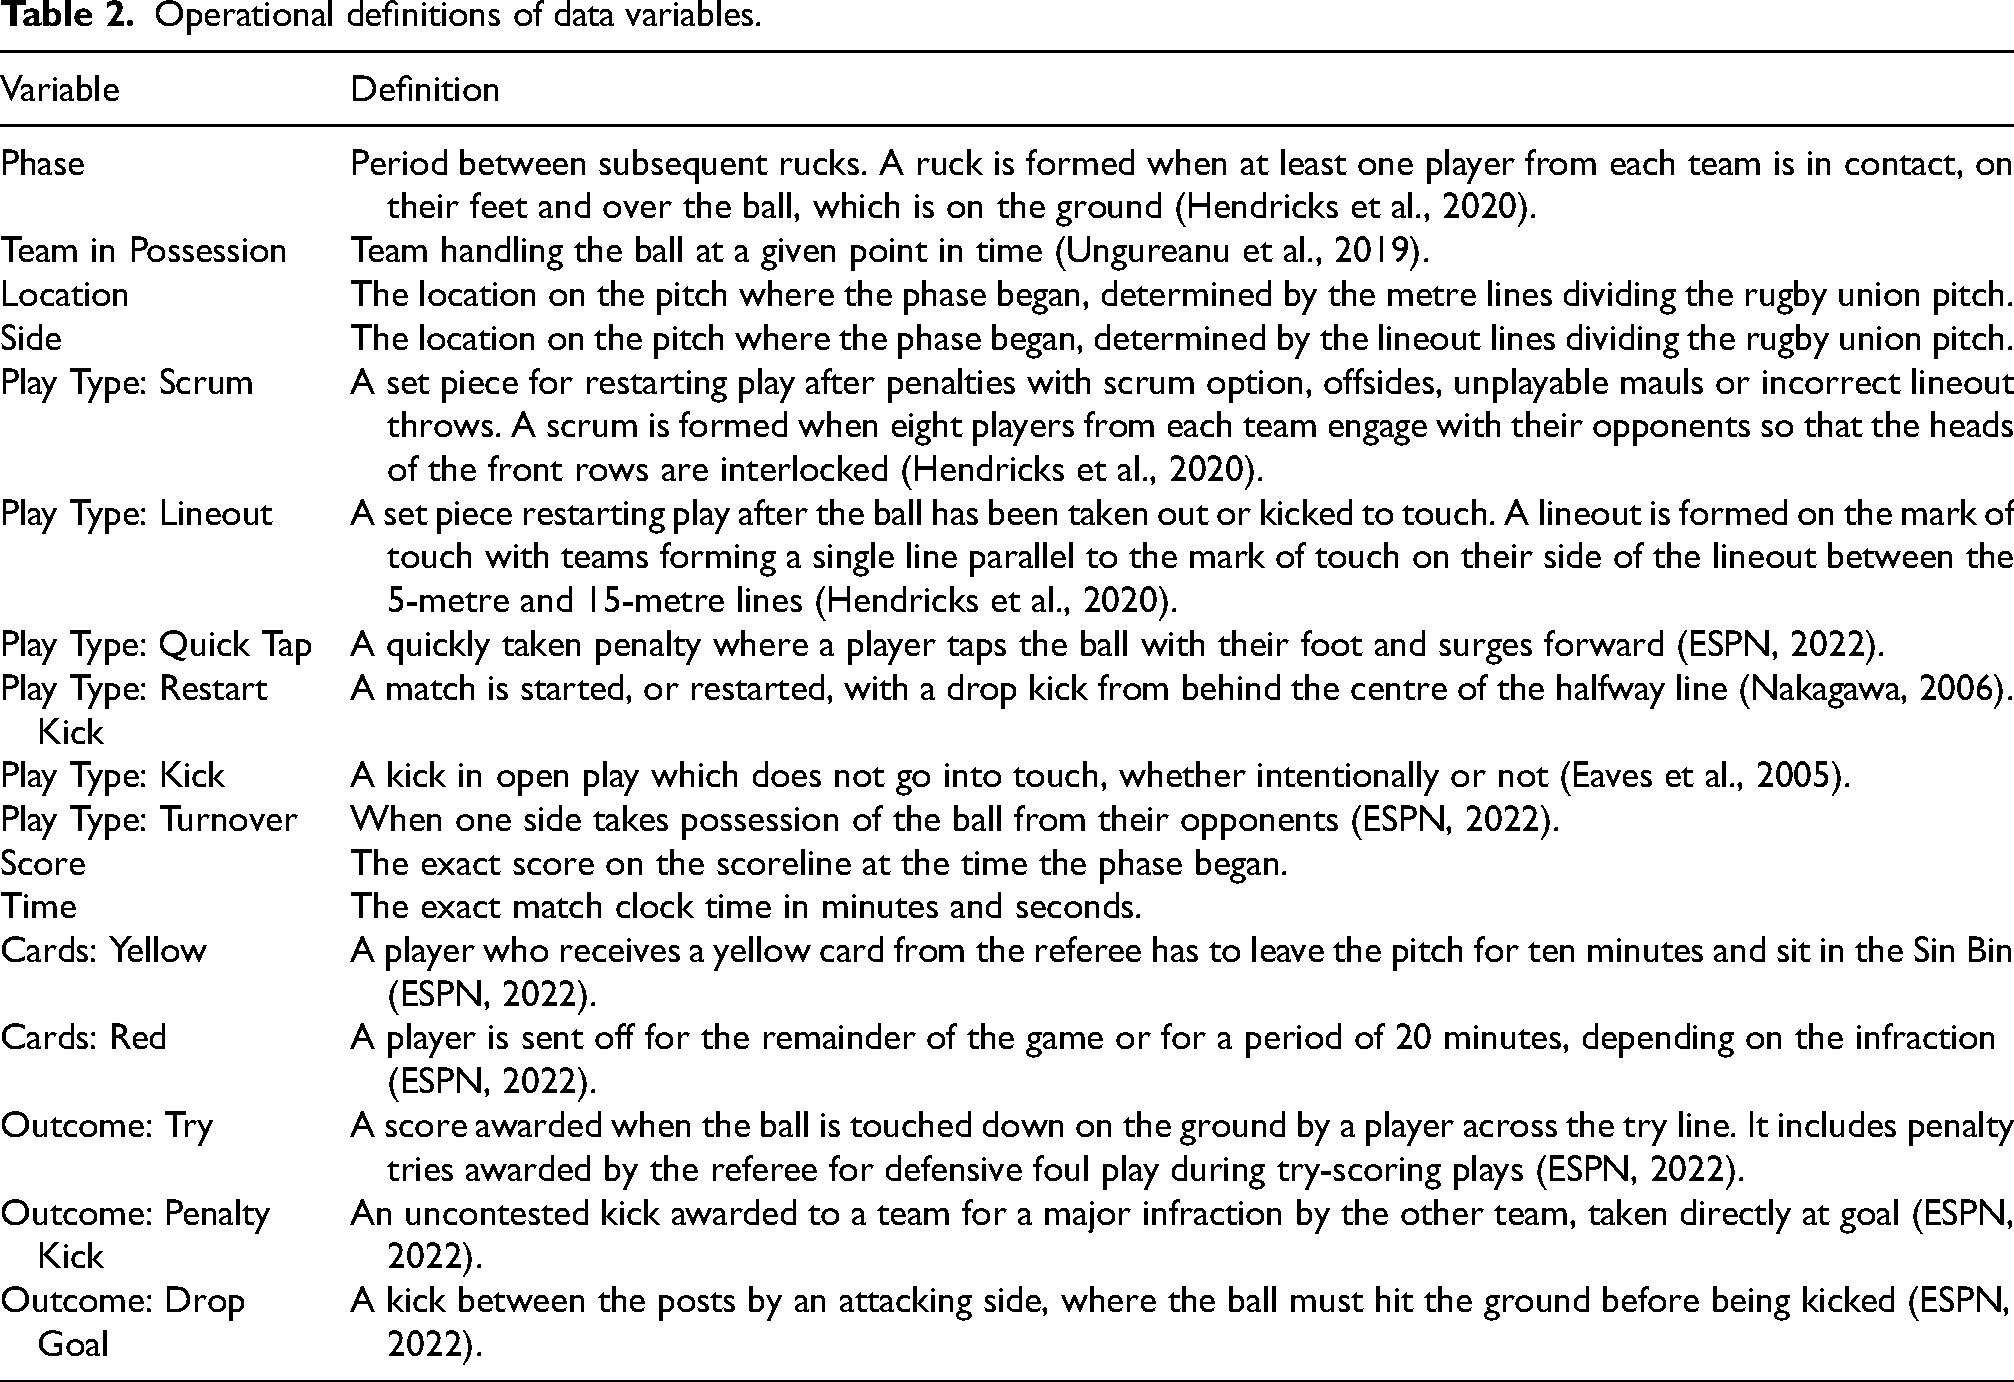
Each notation corresponded to an individual phase of play, defined as the instance when the scrum-half retrieved the ball from the breakdown to begin a new phase. For scenarios that did not begin from a breakdown (e.g., match start, set pieces or turnovers), each data point reflected the moment the ball was first collected by the new team in possession. Upon scoring, the event (e.g., tries, penalty kicks, drop goals or end of the half) was assigned to all phases since the previous scoring event. Phases by the scoring team were labelled with the positive scoring outcome (e.g, scored try), while those by the conceding team were attributed the opposite outcome (e.g, conceded try).
Due to the possibility of observational errors, notational analysis was repeated on 13 randomly selected matches representing 10% of the dataset to test intra-observer and inter-observer reliability (O’Donoghue, 2007). Intra-observer reliability testing indicated high consistency, with a percentage error of 1.4%. Inter-observer reliability also produced an acceptable error rate of 4.42% and a kappa coefficient of 0.907 (95% CI: 0.902–0.912, p-value
Data analysis
Analysis was conducted using the programming language Python (Python Software Foundation, Python Language Reference, version 3.10). Python scripts were written in Google Colaboratory (Google LLC, Mountain View, California), a cloud-based Jupyter notebook service (Kluyver et al., 2016). The dataset was exported as a comma-separated values file from Sportscode Elite and imported into Google Colaboratory for exploratory data analysis, data pre-processing, model training and model performance evaluation.
Exploratory analysis and preliminary modelling
Initial exploratory data analysis primarily assessed the distribution of scoring outcomes to identify any bias or skewness, as class imbalance could increase the likelihood of classification errors (Japkowicz and Stephen, 2002). The analysis showed class imbalance with 25.8% of phases leading to converted tries, while drop goals (both scored and conceded) only accounted for less than 0.1% of phases (see Figure 1). Moreover, penalty kicks were scored in 19.1% of phases and conceded in 13.2%.
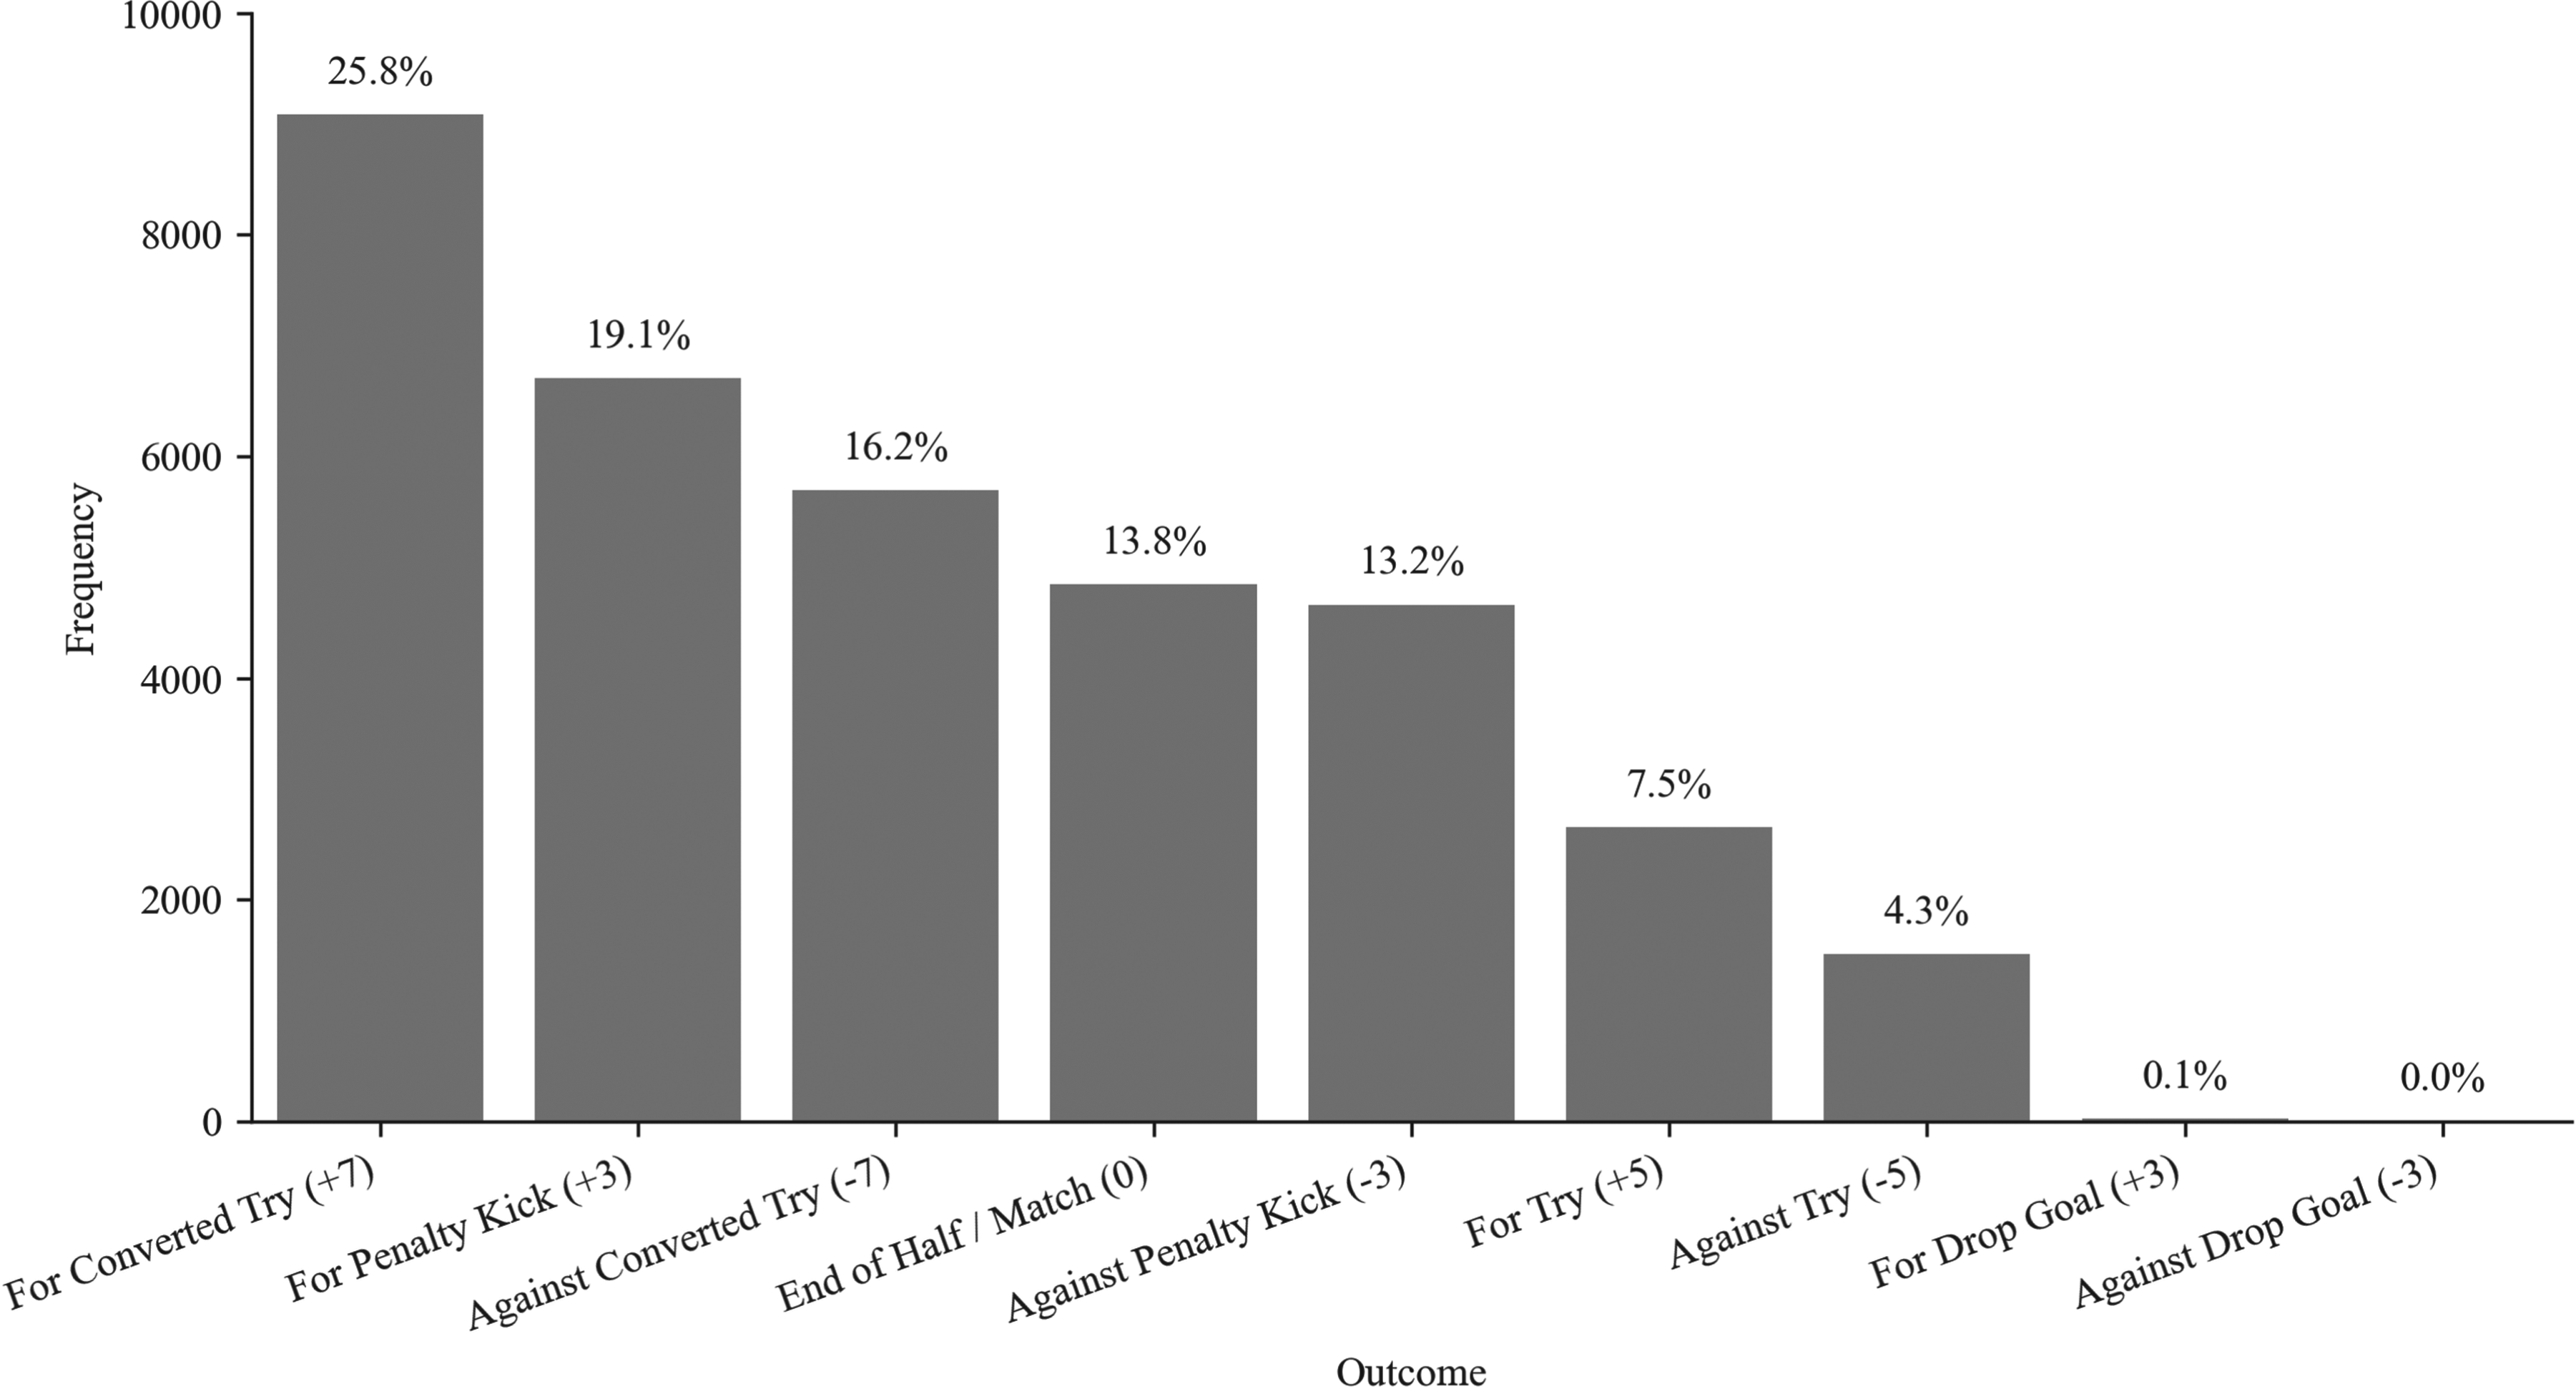
Frequencies of different scoring outcomes showing an imbalanced dataset.
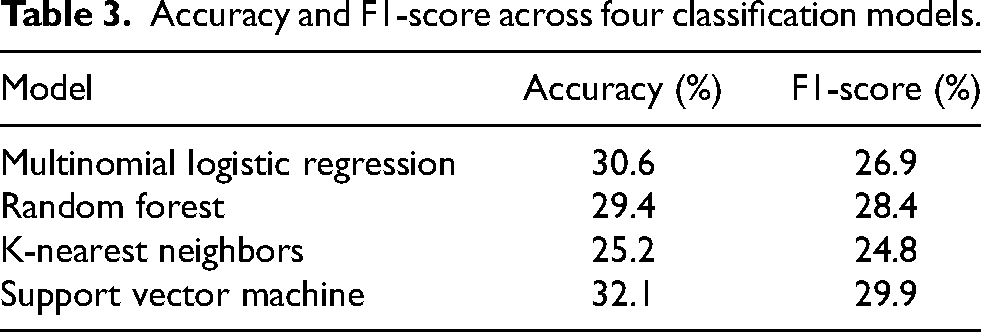
Preliminary modelling conducted using default hyperparameter configurations from Scikit-Learn (Pedregosa et al., 2011) showed comparable results across models (Table 3). The support vector machine (SVM) achieved the highest accuracy (32.1%) and F1-score (29.9%), while the other models performed similarly, with accuracies ranging from 25.2% (k-nearest neighbors) to 30.6% (multinomial logistic regression). A key observation was the substantial model bias towards predicting majority classes, such as tries scored and the end of the half, impacting both precision and recall across all outcomes.
Accuracy and F1-score across four classification models.
Feature engineering
Following preliminary observations, the rugby union dataset was refactored to improve predictive power. Tries with and without conversions were consolidated, and phases leading to drop goals were also excluded due to their rarity (0.1% of phases). As shown in Figure 2, these changes reduced class imbalance, with the imbalance ratio increasing from 0.17 to 0.40 (He and Garcia, 2009).
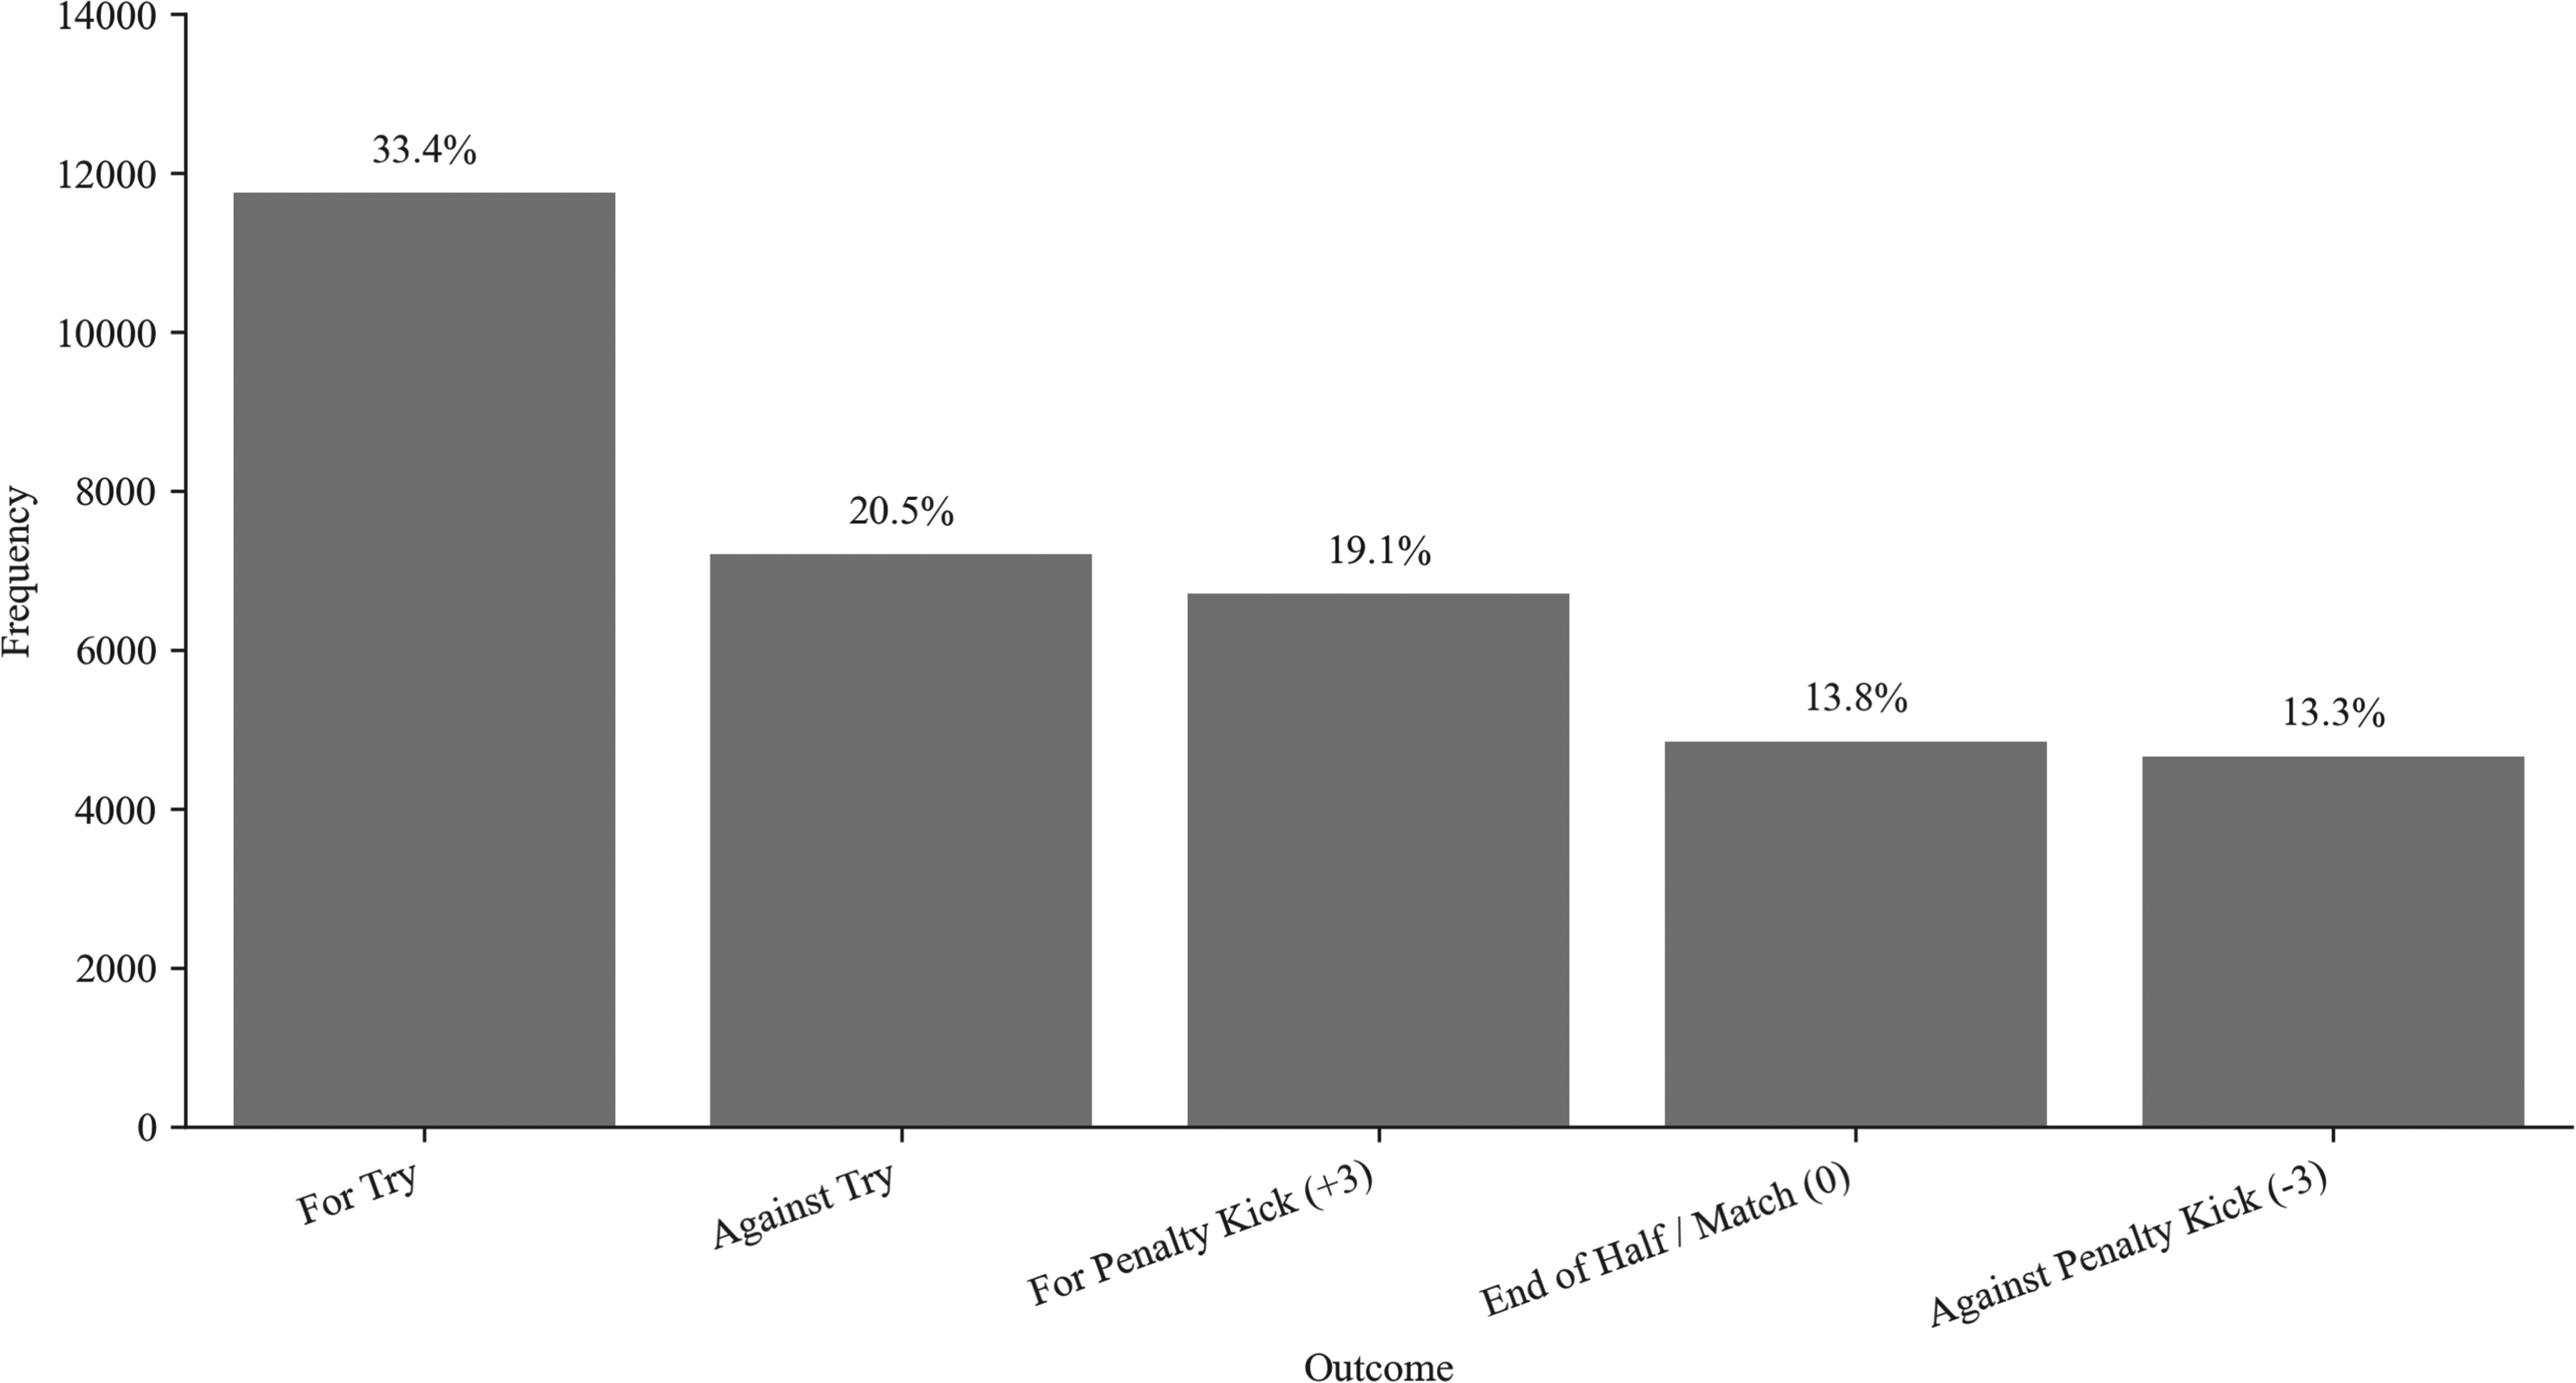
Frequencies of different scoring outcomes after reducing the classes of the dependent variable.
Predictive modelling
The development of an Expected Points model in rugby union was treated as a classification problem given the discrete nature of scoring outcomes (Yurko, 2017). This characteristic makes regression models inappropriate for predicting point scores, as their residuals fail to conform to the assumption of normality. A more effective strategy involves developing classification models that treat each scoring method as a distinct category, independent of its point allocation (Yurko et al., 2019).
Four classification algorithms were selected: multinomial logistic regression for its effectiveness in identifying linear relationships (Kleinbaum et al., 2008), random forest for its handling of high-dimensional data and categorical variables (Ho, 1995), support vector machine for its proficiency with imbalanced datasets (Wu and Chang, 2005) and k-nearest neighbors for its effectiveness with non-linearly separable data (Cover and Hart, 1967). While more advanced techniques such as gradient boosting machines or deep learning models exist, the primary goal of this foundational study was to first assess feasibility using these well-established models. The exploration of more complex architectures is identified as a key avenue for future work.
Models were trained on a sub-sample of the rugby union data to ensure their performance was only evaluated against a separate, unseen subset (Guyon, 1997). A stratified group 10-fold cross-validation method was used to prevent data leakage, ensuring phases from the same match were only present in a single subset. Models were iteratively trained and validated, and later evaluated for generalisability on a separate test subset (Davis and Goadrich, 2006).
Hyperparameter optimisation was performed using Optuna (Akiba et al., 2019) to identify optimal model configurations. Optuna is an optimisation framework that dynamically explores model configurations by pruning unpromising models and applying parallelisation to concurrently execute multiple trials (Akiba et al., 2019). The number of trials was adapted to each model’s computational demands: multinomial logistic regression used 1,000 trials per iteration in the group 10-fold cross-validation method (10,000 total), random forest and KNN used 500 trials per fold (5,000 total), while SVM used 100 trials per fold (1,000 total).
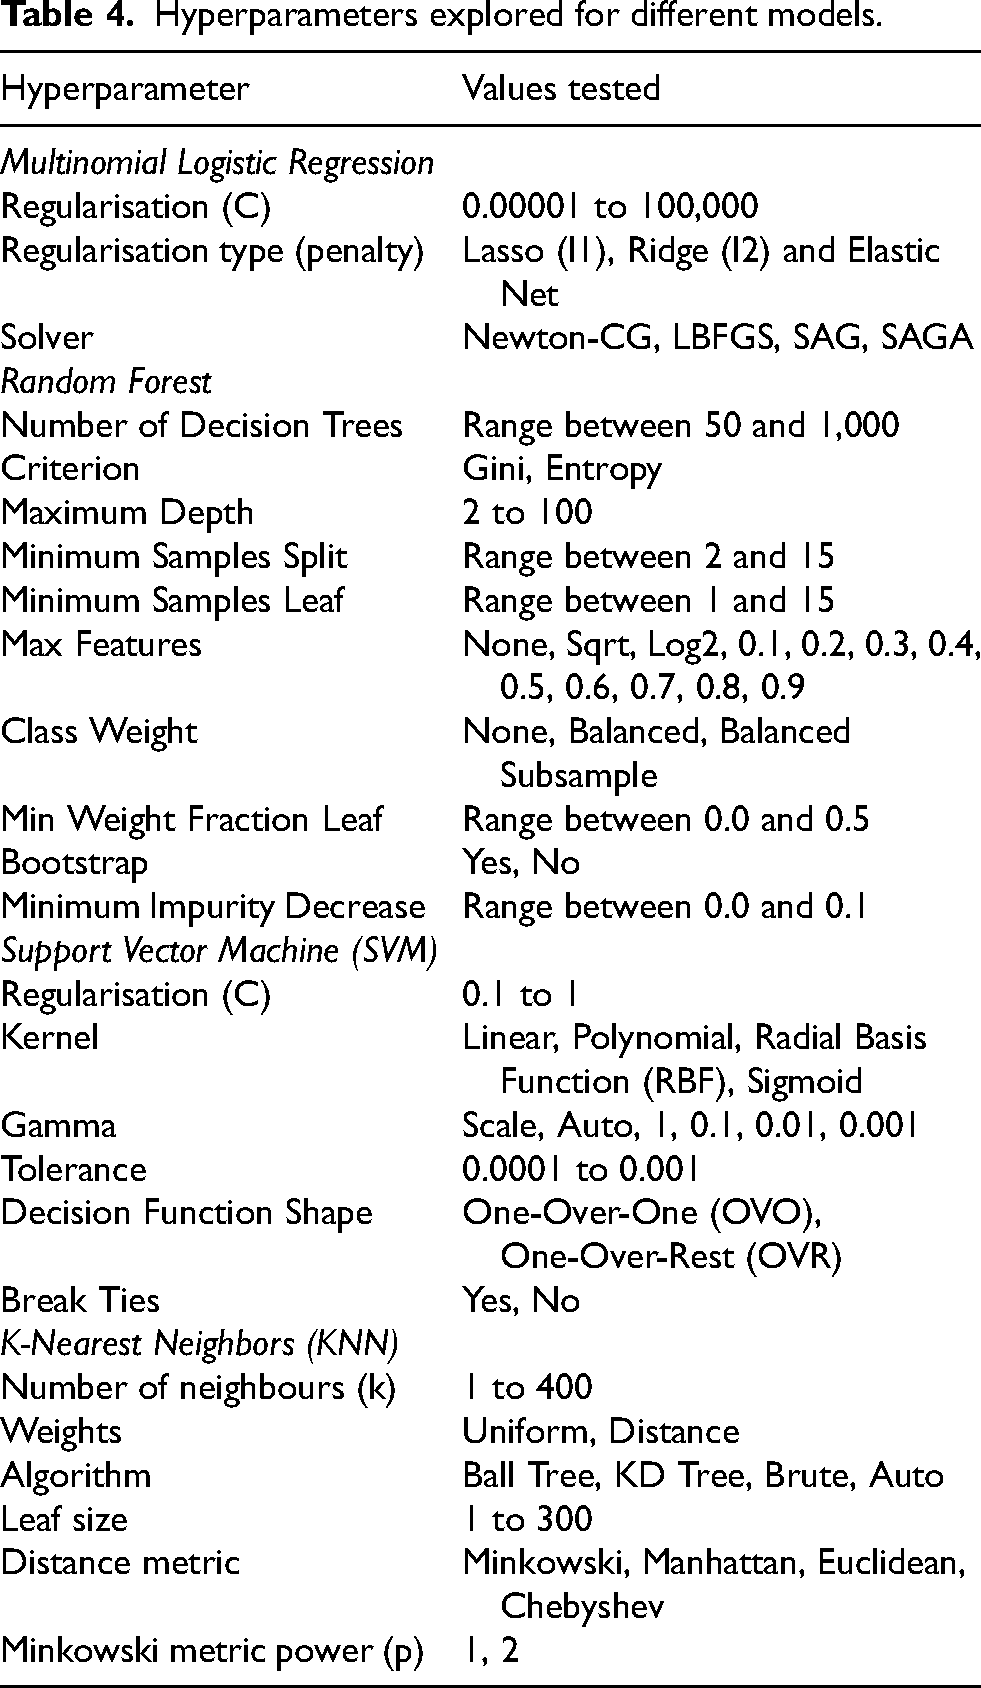
The optimisation process explored a balance between model complexity, regularisation techniques, optimisation algorithms and decision boundary characteristics (Table 4). Multinomial logistic regression was tuned for regularisation strength, type and solver algorithm (Hosmer et al., 2013). Random forest hyperparameters included ensemble size, splitting criteria and class imbalance strategies (Breiman, 2001). Support vector machine optimisation covered regularisation strength, kernel types, gamma values and decision function shapes (Andrew, 2000). K-nearest neighbors was optimised for number of neighbours, weighting schemes, search algorithms, and distance metrics (Cunningham and Delany, 2007).
Hyperparameters explored for different models.
Each model’s best-performing configuration was evaluated using classification reports and confusion matrices to identify biases. The detailed model development, tuning and evaluation provide an exhaustive comparison of these four classification algorithms. This helps identify their predictive potential while highlighting the inherent challenges of modelling Expected Points in rugby union.
The modelling process was conducted in two stages. First, all four algorithms were trained and evaluated on the data’s original, imbalanced class distribution to establish a performance baseline. This allowed for a transparent diagnosis of the challenges inherent to the dataset. Second, in direct response to the baseline models’ poor performance on minority classes, a targeted experiment was conducted on the best-performing model (random forest). This experiment used the Synthetic Minority Over-sampling Technique (SMOTE) to address the class imbalance and assess its impact on predictive performance.
Results
Baseline model performance
The best-performing model was a random forest classifier composed of 770 decision trees. It achieved an accuracy of 39.7%
Hyperparameter values of the top-performing configurations for each model.
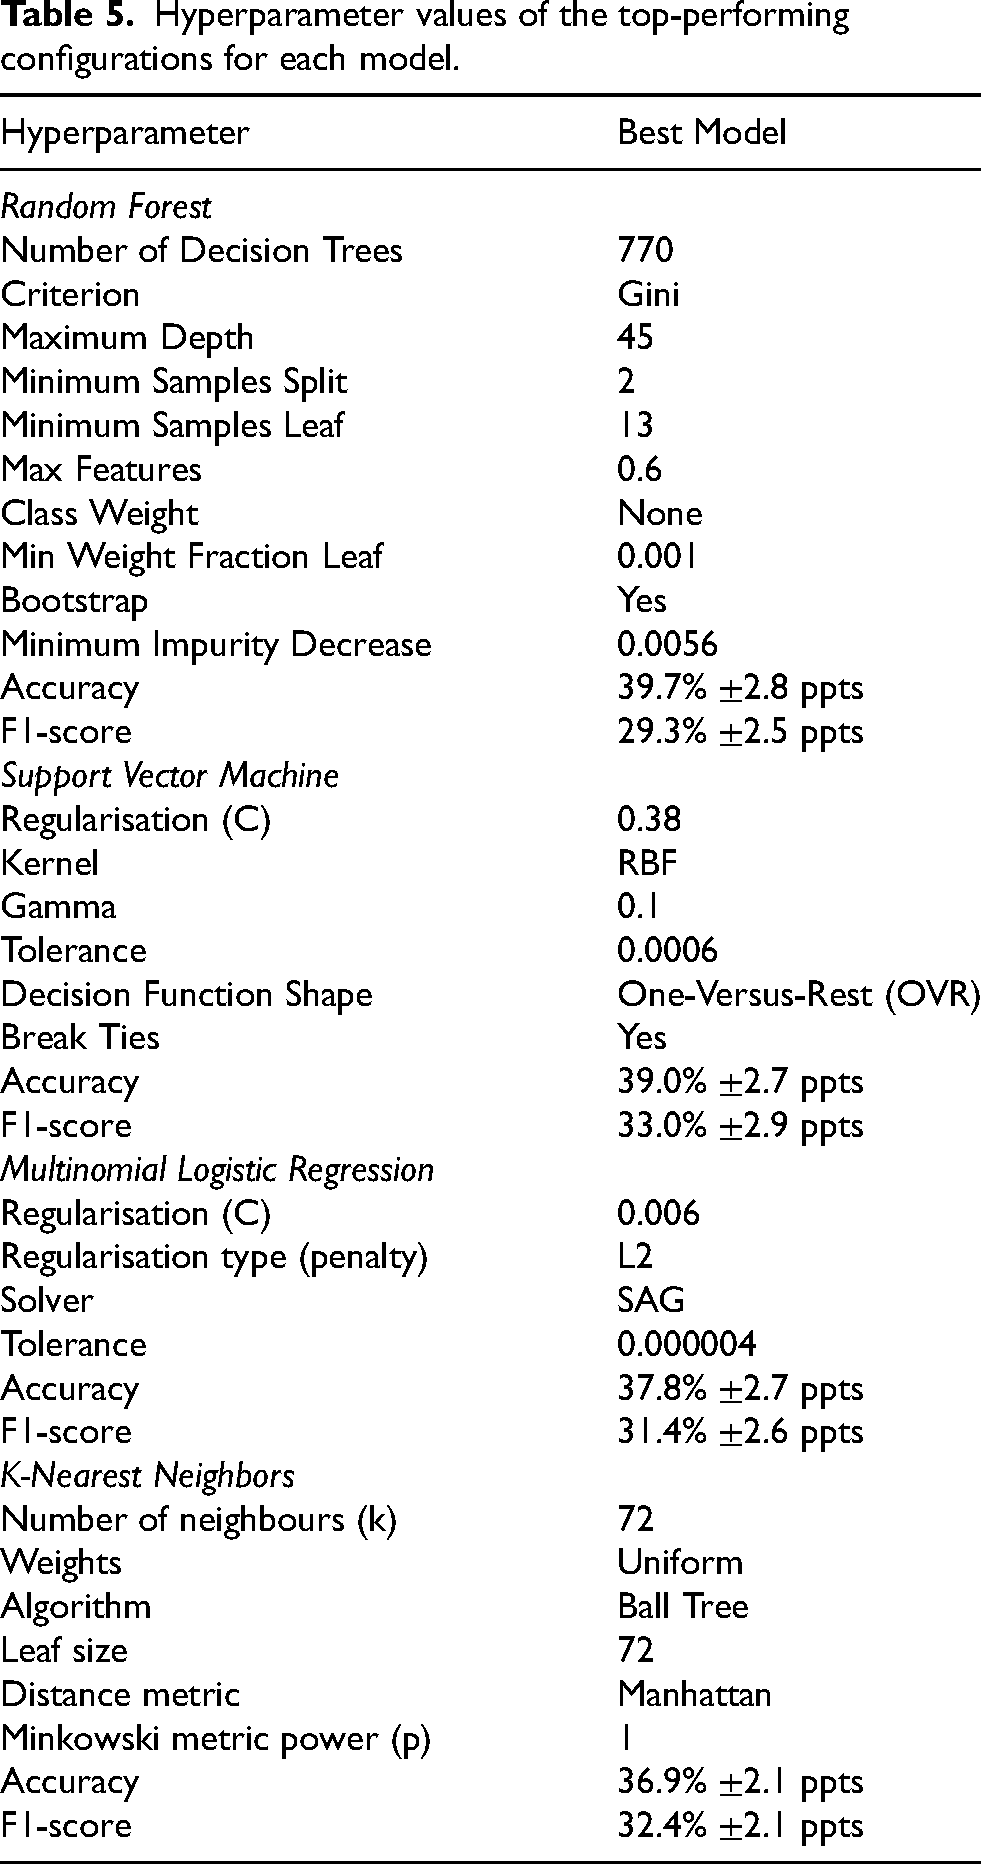
The random forest model was closely followed by the SVM model, which demonstrated a 39.0%
On the other hand, the multinomial logistic regression model (37.8%
Classification report
A further evaluation using the classification report in Table 6 highlighted significant biases towards predicting the majority class. The random forest showed a considerable preference for predicting tries scored (83.1%
Classification reports for different models.
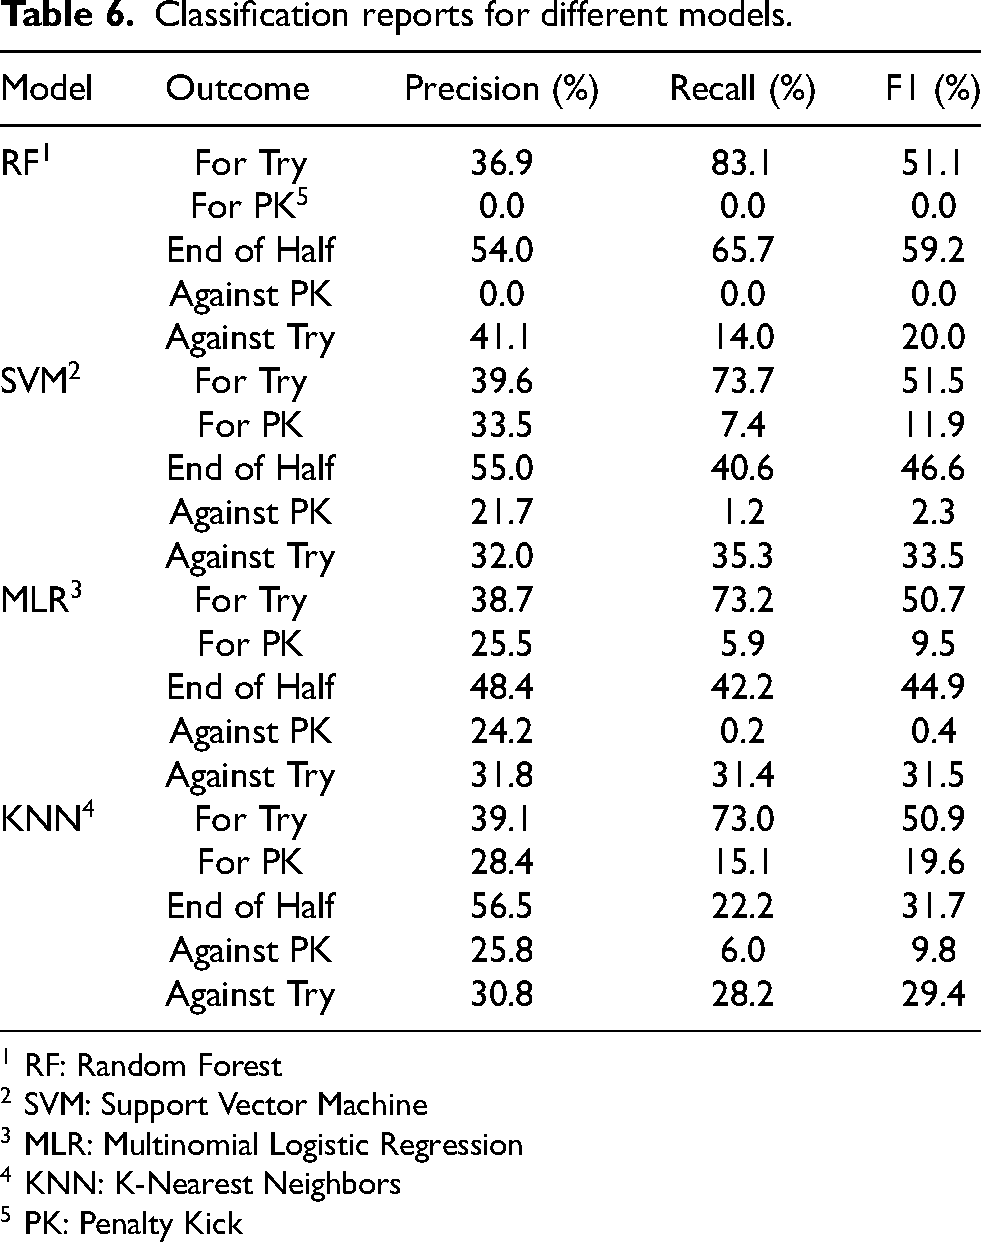
1 RF: Random Forest
2 SVM: Support Vector Machine
3 MLR: Multinomial Logistic Regression
4 KNN: K-Nearest Neighbors
5 PK: Penalty Kick
Confusion matrix
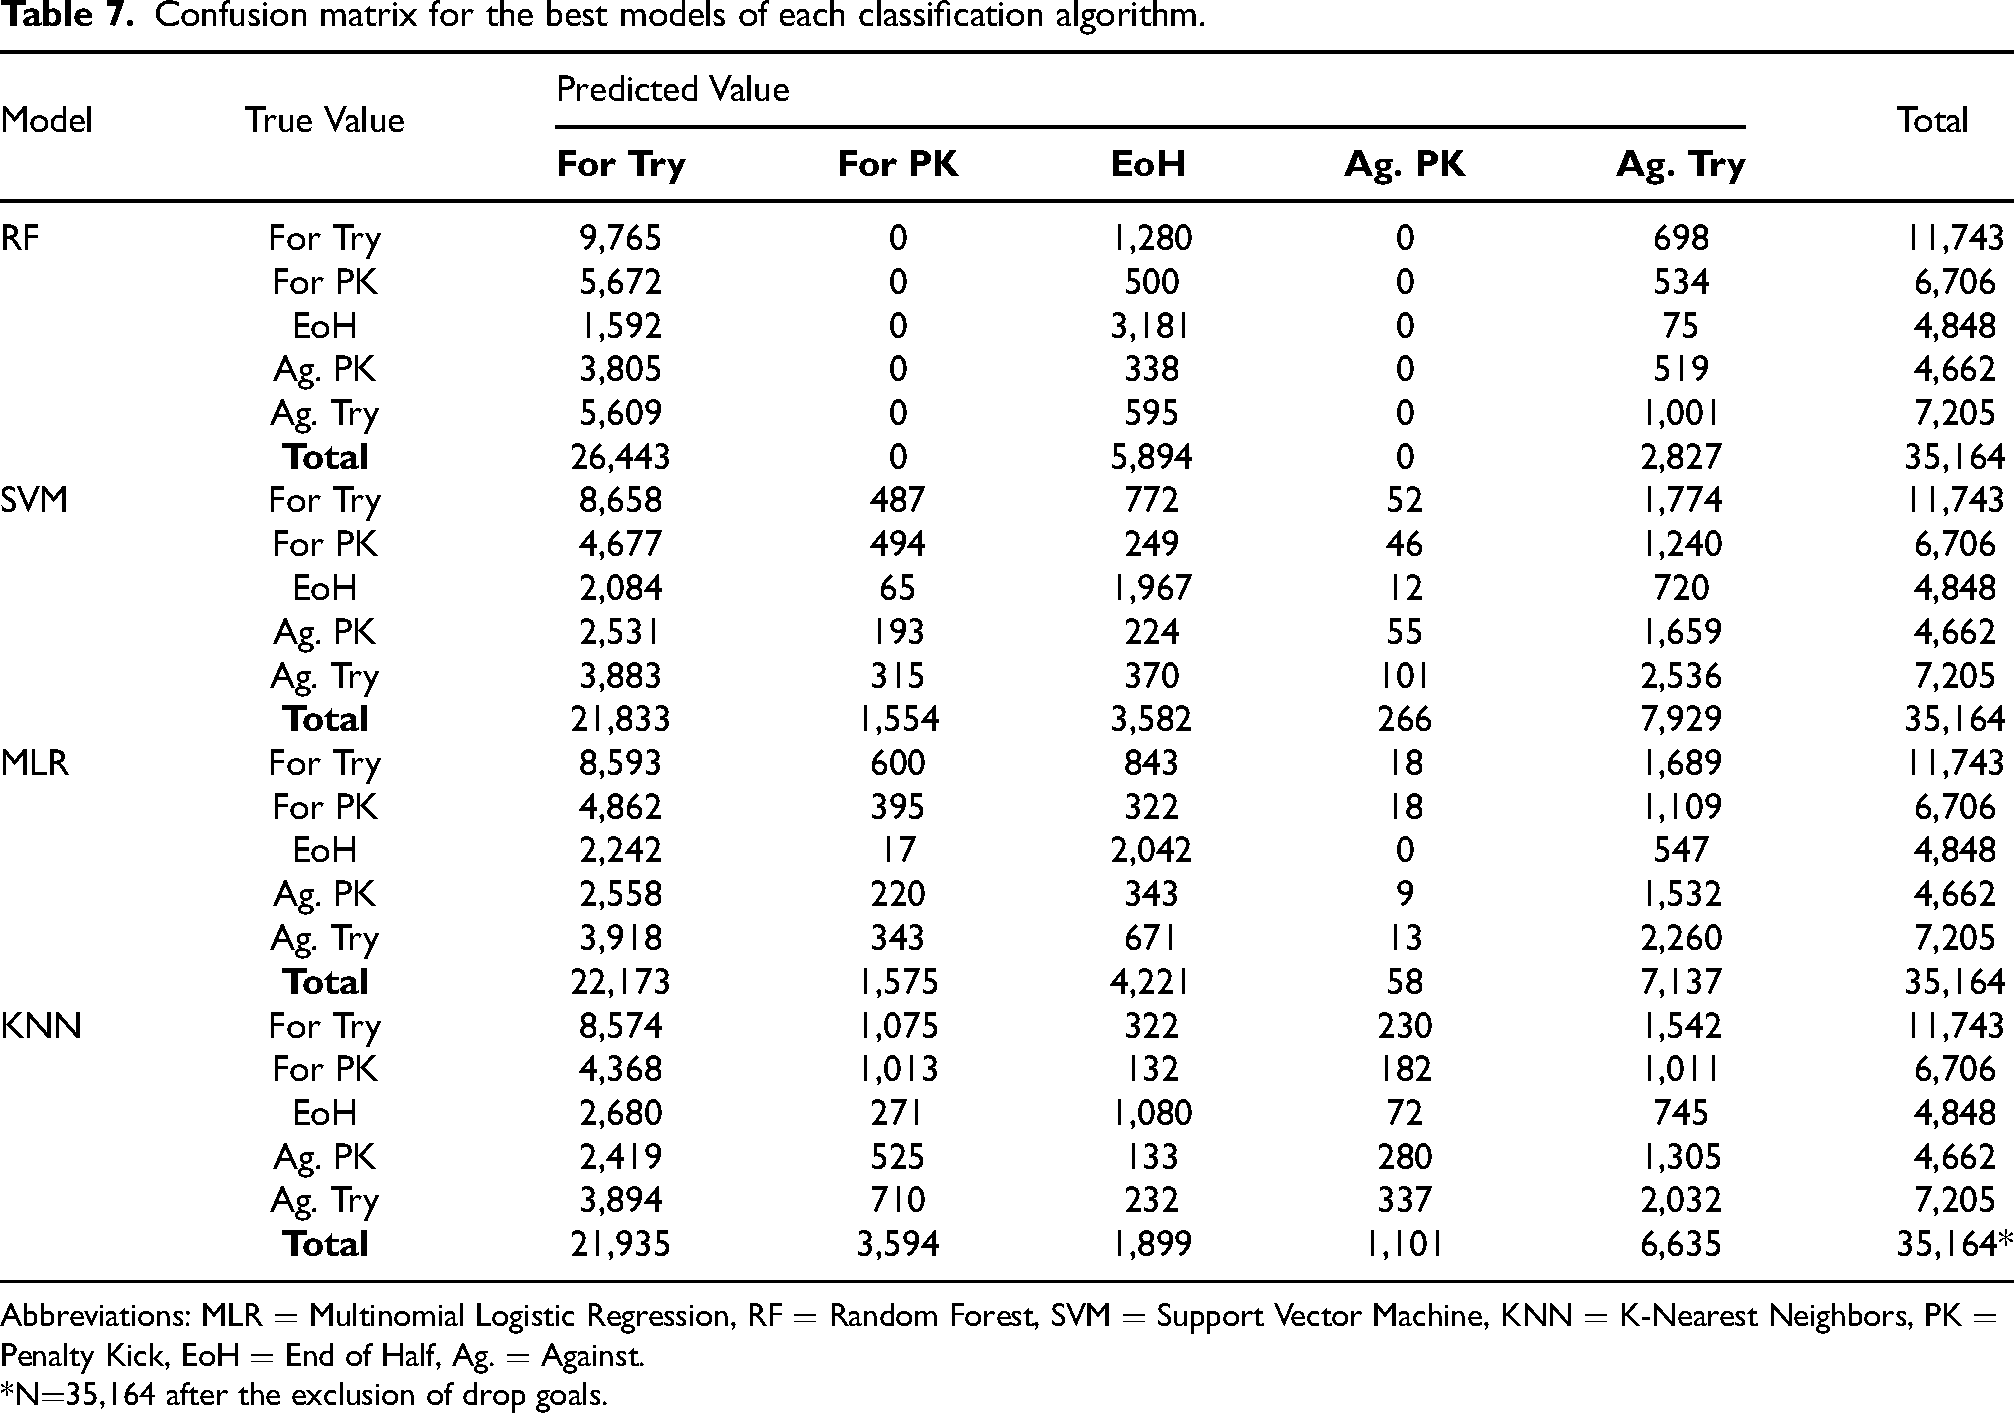
The confusion matrix in Table 7 shows further details on the effectiveness across models in predicting different scoring outcomes. It indicates that models over-predicted tries scored by between +125.2% (random forest) and +85.9% (SVM) relative to their true occurrence (n=11,743), accounting for between 75.2% (random forest) and 62.1% (SVM) of all predictions despite only representing 33.4% of all phases in the dataset. On the other hand, tries conceded were significantly under-predicted by the random forest model, with -60.8% fewer predictions (n=2,827) than true instances (n=7,205). Most of these missed true instances of tries conceded (90.4%) were predicted by this model as tries scored, further highlighting a bias towards the latter outcome. While the other three models showed a more balanced distribution of predictions for tries conceded, ranging from -7.9% (KNN) to +10.0% (SVM) compared to true instances, they produced a considerable number of false positives (69.4% KNN; 68.3% MLR; 68.0% SVM).
Confusion matrix for the best models of each classification algorithm.
Abbreviations: MLR
*N
Penalty kicks were significantly impacted by the models’ bias towards predicting tries scored. The random forest model made no penalty kick predictions, despite these two scoring outcomes combined representing 32.4% of the phases in the dataset (19.1% scored; 13.3% conceded). Other models also significantly struggled with penalty kick predictions, under-predicting penalty kicks scored by a margin ranging from -76.8% (SVM) to -46.4% (KNN) and penalty kicks conceded by between -98.8% (MLR) and -76.4% (KNN) compared to their true instances. As with tries conceded, the few penalty kick predictions made by the models also produced a high number of false positives for both scored (74.9% MLR; 71.8% KNN; 68.2% SVM) and conceded (84.5% MLR; 79.3% SVM; 74.6% KNN).
Predictions for the end of the half showed mixed results across models. The random forest model over-predicted phases leading to the end of the half by 21.6% compared to its true instances (n=4,848). The majority of these incorrect predictions corresponded to true instances of tries scored (47.2%) and conceded (21.9%). In contrast, all other models under-predicted the end of the half by amounts ranging from -60.8% (KNN) to -12.9% (MLR). The bias towards predicting tries scored was a major contributor to under-predicting the end of the half, with the models predicting tries scored for between 43.0% (SVM) and 55.3% (KNN) of true instances leading to the end of the half.
Addressing class imbalance with SMOTE
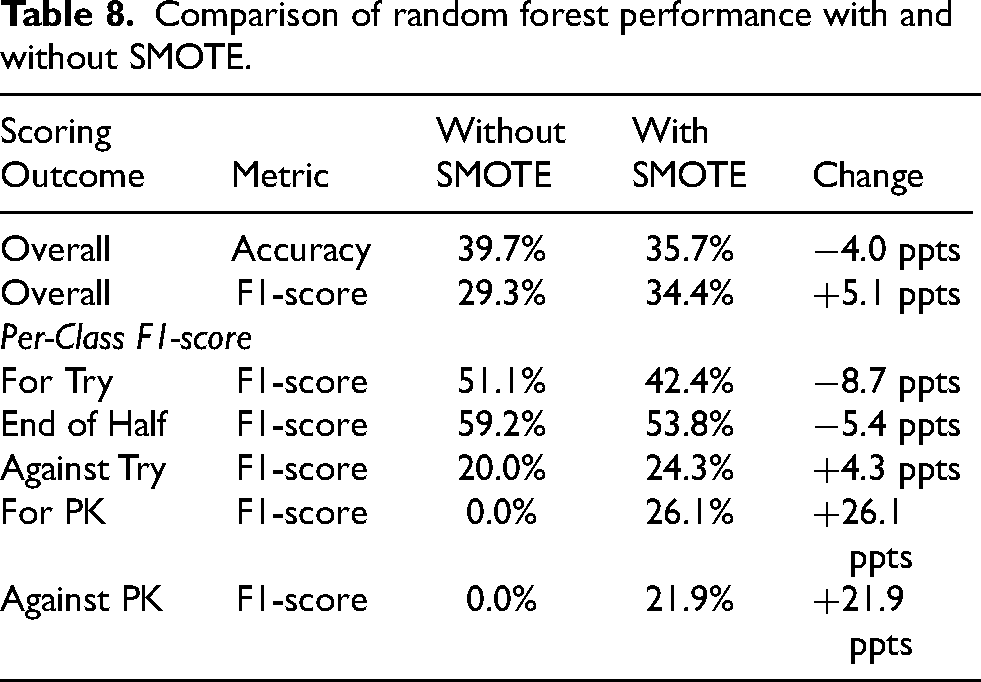
In response to the baseline random forest model’s inability to predict penalty kicks, a targeted experiment was conducted using SMOTE. While this led to a 4 percentage point drop in overall accuracy to 35.7%, it achieved a substantial 5.1 percentage point increase in the weighted F1-score to 34.4%, a more appropriate metric for this imbalanced classification problem. As shown in Table 8, the application of SMOTE increased the model’s ability to predict penalty kicks from a 0.0% F1-score to a more effective 26.1% (scored) and 21.9% (conceded) F1-score. This demonstrates a successful rebalance, where a moderate decrease in performance on majority classes resulted in a considerable gain in predictive power on rare but meaningful minority classes, making the model more practically relevant.
Comparison of random forest performance with and without SMOTE.
Feature importance
Feature importance metrics were extracted from the multinomial logistic regression and the random forest models, given that the support vector machine and k-nearest neighbors do not inherently produce feature importance measures, as these methods rely on distance or similarity calculations rather than explicit parameters or splitting criteria tied to individual features. The analysis of standardised coefficient magnitudes showed that pitch location was the most influential feature for the multinomial logistic regression model, accounting for 44.9% of the model’s importance. Disciplinary actions, such as yellow cards (14.7%) and red cards (13.8%), and time remaining (9.1%) also played important roles in the model’s predictions. On the other hand, phase sequence number (1.9%), points difference (1.4%) and pitch side (0.7%) all showed minimal contribution to its predictions.
The random forest model presented a different feature importance distribution. The model heavily relied on the seconds remaining variable (72.7%), defined as 80 minutes minus the seconds elapsed from the beginning of the match. Given the model’s low overall accuracy, this heavy reliance indicated a possible under-representation of more complex features in the dataset, forcing the model to concentrate on the most easily discernible pattern. As a result, the model over-emphasised time-sensitive scoring outcomes, such as the end of a half. Points difference was the second most influential feature (12.6%), while features such as type of play (0.6%), phase sequence number (0.3%), cards (0.1%) and pitch side (0.1%) had minimal impact on the model’s decisions.
Discussion
This study presents a comprehensive methodological approach to developing an Expected Points framework for rugby union. While the primary objective was to build a predictive metric representative of possession quality, the results did not achieve the necessary performance for practical application. However, the study’s main contribution lies in the invaluable foundational groundwork. It presents a transparent methodological benchmark, a rich dataset and a clear identification of the core challenges that must be overcome to transition the analysis of performance in rugby union from descriptive performance indicators to predictive modelling.
Following extensive notational analysis of 35,199 phases of play, four classification algorithms were evaluated. Despite hyperparameter optimisation, the top-performing model, a random forest classifier, achieved an accuracy of only 39.7% and an F1-score of 29.3%. All baseline models displayed considerable bias towards predicting tries at the expense of penalty kicks. While the SVM model produced a more balanced F1-score (33.0%), the overall performance was limited by factors like feature representation and class imbalance. However, a subsequent experiment using SMOTE demonstrated that this imbalance could be partially mitigated, improving the F1-score by 5.1 percentage points.
Comparing these results against current Expected Points models was challenging due to the absence of model evaluation results (e.g., accuracy, F1-scores or confusion matrices) in existing literature (O’Shaughnessy, 2006; Romer, 2006; Yurko et al., 2019). Consequently, alternative sports performance analysis literature was used to set an accuracy baseline. Studies across various sports have developed three-class models to predict match outcomes (wins, losses or draws) with accuracy scores between 52.4% and 67.5% (Hubáček et al., 2019; McCabe and Trevathan, 2008). The average performance of these models (54.9%) represented a 21.6 percentage point improvement from random guessing (33.3%). In this study, a 21.6 percentage point improvement from the no-information rate (22.7%), i.e., the accuracy that a model must exceed to outperform random guessing after accounting for class imbalance (James et al., 2013), resulted in a minimum accuracy baseline of 44.3%. Unfortunately, neither the random forest (39.7%) nor the support vector machine (39.0%) models were able to reach that baseline. This result confirms that while the methodological framework is sound, the resulting model is not yet reliable enough for direct application in professional coaching or tactical decision-making.
Despite insufficient predictive power, the Expected Points framework presented in this study carries important theoretical implications. The study recommends transitioning from fragmented individual indicators to a holistic approach of measuring performance through contemporary modelling techniques (Colomer et al., 2020). It identifies opportunities in rugby union research by drawing parallels from other invasion team sports, such as American football (Carter and Machol, 1971; Yurko, 2017), Australian rules football (O’Shaughnessy, 2006) or rugby league (Kempton et al., 2016).
Research in these sports has embraced predictive modelling and Expected Points, concepts that have received little attention in rugby union performance analysis literature (Hughes et al., 2012; James et al., 2005; Ortega et al., 2009). An opportunity exists to revolutionise the understanding of performance in rugby union by applying established methodologies from other sports. However, Expected Points literature often lacks sufficient information on model performance evaluation (Burke, 2008; Romer, 2006; Yurko, 2017). The absence of essential model evaluation metrics fails to demonstrate the generalisability and reliability of current Expected Points models in informing tactical decisions and limits their comparability to new models. This study addresses this gap by providing a detailed account of modelling steps and performance evaluation results, establishing a clear benchmark for future Expected Points models in rugby union.
The primary limitation identified was the severe class imbalance inherent to rugby union data, likely originating from the point-maximising nature of on-pitch actions, such as opting for tries over penalty kicks (Romer, 2006). This uneven class distribution caused the baseline models to over-predict majority outcomes at the expense of minority ones. However, the successful application of SMOTE indicated that this problem can be addressed with appropriate resampling techniques. Additionally, feature expansion may also help mitigate model bias by improving feature representation of key factors influencing penalty kicks, such as referee decisions to award penalties (Mascarenhas et al., 2005), player discipline (Mitchell and Tierney, 2021) or weather conditions (Crewther et al., 2020).
A second limitation observed was the complexity in modelling open-play sports like rugby union. The sport’s characteristics, involving tactical execution, technical ability, physicality and continuous play, create a dynamic environment where complex relationships between variables influence each phase’s outcome, such as player skills (Ziv and Lidor, 2016), tactics (Roberts et al., 2008), weather (Kearney and Riddiford-Harland, 2012), morale (Cotterill and Fransen, 2016) and fatigue (Duthie et al., 2003). These elements are typically absent from notational analysis datasets due to their limited observability (Hughes and Franks, 2004). Consequently, models trained on core contextual variables struggle to learn these underlying interactions. Future research could explore the addition of contextual data related to player fitness, fatigue, team morale or psychological resilience to capture player endurance and its influence on decision-making and scoring. Team-level data on formations, player roles and strategic plays could also enrich the modelling process.
Furthermore, the selection of four classification algorithms explored represents only an initial evaluation of the predictive potential in rugby union phase-level data aimed at laying the foundation for Expected Points modelling in rugby union. Future research could expand upon this work with a more comprehensive exploration of advanced modelling techniques that include methods such as gradient boosting machines (Ke et al., 2017) or recurrent neural networks, such as long short-term memory networks (Hochreiter and Schmidhuber, 1997). Inspired by the work of Yurko et al. (2019) in the NFL, this study framed the task as a classification problem. However, future approaches could instead investigate techniques that assume different data structures and emphasise the temporal and sequential characteristics of rugby play. These approaches may improve upon the predictive performance achieved by the classification models in this study.
The study lays the foundation for the development of Expected Points in rugby union. Building on the application of SMOTE demonstrated in this study, future research should explore more advanced resampling techniques, such as Borderline-SMOTE or ADASYN, which may offer similar benefits with less artificial noise (Han et al., 2005; He et al., 2008). Combining these advanced samplers with cost-sensitive learning could also be used to apply heavier penalties for misclassifying less frequent scoring outcomes (Ling and Sheng, 2008).Additionally, data expansion could also improve the feature representation of the complex dynamics in rugby union. New variables may include the relative strength between teams, such as recent form, head-to-head records or win-loss ratios (McCabe and Trevathan, 2008); player-specific metrics, such as fatigue levels and individual player skills; environmental conditions, such as weather or pitch conditions; and psychological factors, such as team morale. One avenue for future research is the collection of spatial and temporal features from wearable sensors or GPS units. Another is the derivation of momentum-related features from existing data (Blum and Langley, 1997), such as calculating the cumulative number of phases in a possession, the number of seconds since the last scoring event or the percentage possession using a 20-minute rolling window. This greater emphasis on spatiotemporal factors could effectively account for changes in playing dynamics and scoring patterns over the course of a match.
Conclusion
The development of Expected Points in rugby union requires a paradigm shift towards more rigorous and reliable approaches for quantifying the expected situational value of different match scenarios. The study presents a theoretical performance analysis framework designed to better capture complex feature relationships than association-based statistics. However, extensive notational analysis, feature engineering and hyperparameter optimisation resulted in a baseline model with insufficient accuracy for practical application, primarily due to the limiting factors of class imbalance and feature representation. This study demonstrated that these limitations can be partially mitigated with methods such as the application of resampling techniques. The use of SMOTE sacrificed a small amount of overall accuracy for a meaningful improvement in the model’s F1-score and its ability to predict a wider range of scoring events, suggesting that a more balanced model is achievable.
The complexity observed in measuring and interpreting all variables affecting rugby union scoring challenges the positivist paradigm that has predominated sports performance analysis literature (Mackenzie and Cushion, 2013). Research within this paradigm has often aimed to establish causal relationships between isolated performance indicators (Jones et al., 2004; Ortega et al., 2009). This epistemological approach has reduced the complexity of sports performance by presenting it in an overly descriptive, systematic and unproblematic way that ignores the confounding variables and contexts directly and indirectly influencing success (Cushion, 2007).
The development of an Expected Points metric for rugby union represents an area of opportunity with important implications for tactical decision-making, player development and fan engagement. A standardised measure of performance that accounts for the situational context and potential impact of each action on the pitch could revolutionise the way the sport is understood, analysed and played.
This study presents a reproducible methodology aimed at inspiring future research to build upon its methods and advance towards a more data-driven and engaging future for rugby union. Exploring the sport’s spatiotemporal characteristics by incorporating positional and momentum-related metrics could substantially enhance the predictive capabilities of datasets through improved feature representation. The integration of enriched datasets with time-series models or boosting techniques could result in predictive performance exceeding that observed in this study. Such enhanced predictive power could lead to the development of reliable Expected Points models that provide novel insights into the sport’s key determinants of success.
Footnotes
Ethical approval
Ethical approval was not required for this study as it involved the analysis of publicly available data.
Funding
The author(s) received no financial support for the research, authorship, and/or publication of this article.
Declaration of conflicting interests
The authors declared no potential conflicts of interest with respect to the research, authorship, and publication of this article.