
Abstract
Background
Depression poses a serious threat to the well-being of older adults, especially in rural China, where healthcare resources are limited. This study aimed to develop a machine learning model incorporating social, psychological, and physiological factors to predict depression risk among rural elderly individuals, supporting early screening and intervention.
Methods
A total of 3232 rural older adults from the 2018 wave of the China Health and Retirement Longitudinal Study (CHARLS) were included. Depressive symptoms were assessed using the CES-D10 scale. LASSO regression was applied to select predictors. Six machine learning algorithms—SVM, DMR-CNN, DT, XGBoost, RF, and LR—were compared. Model performance was evaluated by ROC curves, calibration plots, and decision curve analysis.
Results
Among participants, 1259 (38.9%) showed depressive symptoms. Nine predictors were selected. DMR-CNN outperformed other models, achieving AUCs between 0.788 and 0.899, the highest accuracy of 0.875, a sensitivity of 0.852, and the lowest Brier score of 0.112.
Conclusion
Machine learning models based on CHARLS data show potential to identify depression risk in rural older adults. Key risk factors include older age, female sex, chronic disease, pain, poor sleep, and cognitive decline. These findings support precise and early mental health interventions in underserved aging populations.
Introduction
With the accelerated global aging process, the health of older adults has become a critical research focus in public health. 1 According to the Seventh National Population Census (2020), older adults aged 60 and above in rural China numbered approximately 120 million, representing 23.81% of the entire Chinese population. 2 Existing studies report that the prevalence of depression among middle-aged and older Chinese exceeds 30%, with significantly higher rates in women. 3 Furthermore, treatment uptake for depression is below 10%, 4 and the untreated rate in rural areas is twice that in urban regions. 5 In China's vast rural regions, lagging socioeconomic development, 6 inadequate medical resources, 7 and weak social support systems 8 increase exposure to psychosocial stressors, 9 leading to a high incidence of mental health problems such as depression. 10 Therefore, achieving early identification and intervention for depression among rural elderly under resource constraints remains a pressing challenge in epidemiology and mental health. 11
In recent years, machine learning (ML) has rapidly expanded its applications across diverse domains, 12 tackling complex tasks such as interaction-aware pedestrian trajectory prediction using graph neural networks, 13 smart contract vulnerability detection in computer networks, 14 and advanced image segmentation using convolutional neural networks. 15 Building on these advanced techniques, ML applications in medicine offer novel approaches for early disease prediction, 16 diagnosis, 17 and prognostic assessment 18 by mining large-scale, multidimensional data to uncover complex patterns beyond traditional statistics. 19 In depression prediction research, 20 scholars have employed algorithms such as SVM, 21 random forest, 22 and neural networks, 23 demonstrating promising applicability in clinical risk assessment and early intervention. 24 This aligns with broader trends in computational neurology, where methods like spatial context convolutional neural networks are being used for the early diagnosis of related conditions such as Alzheimer's disease. 25 Similarly, Xu et al. assessed depression risk in older adults by applying multiple machine learning algorithms, including random forest, logistic regression, etc., each designed to enhance the predictive performance in different aspects. 26 Moreover, Wang et al. combined sociodemographic and health indicators with ensemble methods to predict depression in rural elderly, providing empirical support for ML applications in mental health. 27
Despite these advances, applying existing models directly to the rural elderly population in China presents significant challenges, and the current literature suffers from systematic shortcomings in this regard.28,29 First, most existing prediction models have been developed using data from urban populations. 30 These models fail to fully account for the unique socio-economic, healthcare access, and environmental differences specific to rural areas, limiting their predictive efficacy and generalizability to this group. 31 Second, current research has not adequately addressed the unique data quality issues inherent to rural settings.32,33 Data acquisition in rural areas is difficult, leading to incomplete, biased, and missing data, which challenges model training and stability; however, existing studies rarely develop strategies to address this. 34 Finally, while algorithms like SVM and RF have been used, there is a lack of systematic comparison regarding which models (especially deep learning approaches) perform best on the unique, high-dimensional, and often imbalanced datasets characteristic of rural elderly populations. 35 Therefore, there remains an urgent need for a prediction model specifically tailored to the predictors and data characteristics of rural older adults in China.
Machine learning (ML) models, especially deep learning techniques, are particularly suitable for predicting depression risk in rural elderly populations due to the complex and high-dimensional nature of the data. These models excel at capturing nonlinear relationships between sociodemographic, behavioral, and health-related factors, which may not be easily detectable using traditional regression methods. In rural China, where depression is often influenced by a combination of social isolation, physical health limitations, and socioeconomic factors, ML approaches allow for a more comprehensive understanding of the underlying risk mechanisms. The ability of ML to model such interactions makes it a promising tool for identifying at-risk individuals, particularly when dealing with heterogeneous and multifaceted data common in aging populations. We hypothesize that machine learning algorithms can effectively predict depression risk among rural Chinese older adults, specifically by incorporating multidimensional sociodemographic, behavioral, and health-related variables that are highly relevant to this population.
In conclusion, with the continuous development of artificial intelligence and big data technologies, machine learning-based depression prediction models have become a new hotspot in epidemiological research. In the future, by continuously optimizing data collection and processing workflows, improving model interpretability, and promoting its clinical application, this study aims to provide effective technical support for early intervention in depression among rural elderly populations and contribute to the development of rural public health in China.
Methods
Study design and participants
CHARLS is one of the first nationally representative longitudinal surveys of Chinese middle-aged and older adults, employing a multistage, stratified probability-proportional-to-size (PPS) sampling design to ensure representativeness. 36 The survey covers 28 provinces, 150 counties, and 450 communities (villages), with PPS sampling conducted at the county, household, and individual levels. This revision addresses the concern and clarifies the point. Data for this study were drawn from Wave 4 (2018) of CHARLS (http://charls.pku.edu.cn/en). 37 CHARLS targets individuals aged ≥45 years and their spouses, collecting data on social, economic, and health status. All waves received ethical approval from Peking University IRB (00001052-11015), and participants provided informed consent. Exclusion criteria: age <60 years; incomplete or invalid CES-D10 data or missing gender; urban residence. Finally, 3232 individuals were included. The sample selection process is illustrated in Figure 1.

The process of data preprocessing and model construction.
Outcome variable
Depressive symptoms were measured using the 10-item Center for Epidemiologic Studies Depression Scale (CES-D10), which has been widely used and validated among older adult populations in China. 38 The scale comprises 10 items covering dimensions such as depressed mood, appetite change, and sleep disturbance, including positively and negatively worded items. Participants recalled experiences over the past week and responded using a four-level scale: Rarely (<1 day), Sometimes (1–2 days), Often (3–4 days), and Almost Always (5–7 days). 39 Item scores are summed to yield a total score (0–30); a score ≥10 indicates depressive symptoms, while <10 indicates no depressive symptoms. 40 CES-D10 is widely used in epidemiological and clinical research for initial depression risk screening.
Socio-demographic factors
The variables of the socio-demographic data selected for this study include age, sex, 41 education level, 42 place of residence, marital status, etc. The variables are categorized as follows: sex: female or male; education level: below primary, primary, secondary, high school and above; and marital status: “married” (including living with spouse or temporarily separated for work, etc.) and “other” (including separated, divorced or widowed). Age is considered a continuous variable.
Behavioral factors
Behavioral factors include exercise, 43 socialization, 44 smoking, 45 alcohol consumption 46 and sleep time. 47 Of these, exercise, social activities, smoking and drinking were categorized as “yes” and “no.” Sleep duration was measured by asking the question, “In the past month, how many hours of sleep did you get on average each night?” and was considered a continuous variable in this study.
Health status
The following health status variables were selected for this study: self-rated health, 48 Chronic disease, 49 disability, and pain. 50 The variables were categorized as follows: self-rated health: very poor, poor, fair, good, or very good; chronic disease, disability, and pain were categorized as “yes” and “no.” In this study, chronic diseases included 13 types, namely: dyslipidemia, diabetes mellitus, cancer, cardiovascular disease, chronic lung disease, liver disease, psychiatric problems, stroke, psychiatric disorders, arthritis or rheumatic diseases, kidney disease, digestive disorders, or asthma. Disability assessment was realized through the Activities of Daily Living (ADL) and Instrumental Activities of Daily Living (IADL) scales. 51 The ADL is used to measure basic self-care abilities, including dressing, bathing, eating, getting up, toileting, and controlling defecation and urination, while the IADL assesses the ability to perform complex instrumental activities, such as housekeeping and cooking hot meals. Participants’ responses to each activity were categorized into four groups: (1) no difficulty; (2) difficulty but can be performed independently; (3) requires assistance; and (4) completely unable to perform. The scoring rules were: if the activity had no difficulty (option 1) a score of 0 was given, and a score of 1 was given if there was difficulty (options 2/3) or if it could not be completed (option 4). The final ADL/IADL was categorized into two groups: no disability (0 points for all items) and disability (≥1 point for any item).
Psychological factors
Psychological factors include life satisfaction (extremely to not at all satisfied) and cognitive function: episodic memory (immediate recall, 0–10), delayed memory (0–10), and mental status (orientation [5 points], calculation [5 points], drawing [1 point]; total 11). 52
Statistical analysis
Data analysis was performed using SPSS 27.0 and Python 3.8. In SPSS 27.0, continuous variables were characterized and the Kolmogorov–Smirnov test was conducted to determine whether the data followed a normal distribution. Variables conforming to a normal distribution are described as mean ± standard deviation (x ± s), and comparisons of means between two groups and among multiple groups were performed using the t-test and analysis of variance (ANOVA), respectively. Data that did not conform to a normal distribution or had unequal variances are presented as median (Q1, Q3) and were compared using the rank-sum test for intra- or intergroup comparisons. Categorical data are expressed as n (%), and comparisons among two or more groups were performed using the chi-square test or Fisher's exact test, with a P-value <0.05 indicating statistical significance.
Python 3.8 was used to perform LASSO regression to screen for significant risk factors, after which six machine learning algorithms—convolutional neural network (DMR-CNN), XGBoost, random forest (RF), decision tree (DT), support vector machine (SVM), and logistic regression (LR)—were implemented to construct a depression risk prediction model for the rural elderly population. In this study, we performed comprehensive data preprocessing to ensure data quality and prepare for machine learning model application. 53 First, variables with more than 20% missing values were excluded, and the remaining missing data were imputed using the mean (for continuous variables) or the mode (for categorical variables). Next, we detected and handled outliers using Z-scores, capping values beyond 3 standard deviations at the 95th percentile. Data preprocessing involved encoding categorical variables (“gender,” “marry,” “exercise,” “disability,” and “chronic’) using label encoding. Subsequently, all 9 features were standardized using “StandardScaler.”
To robustly evaluate and compare models, we implemented a 10-Fold Stratified Cross-Validation (CV) framework. The dataset (n = 3232) was partitioned into 10 fold, maintaining the original 38.9% prevalence of depression in each fold. Model training and evaluation were repeated 10 times, with each fold serving as the test set once.
Hyperparameter tuning was conducted rigorously and fairly within the 10-fold CV loop to prevent data leakage.
For traditional ML models (LR, DT, RF, SVM, XGBoost, and LR), hyperparameters were optimized on each training fold using a nested 3-fold GridSearchCV. The specific parameter grids searched for each model are detailed in Table 1.
Hyperparameter setting of the traditional ML model.

For all deep learning models (DMR-CNN, CNN_NoResidual, and SimpleCNN), models were trained using an Adam optimizer. Performance was optimized using an early stopping mechanism (patience = 10) based on a 10% validation set split from the training fold. The detailed architecture and training parameters are shown in Table 2.
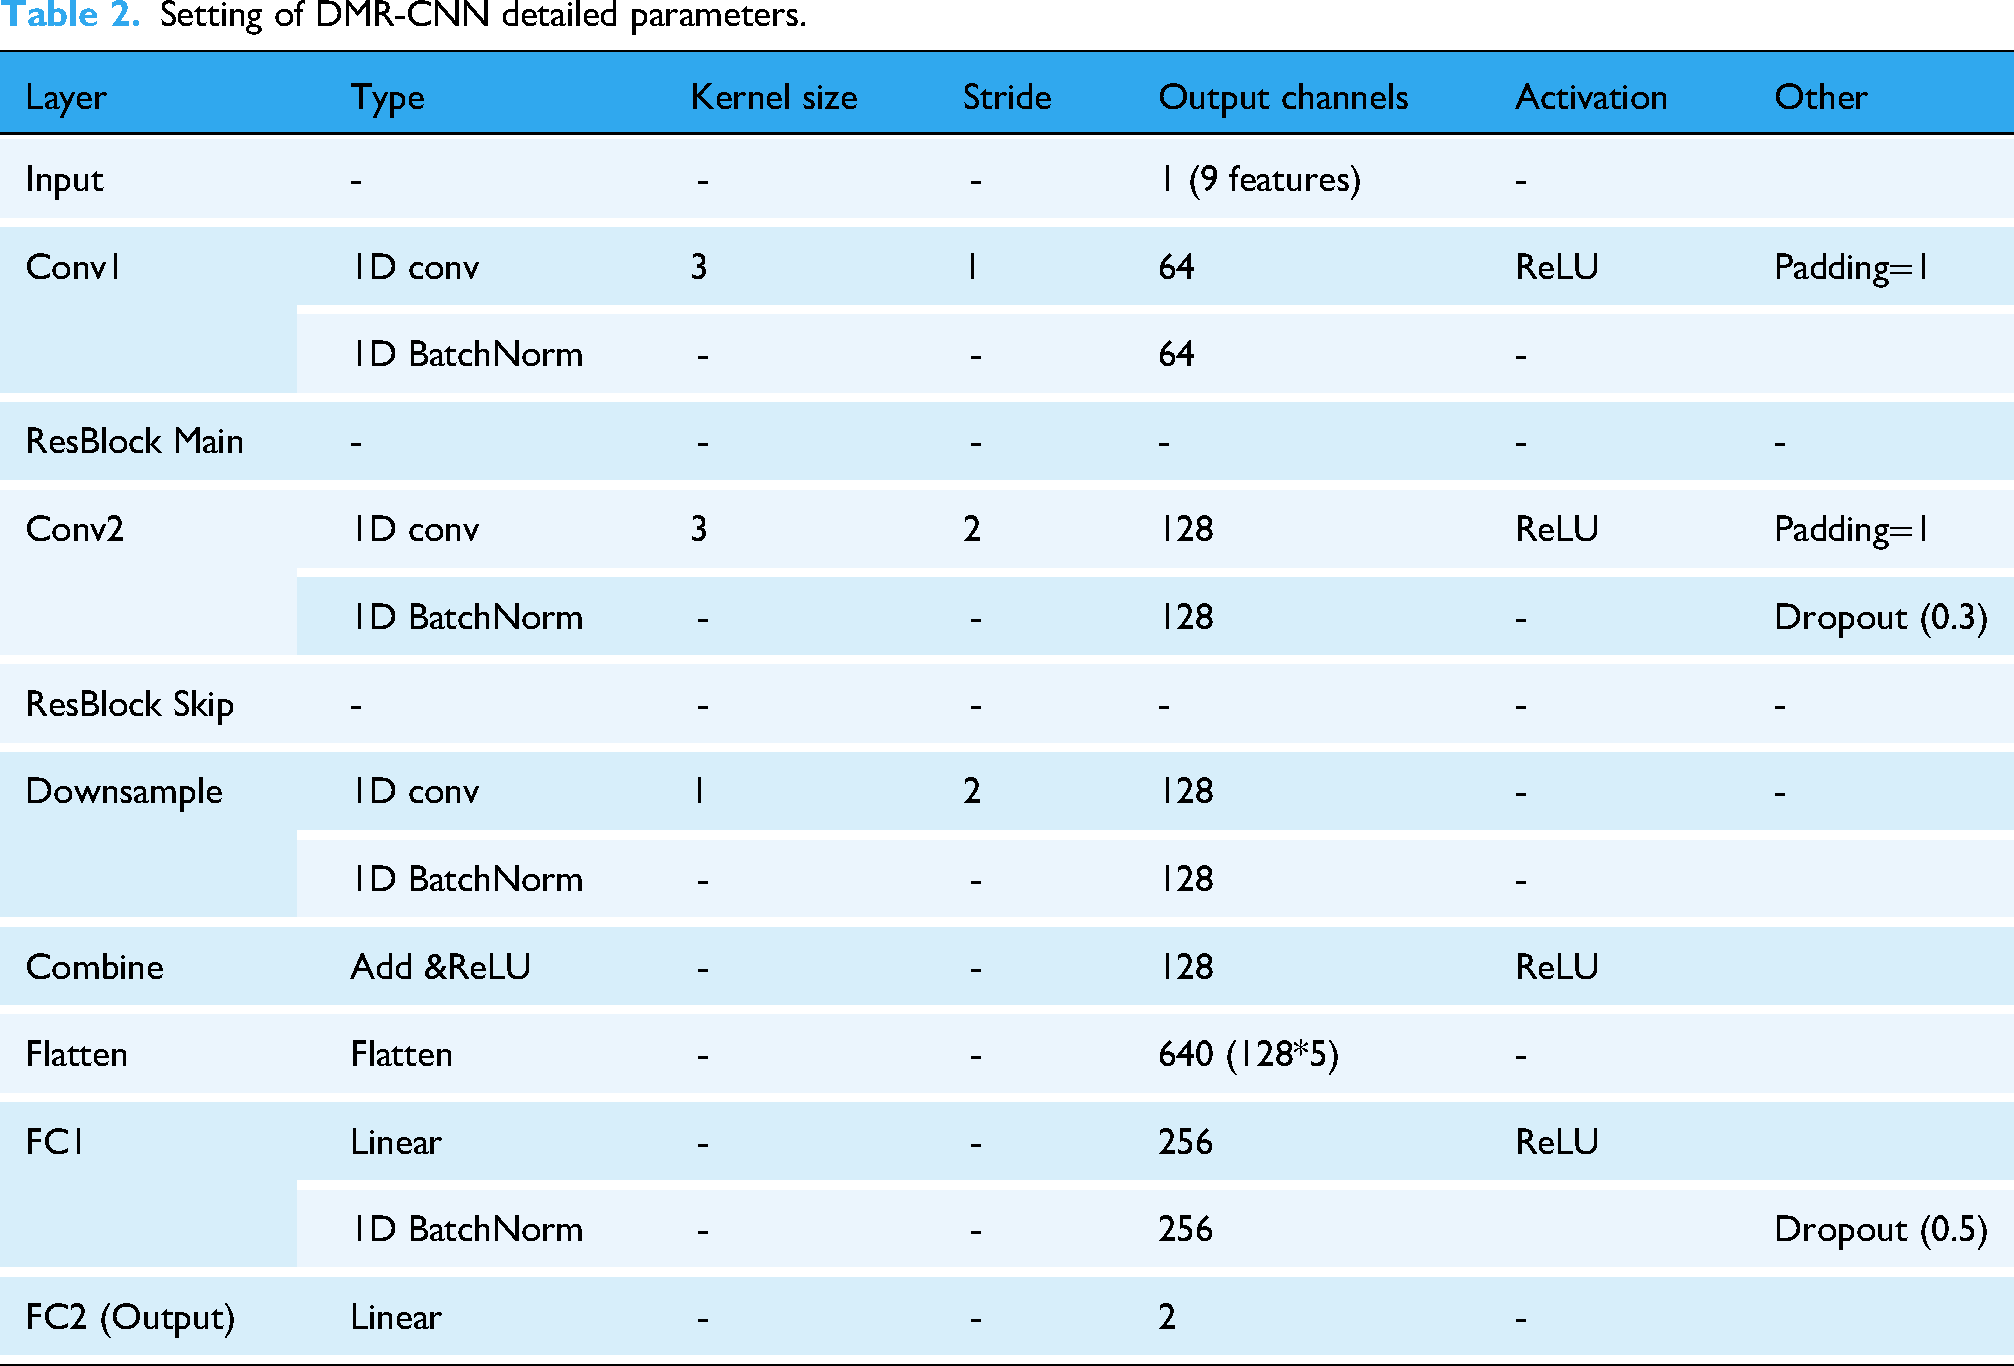
Setting of DMR-CNN detailed parameters.
Model performance was assessed using accuracy, area under the ROC curve (AUC), precision, recall, F1-score, and the Brier Score. All reported metrics are presented as the (mean ± standard deviation) from the 10 test fold to demonstrate model stability.
Subsequently, decision curve analysis (DCA) was performed to evaluate the clinical utility and net benefit of the models. Calibration curves were used to visualize the agreement between predicted probabilities and observed event rates.54,55 Finally, given the black-box nature of the best-performing model, SHapley Additive exPlanations (SHAP) values were used to interpret feature contributions and importance. 56 In addition, to examine potential fairness issues, subgroup analyses were performed by gender, age group, and education level. Following the recent framework on machine learning bias proposed by Wang and Cao, 57 we aimed to identify possible performance disparities across sociodemographic subgroups.
DMR-CNN architecture
Deep learning models were chosen for this study because the dataset contains numerous interrelated and nonlinear variables, such as self-reported health, social support, and functional limitations. These variables interact in complex ways, and deep learning methods are particularly effective in capturing these hidden relationships through hierarchical feature representations. This study proposes an improved Dual-Module Residual CNN Network (DMR-CNN) for predicting depressive states in the elderly. The DMR-CNN model is briefly described as follows. As shown in Figure 2, the model uses a dual-module convolutional structure and residual connections. The proposed improved DMR-CNN consists of three core components: a convolutional feature extraction module with residual connections, a downsampling path with skip connections, and a fully connected classifier.
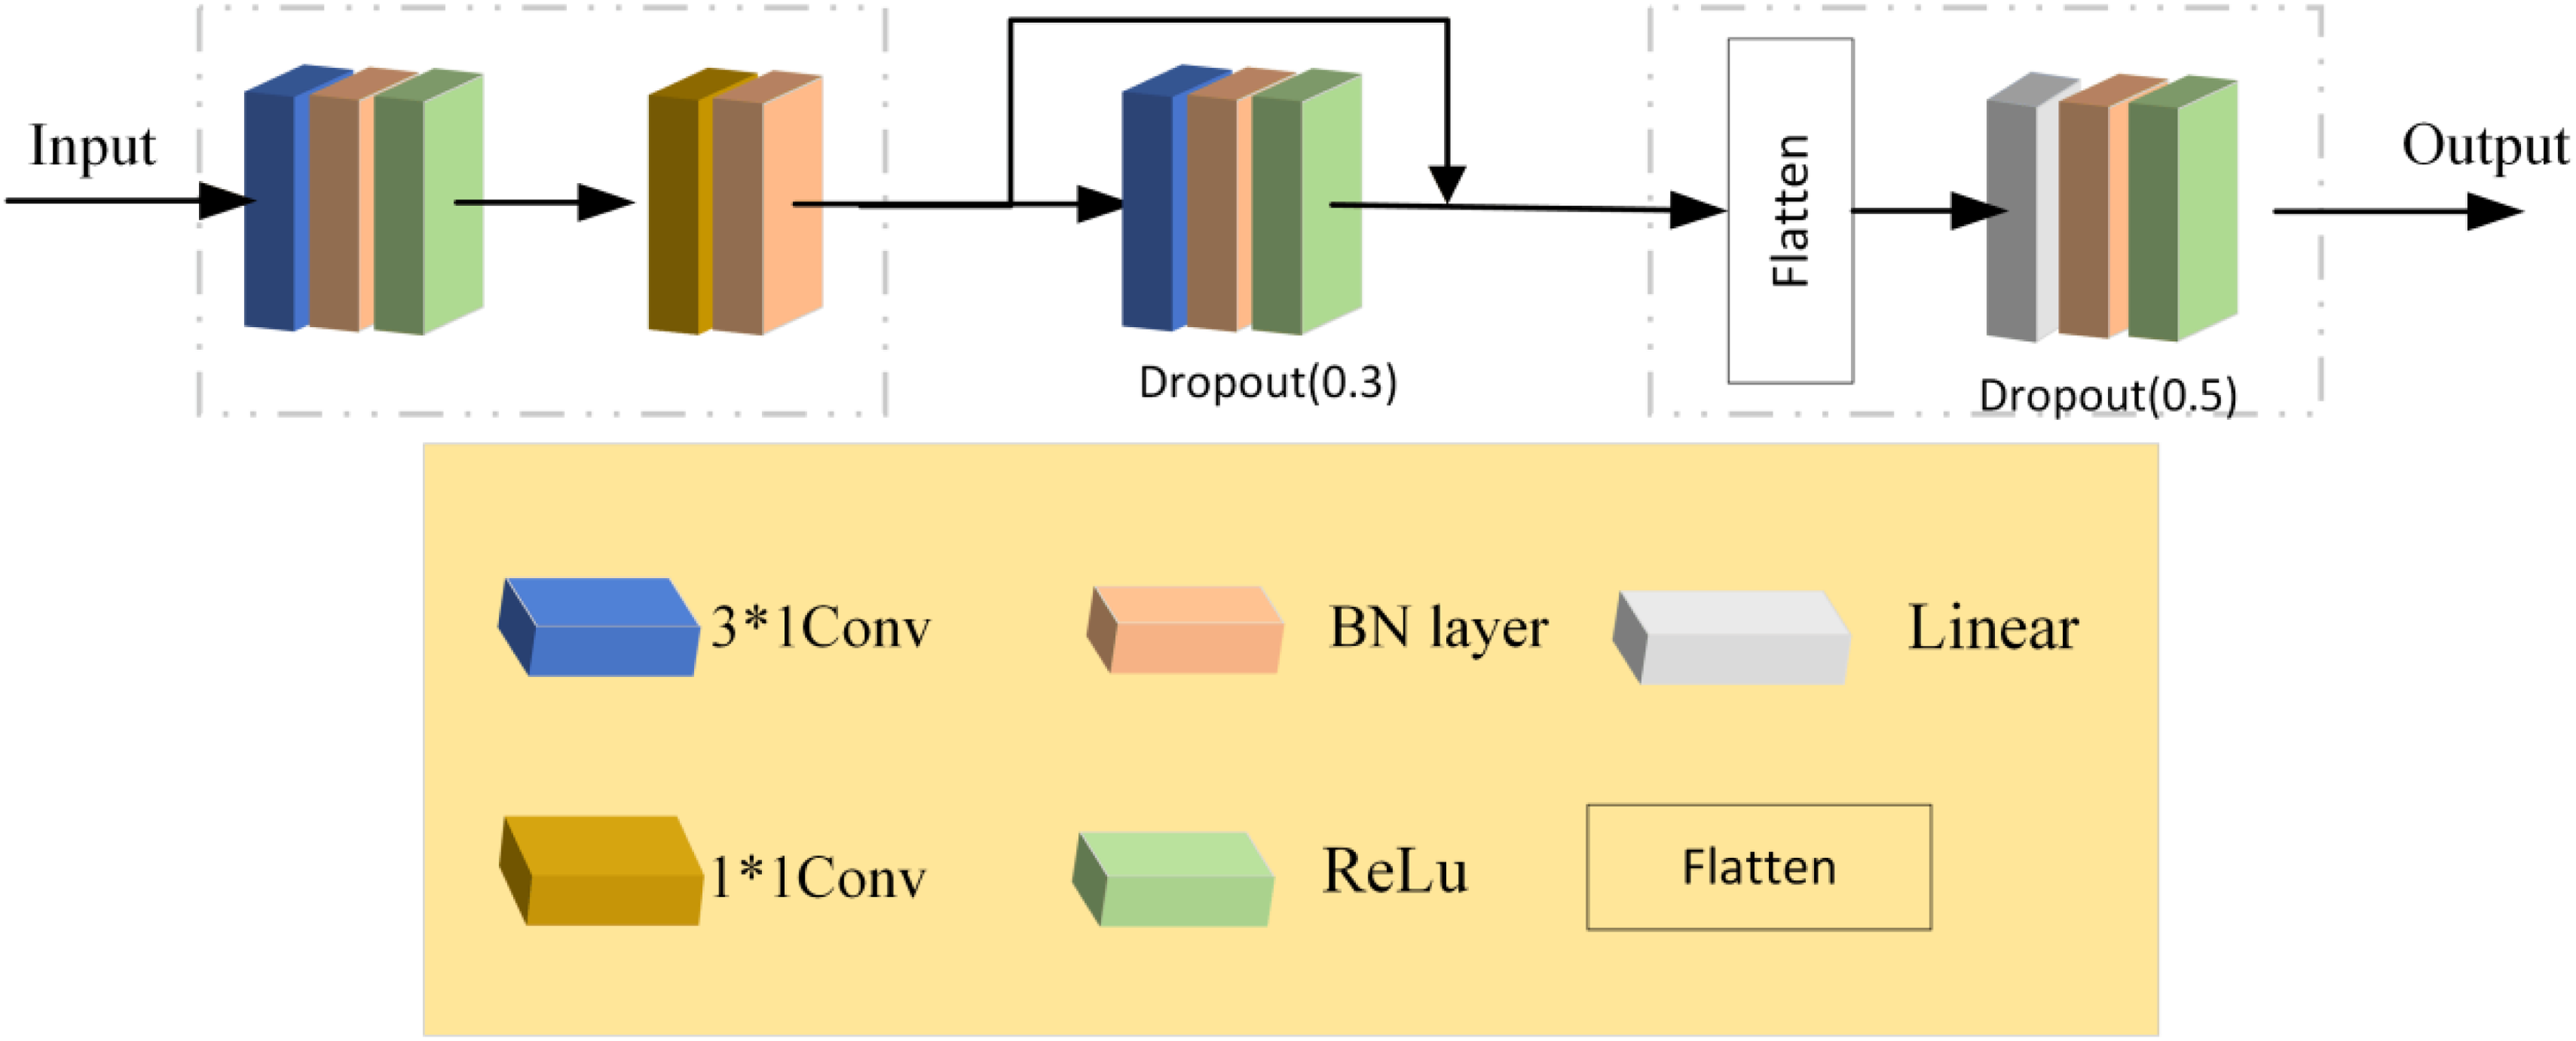
Improved DMR-CNN model architecture diagram.
The input tensor with shape (batch_size, 1, n_features) first passes through the initial convolution block,which uses 3 × 1 convolution kernels with padding = 1 to maintain the feature dimensions, followed by BatchNorm1d and ReLU activation functions. The innovative design lies in the downsampling residual block: the main path downsamples the features using a 3 × 1 convolution kernel with stride = 2, while the skip connection applies a 1 × 1 convolution kernel with stride = 2 to match the channel dimensions (from 64 to 128). These are then fused via element-wise addition according to formula (1):
The flattened features are then processed through two fully connected layers (one with 256 dimensions and the final output layer with 2 dimensions), with Batch Normalization, ReLU activation, and a 50% dropout layer in between. The model optimization employs a class-weighted cross-entropy loss function, where the weights are inversely proportional to the class frequencies in the training set. The AdamW optimizer is used, with an initial learning rate of 5 × 10⁻⁴, a weight decay coefficient of 1 × 10⁻⁴, and momentum parameters β1 = 0.9 and β2 = 0.999. A learning rate scheduler (ReduceLROnPlateau) is adopted, which reduces the learning rate by a factor of 0.5 if the validation loss does not improve for 3 consecutive epochs. The training process is divided into two stages: during the first 30 epochs, only the parameters of the main convolutional path are trained (while freezing the skip connections). In the subsequent epochs, all parameters are unfrozen for joint optimization. Training is conducted for a maximum of 120 epochs, with early stopping (patience = 10) based on validation loss, and a batch size of 64. This architecture effectively mitigates the vanishing gradient problem through residual connections, making it particularly suitable for modeling long-term sequence features in elderly depression prediction tasks.
Results
Baseline characteristics of participants
From 19,230 CHARLS participants in 2018, 3232 rural individuals met inclusion criteria; 1259 (38.9%) had CES-D10 ≥ 10 (depressed). In the overall cohort, 38.10% were female, 85.00% married, 70.70% had junior high or below education, 6.70% rated health as very bad, and 43.80% had a disability. Variables significantly differed between depressed and non-depressed groups (P < 0.001). Table 3 presents detailed baseline characteristics.
Comparison of baseline data between the depression group and the non-depression group.

Feature selection
The original CHARLS dataset contains more than 100 variables encompassing socio-demographic, behavioral, physical health, and psychological indicators. In total, 19 candidate predictors were initially selected based on theoretical frameworks, prior to empirical findings, and their availability in the CHARLS dataset. In the training set, the presence or absence of depression was taken as the dependent variable (yes = 1, no = 0), and preselected depressive risk factors for elderly hypertensive patients were used as independent variables. Lasso regression was employed to select the risk factors. As shown in Figure 3A, the coefficients of the independent variables in the model gradually shrink from the beginning. Figure 3B demonstrates that, through 10-fold cross-validation, the value of λ + 1, which minimizes the error, was selected as the optimal value. To reduce dimensionality and prevent overfitting, we applied Least Absolute Shrinkage and Selection Operator (LASSO) regression with 10-fold cross-validation. This process yielded 9 key predictors that were ultimately included in the final machine learning models. The 9 key predictive factors were identified, including Age, Episodic memory, Delayed memory, Gender, Marry-Marital Status, Disabilities, Exercise, Chronic, and Pain.

LASSO regression results: (A) Optimal λ selection; (B) variable coefficient paths.
Model performance
To ensure fair model comparison and prevent development bias, standardized hyperparameter tuning strategies were applied separately for traditional machine learning models and deep learning models. All tuning procedures were conducted within a 10-fold cross-validation framework.
For traditional machine learning models (Logistic Regression, XGBoost, Random Forest, Decision Tree, and SVM), grid search with an internal 3-fold cross-validation (GridSearchCV) was performed on each training fold of the 10-fold cross-validation to determine the optimal hyperparameters.
For deep learning models (DMR-CNN, CNN_NoResidual, and SimpleCNN), fixed architectures were adopted (see Table 2). In each fold of the 10-fold cross-validation, 10% of the training data was set aside as a validation set. The models were trained using an Adam optimizer (learning rate = 0.0005, weight decay = 0.0001) and employed early stopping based on the validation loss (patience = 10) as well as a learning rate scheduler (ReduceLROnPlateau, patience = 3) to prevent overfitting.
As shown in Figure 4, the six models achieved AUC values ranging from 0.788 to 0.899, with the improved dual-module residual DMR-CNN attaining the highest AUC (0.899) and the decision tree the lowest (0.788). We also assessed additional performance metrics including accuracy, sensitivity, and specificity, as detailed in Table 4.
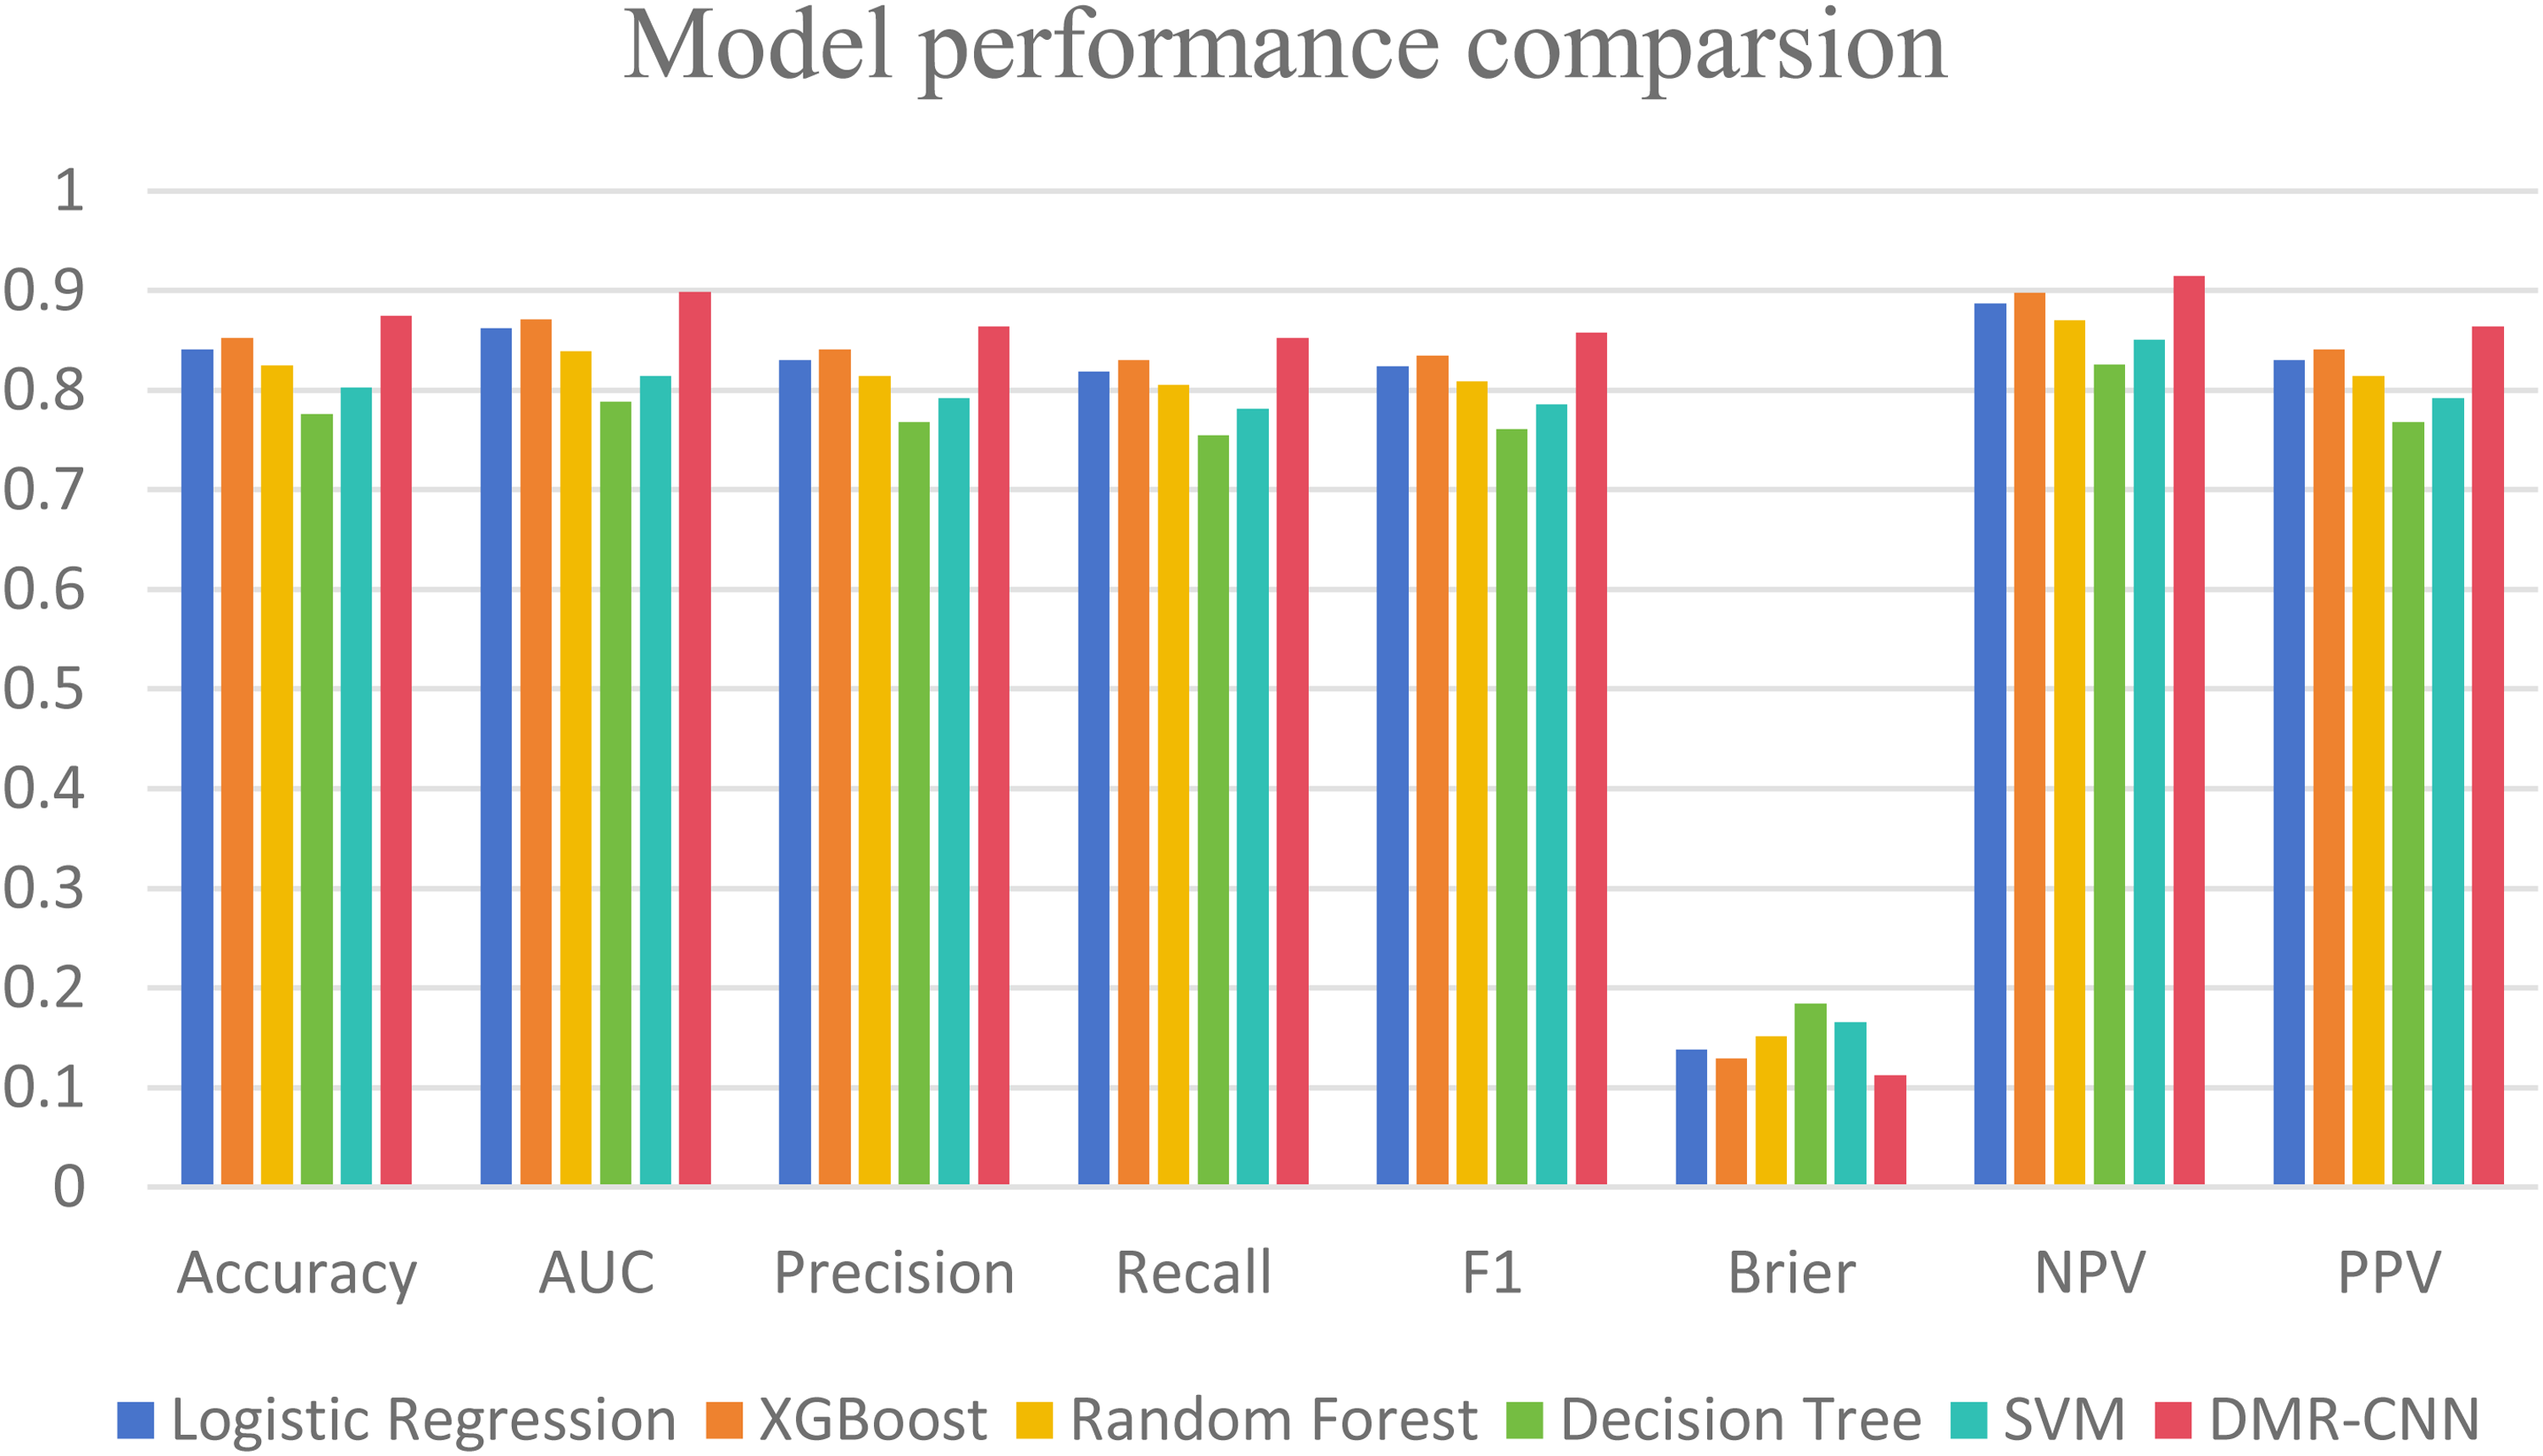
Model performance comparison diagram.
Predictive performance of five machine learning models for depression in Chinese rural elderly.

All six prediction models were constructed based on nine selected variables. The ROC curve comparison (Figure 5) revealed significant differences among the algorithms: the DMR-CNN curve was closest to the top-left corner and achieved a true positive rate of 80% at a false positive rate of 15%, demonstrating excellent early detection capability; XGBoost (AUC 0.871) and LR (AUC 0.862) formed the second tier—XGBoost exhibited the steepest slope in the 0–0.2 false positive rate range, making it suitable for high-specificity scenarios, while random forest showed stable growth in the 0.3–0.5 range, balancing sensitivity and specificity; SVM (AUC 0.814) performed moderately, with a sharp increase in the 0.4–0.6 range, suggesting strength in detecting moderate depression.

Predictive performance of six machine learning models for depression in older adults. ROC curve (the x-axis indicates the false positive rate, and the y-axis represents the true positive rate).

DCA curve (the x-axis indicates the threshold probability, and the y-axis represents net benefit).
Calibration curve analysis (Figure 7) demonstrated differences in probability calibration performance among the machine learning models. XGBoost and DMR-CNN exhibited the best calibration, with predicted probabilities closely matching observed event rates in the moderate-risk interval, with deviations not exceeding 5%. Random forest slightly underestimated risks in the low-risk interval and overestimated by approximately 8% in the high-risk interval. SVM and decision tree showed pronounced biases: SVM systematically underestimated risk across the entire range, whereas decision tree produced a “sawtooth” pattern, indicating unstable probability outputs. For clinical decision-making requiring accurate probability estimates, XGBoost or DMR-CNN should be prioritized, particularly for populations at moderate to high predicted risk values (0.4–0.8), where their Brier scores were 0.15 and 0.13, respectively, significantly outperforming other models (P < 0.01). If conservative prediction (e.g., exclusionary screening) is emphasized, random forest's robustness in the low-risk interval offers additional clinical utility.

The figure depicts the calibration curves for the test set.
Ablation experiment
To further validate the effectiveness of the proposed DMR-CNN architecture, we conducted an ablation study aimed at quantifying the contribution of key architectural components—particularly the residual connections and deep convolutional structures—to overall model performance.
Two simplified CNN architectures were introduced as comparative baselines:
SimpleCNN: A basic, shallower CNN model used as a baseline for architectural complexity. CNN_NoResidual: A model identical to DMR-CNN in all aspects except that the residual connections were removed.
All models (DMR-CNN, CNN_NoResidual, and SimpleCNN) were trained and evaluated under the same 10-fold cross-validation framework to ensure fairness and consistency.
As shown in Table 5 (updated), the comparative results clearly highlight the superiority of our proposed model. DMR-CNN consistently outperformed both ablated variants across all major evaluation metrics. Specifically:
DMR-CNN (AUC: 0.899) achieved significantly higher performance than SimpleCNN (AUC: 0.642), demonstrating the effectiveness of the deeper and more refined convolutional design in capturing complex feature patterns. DMR-CNN (AUC: 0.899) also outperformed CNN_NoResidual (AUC: 0.791), providing strong evidence of the critical role of residual connections, which mitigate gradient vanishing and enable more effective learning of deep hierarchical dependencies within the data.
AUC results of the ablation experiment.

In summary, the ablation study confirms that the superior performance of DMR-CNN is not coincidental but arises from the synergistic effect of its carefully designed architectural components—particularly the inclusion of residual modules.
Feature importance analysis based on SHAP values
Based on SHAP value analysis of feature importance (Figure 8), the impact of each feature on the DMR-CNN depression prediction model exhibited significant heterogeneity. The SHAP value distribution for Pain spanned the widest range (approximately −0.2 to 0.4), indicating a strong bidirectional influence on model outputs: higher pain levels were positively associated with depression risk, while lower pain levels showed a negative association. The SHAP values for Gender and Chronic disease variables were predominantly positive, suggesting that female sex and multiple chronic conditions are consistent risk factors for depression. Disabilities and Delayed memory exhibited similar trends, where higher dysfunction and memory decline values corresponded to increased depression risk. Conversely, the SHAP values for Exercise were mostly negative, indicating a protective effect of higher exercise frequency against depression. The effects of Age and Marital status were smaller but heterogeneous, with certain older or unmarried subgroups showing positive SHAP values. Episodic memory demonstrated a slight protective effect at lower values. Overall, this plot reveals the nonlinear contributions and directionality of different features at the individual level, providing a basis for model interpretability and personalized interventions. The model highlights that the combined effect of pain and chronic disease is a core driver of depression risk, while the interaction between sex and age underscores how social structures amplify biological vulnerabilities, suggesting that clinical interventions should integrate pain management, chronic disease prevention, and social support network reconstruction.

SHAP of the model. (A) Characteristic attributes in SHAP. The abscissa is the SHAP value, and each line denotes a feature. Higher eigenvalues are indicated by red dots, and lower eigenvalues are indicated by blue dots.(B) Importance ranking plot.
Discussion
This study developed the DMR-CNN model to predict depression risk in rural Chinese older adults using the 2018 CHARLS data. 58 Compared with traditional models such as logistic regression, random forest, and XGBoost, DMR-CNN outperformed them in AUC, accuracy, and calibration. Nine key features were selected using LASSO regression. Interpretability analysis identified the most influential predictors as gender, episodic memory, and pain, providing both theoretical support for model explainability and potential intervention targets. Given the high prevalence of mental health issues and the lack of services in rural areas, this model offers a practical tool for early depression screening in this vulnerable population, with promising clinical utility.
The superior performance of DMR-CNN lies in its unique 1D convolution feature extraction. Traditional models assume linear or independent feature relationships, whereas 1D-CNN treats the input features (e.g., age, pain, and gender) as a vector and learns high-order, non-linear interactions. For example, a convolution kernel may identify risk combinations like “high pain, low cognitive ability, and living alone,” providing far better predictions than individual features. Ablation experiments (Table 5) show that residual connections are critical, allowing the model to learn deeper interactions while retaining original feature information, effectively alleviating gradient vanishing issues. This ability to automatically learn complex interactions enables DMR-CNN to uncover deeper patterns than traditional models.
Depression risk prediction models that integrate cognitive assessments and self-reported health variables perform well on cross-sectional data. We used LASSO regression to identify risk factors 59 and built models using nine key predictors. The DMR-CNN model achieved the best AUC, significantly outperforming other models. SHAP analysis 60 revealed that sex, episodic memory, pain, and age were the most important predictors of depression.
We selected predictors from sociodemographic factors, 61 health status, 62 behavioral factors, 63 and psychological variables, 64 based on previous research showing their impact on depression in older adults. Among these, the relationship between sex and depression in the rural elderly is particularly notable. Studies consistently show that elderly women have a higher risk of depression, influenced by physiological, psychological, and sociocultural factors. In rural areas, women often face lower socioeconomic status, limited education, and a lack of social support. Traditional gender roles further increase their vulnerability to helplessness and loneliness in the face of widowhood, illness, or financial hardship. Physiologically, menopause-related estrogen decline may also increase susceptibility to mood disorders. A study by Wang et al. 65 found that depressive symptoms were significantly more common in rural women, with the education level and social support moderating the effects. Additionally, Luo et al. 66 highlighted that rural elderly women face greater barriers to social participation and access to public services, further limiting mental health improvement opportunities. Thus, rural elderly women are a high-risk group for depression, and gender-sensitive psychological interventions are crucial for alleviating their mental health burden.
In this study, we divided cognitive ability into three components to assess their impact on depression. Memory decline and depression have a bidirectional relationship: memory impairment can worsen self-care and social interactions, leading to loneliness and helplessness, which may trigger depressive symptoms. 67 Conversely, depression can disrupt hippocampal neuroplasticity and neurotransmitter balance, further impairing memory processes and creating a vicious cycle. Longitudinal studies show that rural elders with poor self-rated memory are at a higher risk of depression, especially those with lower educational levels. The lack of social participation and decreased life satisfaction partially mediate this relationship, suggesting that interventions should focus on both cognitive training and social support. 68 Cross-regional surveys have found that cognitive decline and depressive symptoms accelerate the decline in physical and mental health in rural elders, significantly reducing their quality of life.
Our results reveal a bidirectional relationship between chronic pain and depression in the rural elderly. Chronic pain is a significant depression risk factor and commonly co-occurs with depression, especially in rural areas with limited healthcare access. Pain impairs daily functioning, social participation, and quality of life, leading to loneliness and helplessness, thereby exacerbating depression. 69 Conversely, depression increases pain sensitivity, intensifying pain and forming a vicious cycle. Studies on Chinese rural elders show that chronic pain, especially multisite and long-duration pain, significantly increases the depression risk. Pain intensity correlates with depression severity: the more severe the pain, the higher the depression scores. 70 In rural areas, insufficient medical resources and lower health awareness often prevent effective pain management, exacerbating psychological issues. Early identification and comprehensive pain management are essential to prevent depression in this population.
Chronic diseases also correlate with depression in the rural elderly. Individuals with multiple chronic conditions (e.g., hypertension and diabetes) are more prone to depression due to physical discomfort and functional limitations, significantly increasing depression risk. 71 The relationship follows a dose–response pattern: the more chronic diseases, the higher the depression risk. Chronic diseases also reduce life satisfaction and self-efficacy, with this mediating effect being more pronounced in rural areas with limited healthcare access. 72 Therefore, mental health interventions for rural elders should address both chronic disease management and psychosocial support to reduce depression risk effectively.
One key advantage of this study is its high operability and low computing costs, making it suitable for resource-constrained environments. The model relies on only nine easily accessible clinical and demographic features, which can be quickly collected through simple inquiries without expensive tests. Once trained, the model (whether DMR-CNN or XGBoost) requires only milliseconds to make predictions and can be deployed on standard PCs, web servers, or mobile devices without special hardware.
Therefore, the model serves as a low-cost, efficient triage tool. In rural clinics with limited medical resources, general practitioners can use this tool to quickly identify high-risk individuals, ensuring that scarce mental health resources (such as detailed assessments and expert consultations) are allocated effectively for early intervention.
Limitations
This study developed a depression risk prediction model for rural elderly populations in China using machine learning on CHARLS data, demonstrating robust predictive capabilities. However, several limitations exist. First, the extended CHARLS dataset may affect model stability as participants’ conditions change over time. Second, key variables—such as social support, family relationship quality, and coping strategies—were omitted due to data limitations. Third, although SHAP analysis elucidated feature contributions, the “black-box” nature of machine learning restricts clinical interpretability. Finally, the model's generalizability requires further validation, as data shifts across regions or time periods could reduce prediction performance. Consistent with the recent findings of Wang and Cao, 73 our study highlights the importance of assessing bias and fairness in ML-based depression prediction models. Although the observed subgroup differences were small, continued monitoring of potential algorithmic bias is essential to ensure the equitable use of such predictive tools in diverse populations. While we used a robust 10-fold cross-validation to assess internal validity, external validation remains a critical limitation. The model's performance on other CHARLS waves or on data from different regions (e.g., northern vs. southern rural China) is untested and crucial for future work.
Conclusion
This study employed various machine learning algorithms to construct models and introduced a DMR-CNN prediction network based on a dual-module residual network to predict the risk of depression in rural middle-aged and elderly populations. After evaluation and comparison, the proposed model demonstrated the highest predictive performance. Healthcare professionals can use these identified risk factors to develop targeted intervention strategies and implement them early, thus mitigating the adverse effects of depression on rural elderly populations.
Footnotes
Acknowledgments
We thank the China Center for Economic Research, National School of Development at Peking.
Ethical approval
The studies involving humans were approved by the Institutional Review Board of Peking University (IRB00001052-11015). The studies were conducted in accordance with the local legislation and institutional requirements. The participants provided their written informed consent to participate in this study.
Contributorship
YW: conceptualization, data curation, writing—original draft, and writing—review & editing. YP: data curation and writing—original draft.
Funding
The authors received no financial support for the research, authorship, and/or publication of this article.
Declaration of conflicting interests
The authors declared the following potential conflicts of interest with respect to the research, authorship, and/or publication of this article: The authors declare that the research was conducted in the absence of any commercial or financial relationships that could be construed as a potential conflict of interest.
Data availability statement
Publicly available datasets were analyzed in this study. The datasets presented in this study can be found in online repositories. The names of the repository/repositories and accession number(s) can be found below: The datasets generated for this study can be found in the China Health and Retirement Longitudinal Study (CHARLS) online datasets (![]() ).
).
Publisher's note
All claims expressed in this article are solely those of the authors and do not necessarily represent those of their affiliated organizations, or those of the publisher, the editors and the reviewers. Any product that may be evaluated in this article, or a claim that may be made by its manufacturer, is not guaranteed or endorsed by the publisher.