
Abstract

INTRODUCTION
Much has been written regarding automation of general reference and hospital laboratories. Spectra Laboratories is a specialty laboratory with the majority of specimens originating from dialysis centers. Since dialysis patients tend to require a relatively consistent test menu, our laboratory presents unique challenges and opportunities in the development of automation systems.
We have conventional types of automation in those areas of our laboratory which more easily lend themselves to automation. This will be discussed in Part I of this article. We have taken a slightly different approach in other areas that are more difficult to automate, due in part to the nature of the dialysis patient. Here we have automated processes using the capabilities of our LIS, but without sample transportation using mechanical arm or line technology. This will be discussed in Part II.
The unique nature of dialysis patient testing starts with the characteristic progression of disease in the dialysis patient. Loss of kidney function may result in a number of co-morbid conditions including anemia, bone disease, and heart disease. The nature of these ailments tend to be chronic, occult, and asymptomatic until the disease process has advanced significantly. In addition, the dialysis process itself may cause a variety of complications, with clotting problems due to the administration of heparin being the most significant for the laboratory.1
A PROFILE OF OUR LABORATORY
Spectra Laboratories receives blood samples from dialysis units located throughout the United States. Every month we process over 100,000 accessions and perform over 1,000,000 rests. Unlike a typical reference laboratory which tends to see a large variety of patients, Spectra Laboratories serves a continuing, chronically ill patient base. This means that we receive blood samples from the same patients each month, and in some cases, each week. The care givers of this patient group rely on 12 month cumulative reports to identify trends in patient results that might indicate a deterioration in the patient's condition. Because of the information provided to the client, and the interrelated nature of these patients' co-morbid conditions, we have a very unique review process. We not only review and repeat abnormal results, we compare abnormal findings to previous results and may cross check the values of different tests for the expected relationships between the results (e.g., making sure that an abnormal PTH-I is trending appropriately with the patient's changes in calcium values.) This type of ongoing monitoring can be very helpful in evaluating the results of therapy and for timely intervention when trends indicate a deterioration in the patient's condition.
PRIMARY CAUSES OF END STAGE RENAL DISEASE
DIABETES HYPERTENSION GLOMEROLONEPHRITIS
With this specialized focus we perform a large volume of tests with a more limited test menu. Because of this, Spectra might be considered an ideal laboratory to be automated. However, nearly every commercial automation vendor has analyzed our workflow and concluded that because of problems with fibrin, the cost of total automaton of this laboratory would be prohibitive and the likelihood of success questionable.
MAJOR CO-MORBID CONDITIONS OF RENAL DISEASE
CARDIOVASCULAR AND HEART DISEASE INFECTION MALNUTRITION ANEMIA COAGULATION DEFECTS BONE DISEASE HEPATITIS ENDOCRINE DISORDERS
FIBRIN
One of the most significant challenges to productivity in testing the blood of dialysis patients is the formation of fibrin in the serum.2 Fibrin can accumulate on probes and tubing, and make it difficult to automate any processes that involve serum samples. The fibrin makes it impossible to consistently automate pouring aliquots for testing. Despite our clients' best efforts to allow the tubes to clot and to spin down adequately, 40% still contain visible clots in their serum. We rim and squeeze the serum out of the clot, re-spin the blood, and filter the serum, all in order to eliminate the small clots and fibrin strands that are difficult to see and might interfere with testing. Additionally, minutes before samples go on an instrument, they are visually rechecked for clots. Even after these extensive procedures, 25% of the samples re-clot.
AUTOMATION CONSIDERED
Automation represents a significant expenditure for any company. There are both financial and operational risks. Any laboratory or business considering automation needs to establish specific goals which will be realized through such changes, while still considering costs and other factors within the company.3 Our goal was to increase quality, throughput, and efficiency in a cost effective manner, without significant capital outlay. In our specialized setting, these goals were achieved by focusing on results handling rather than specimen handling.
THE FILE BUILDERS
We assembled a team consisting of one person from each department, called the “File Builders”, to work on the development of a new LIS. This group was dedicated to development and implementation of the new LIS, and eventually to the “training of the trainers”, as we approached start up of the new LIS. The team was charged with development of computer algorithms for automation of currently manual result processes. Because of delays in implementation of the new LIS, many of the automation concepts developed by this group were eventually implemented in our current LIS, in spite of its age and seemingly limited capabilities. This is the story of how this was accomplished. Part I describes the process of automating our hematology department. Part II discusses how the File Builders' algorithms were incorporated into instrument interfaces. Part III discusses the future direction of automation for our company.
PART I: AUTOMATION AND RE-ENGINEERING OF HEMATOLOGY
Automation is seen as the primary industrial tool to increase productivity. In some business models, such as the auto industry, where there are a number of repetitive, manual tasks, automation has had a tremendous impact. There are many repetitive manual steps in the clinical laboratory industry that can be addressed by automation. There are also more manual result review steps in a dialysis laboratory than a typical reference laboratory. Our approach to hematology automation addressed both repetitive operations and manual review aspects simultaneously. The hematology department was automated using the Sysmex HST (Sysmex Corporation of America, Long Grove, IL) line in conjunction with the data manager, Hematology Sub-LIS (PC-DPS). We began consultation with Sysmex Corporation two years ago with the idea of increasing our productivity by installing their HST system to replace our current stand alone instrumentation. The HST system is a line concept using racks of tubes on a conveyer belt. Each module is controlled by a passive data management system referred to as the DE. The line can have any combination of SE9500 (automated hematology analyzer), R3000 (automated reticulocyte analzer), and SP-100 (automated slide preparation unit with staining), with the maximum number of modules being four instruments per line.
We began with three HST lines and an Alpha Unit, which was installed and functional within two days. One line had two SE9500s, one had three SE9500s, and a third had four R3000s for reticulocyte counting. The Alpha Unit, used for repeat testing and slide making, consists of a SE9500 and an SP-100. We are currently the largest Sysmex HST installation in the US.
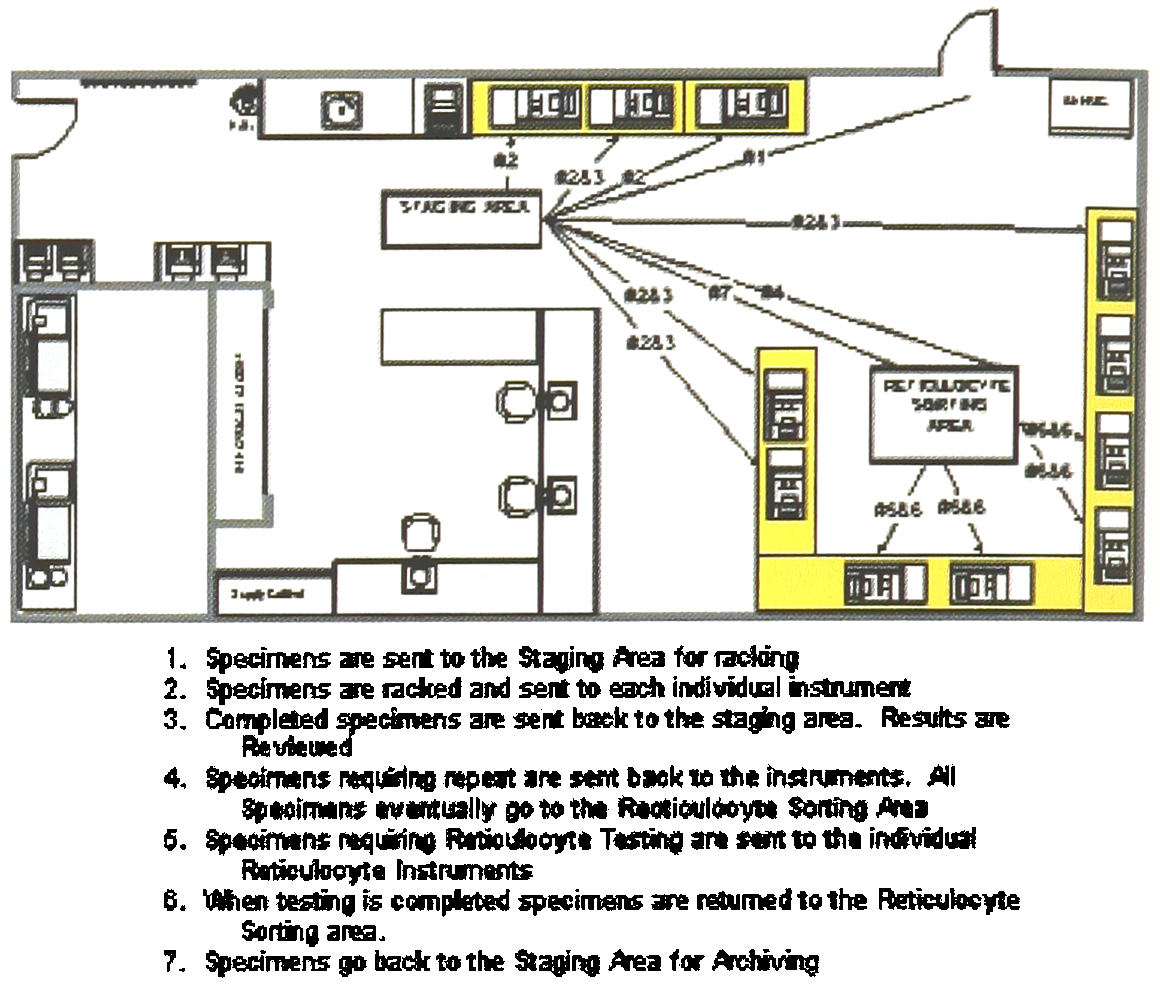
Pre-Implementation of HST Line
With this configuration throughput was somewhat improved. The DE received specific orders from the LIS and routed the samples through the various instruments. Once a test was completed, the SE9500 transmitted the result back to the LIS. A technologist still reviewed all of these results and determined which samples needed repeating. If a repeat or slide was needed, the sample was placed on the Alpha, a separate module containing an SE9500 and an SP-100. Once the second result was completed, it was compared to the original result for accuracy. Because the DE did not adequately track samples for a high volume laboratory, a program was developed in the LIS to assign rack placement. This allowed us to scan the tubes into pre-designated racks for easy retrieval.
Although this configuration improved productivity somewhat, manual retrieval of specimens and other limitations of the HST-DE system prevented significant productivity gains. At this point, Sysmex suggested that we look at their newest product, the PC-DPS. This product, developed in Japan, had not yet been tested in the US market. We agreed, and aggressively worked on integrating the PC-DPS into our laboratory. The PC-DPS has the capability to customize repeat criteria and then repeat only those samples that fall out of the acceptable limits.
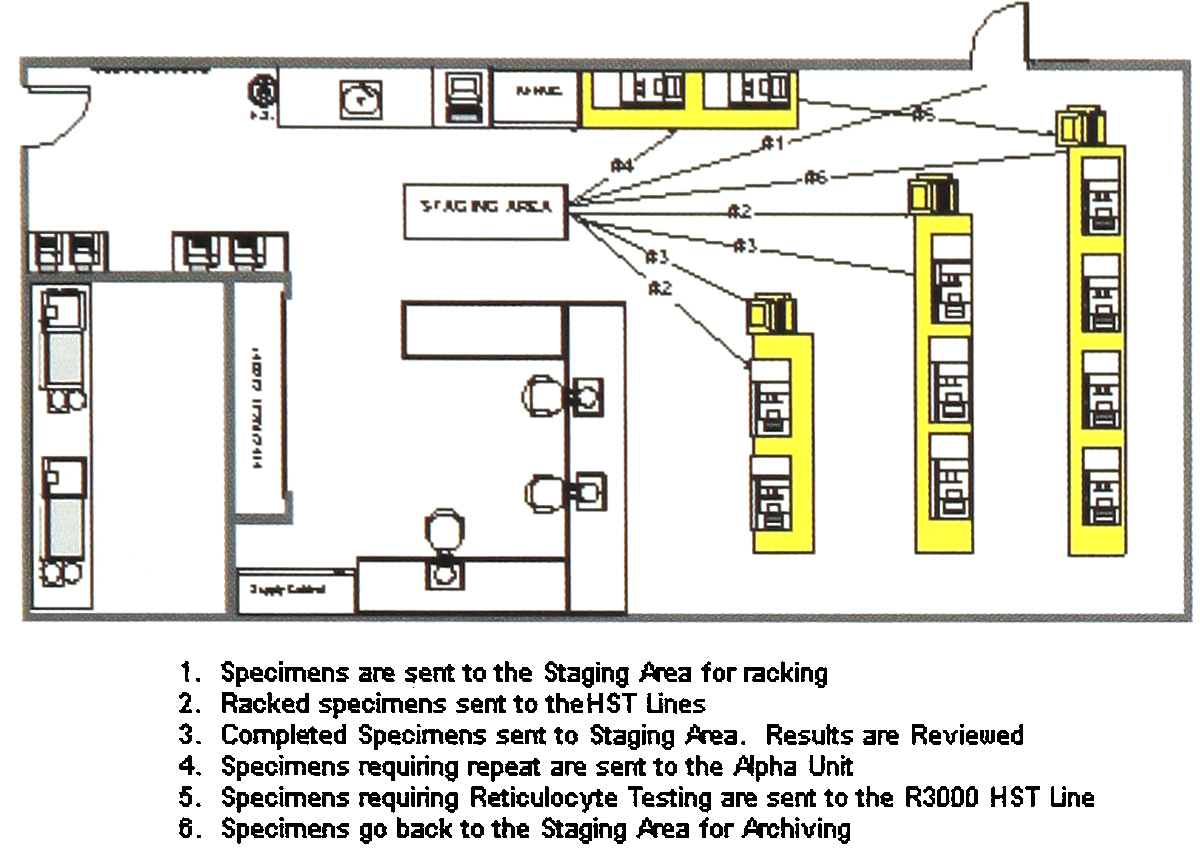
The File Builders took the features of the PC-DPS and enhanced the ability of the system beyond the Sysmex original design by incorporating some of the algorithms previously developed for use with the new LIS. The final instrument configuration includes primary hematology analyzers, repeat analyzer, SP-100, and reticulocyte analyzers. Each sample is introduced at the front of the HST line, run through the line, and all testing is completed when the sample reaches the end of the sample line.
Implementation of HST Line — Phase 1
PHASE 1
The first phase of implementation involved development of the repeat criteria in the DPS, as well as interfacing the PC-DPS to our LIS.
The system comprises HST lines, with 1 to 4 instruments on each line, interfaced through the PC-DPS. After tests are run on the first group of instruments, the results are automatically compared to the pre-established review criteria set up in the DPS. Any results falling outside of the review criteria are automatically repeated on the second group of integrated instruments.
Once all of the communication issues were resolved and repeat criteria verified, Phase 1 was completed. The medical technologist still had to review the worklist and determine which tests required repeat analysis. The advantage was that the sample would have already been repeated, and the slide already made. The technologist was still required to go to the PC-DPS in order to compare repeat results, but the task of finding samples and placing them on the Alpha was eliminated. Over the two years needed to complete the first phase of implementation of the HST and re-engineering of our processes, increased efficiency permitted us to decrease the number of full time employees in the department by 50%, primarily through attrition.
PHASE II
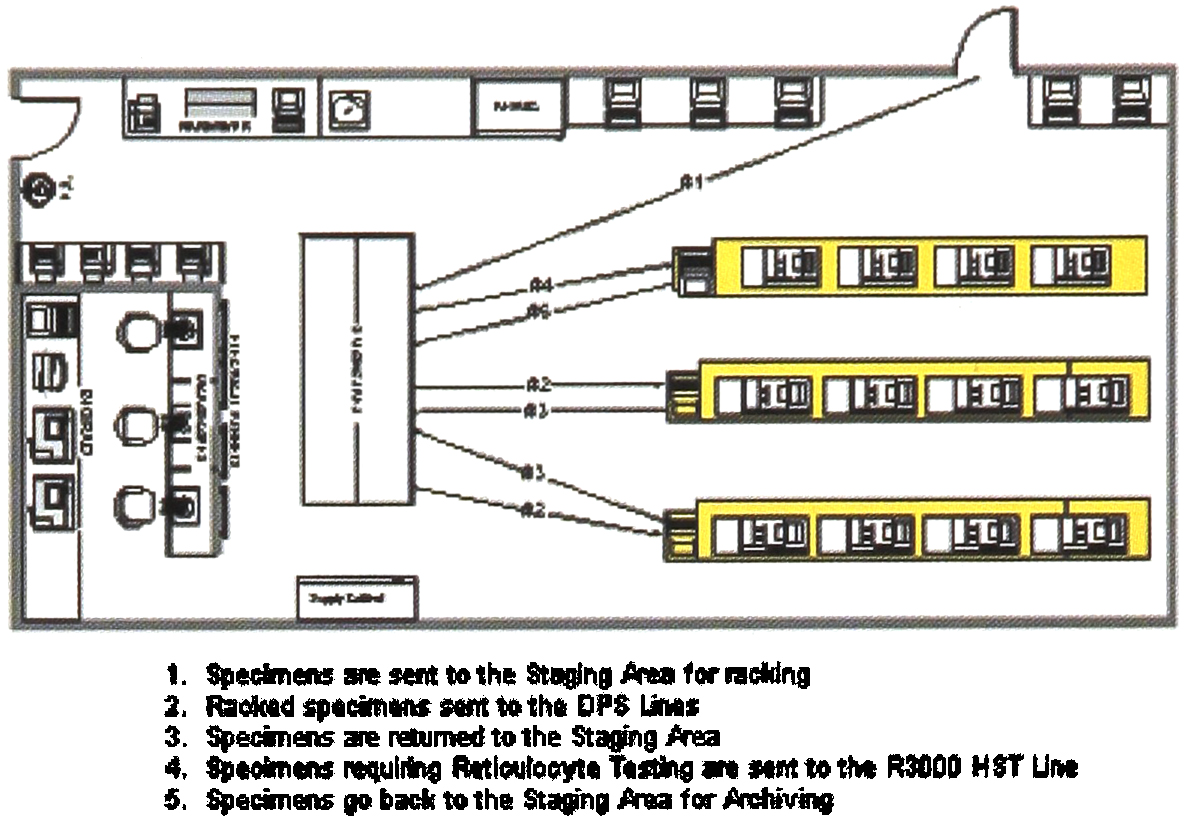
The second phase of PC-DPS implementation actually took place in our LIS. We were restricted by a 10 year old MUMPS, version 2.0 LIS (the current version is 5.0). Since maintenance and programming of the system has been performed by in-house personnel, we have maintained the flexibility to customize the system to our specific clinical, technical and billing needs over the years, a capability that we might not have if we had used a secondary vendor. In seeking ways to create further efficiencies, we decided to attempt automation of the review process. With completion of Phase 1, the PC-DPS automatically decided what tests to repeat based on repeat criteria we placed in the Data Manager.
Implementation of HST Line — Phase 2
But the technologist still had to review all results, acceptable as well as unacceptable. Our goal was to have questionable results automatically selected for technologist review rather than having to review all results. Conceptually, our idea was to separate results into three categories, 1) acceptable, 2) repeated and found to be acceptable, and 3) repeated and found not to be acceptable. In order to accomplish this, we had to program our US to enable the technologist to see both initial and repeated results simultaneously. Our Medical Director had previously set acceptability limits on repeated results. With the new programming, these same rules are applied automatically by the LIS. Repeated tests yielding results which are within acceptable criteria are automatically transmitted to the patient file. Repeats that fall out of the acceptability range go to a third worklist where the medical technologist more thoroughly reviews the results and takes appropriate action.
TRACE ELEMENTS TESTED IN WATER ANALYSIS
ALUMINUM
ARSENIC
BARIUM
CADMIUM
CALCIUM
CHROMIUM
COPPER
COPPER
LEAD
MAGNESIUM
MERCURY
POTASSIUM
SELENIUM
SILVER
SODIUM
ZINC
Completion of Phase 2 allowed us to meet the goals of having the medical technologists focus on those results that really require scrutiny and action. This increases quality, since the medical technologist no longer has to scan through acceptable and non acceptable results We audit the process periodically, as required by accrediting agencies, in order to be certain that all results are evaluated correctly.
PART II — AUTO-EDIT
One of the areas that is unique to a dialysis laboratory is trace water analysis. The water used in dialysis must meet specific standards of purity in order to be used for making dialysate.4 In the dialysis process, dialysate is circulated adjacent to the patient's blood for removal of toxic substances by osmosis. If the water is not pure, trace elements can be introduced into the patient's blood stream, potentially at toxic levels. Special instrumentation is required for this type of testing. Spectra Laboratories uses Inductively Coupled Argon Plasma Mass Spectrophotometry (ICAP-MS) for this testing, ICAP-MS is a highly sensitive and specific methodology. The Hewlett Packard ICAP-MS provides a greater level of automation than has been available in the past. Unlike previous technology, the HP ICAP-MS can auto-start each morning, and can run through most of the night without intervention. With 16 trace elements being measured simultaneously, result review can be very time consuming.
Implementation of HST Line — Phase 3
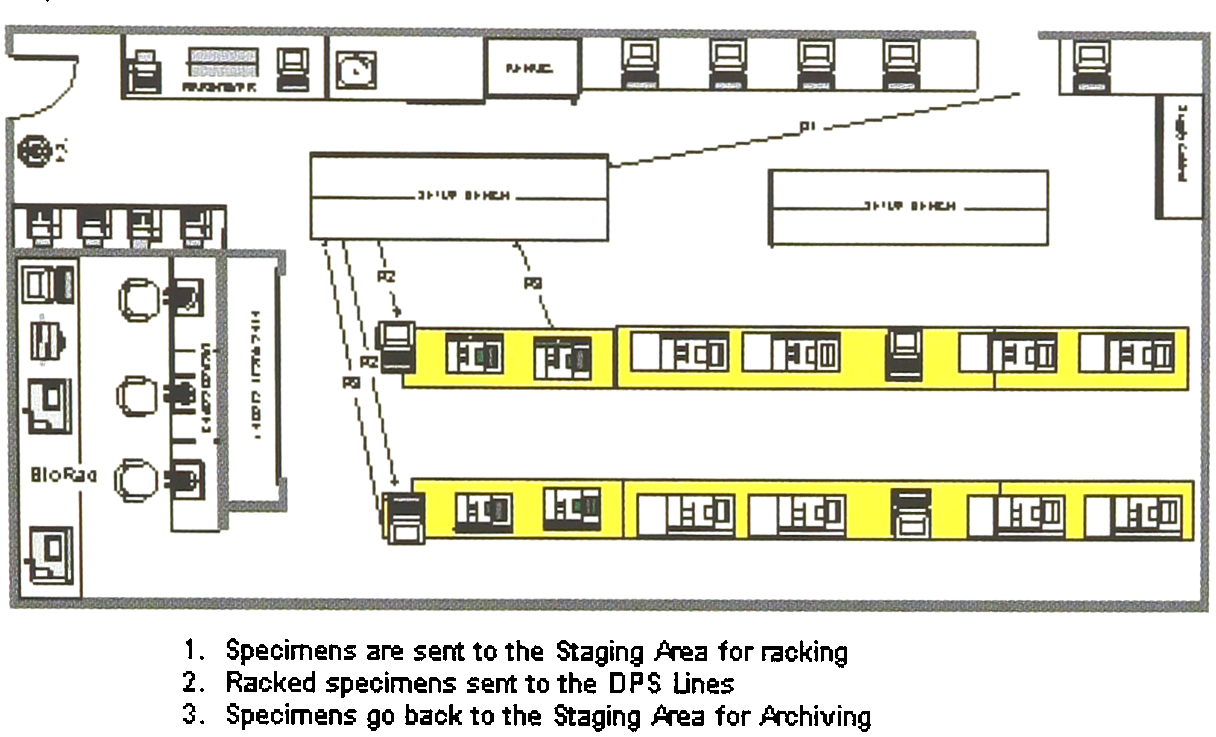
We decided to implement the automated review process that had originally been planned for our new LIS. Again, the process is meant to eliminate review of acceptable results, those repeated and acceptable, and to indicate which repeated results require further action. In order to be truly automated, quality control needs to be integral to the auto-edit review process. Unlike Hematology controls which are run every eight hours, the ICAP-MS runs quality control material every ten samples. In this situation the challenge was to link quality control acceptability to results so that the QC meets acceptable criteria before any automated result review process takes place. Using both the ICAP-MS's data management capabilities and the expert technology of our LIS, we successfully developed a cascading series of algorithms that tie each sample to a QC run.
Once QC is found to be acceptable, both single and repeated results are sent to the LIS. Each result is then automatically analyzed for acceptability. Acceptable single results as well as repeated results that fit the repeat criteria are sent to the final worksheet. Those repeated results that do not meet acceptability criteria are sent for technologist review, and the technologist takes appropriate action to resolve any problems. Once again, this method achieved our goal of directing technologist review to results that are questionable and require action. We have applied this logic to our Hitachi 747 and plan to expand this enhanced interface technology to our Chiron Centaur, Nichols CLS, and other high volume instrumentation.
FUTURE DIRECTION
Automation remains in its infancy. Beginning with robotic arms, it has progressed to track and line technology, and some say, will end with point of care testing. 1 However, total lab automation in the United States remains expensive and not always reliable.5 We must successfully deal with the economic and business challenges of the present. In the current environment of limited capital and decreasing reimbursement we must often use the resources we have at hand. We have taken advantage of automation where it was feasible and affordable. Additionally, we have used our computer technology to automate our extensive review process. As a laboratory specializing in dialysis patient testing, our future rests with providing quality testing services, decreasing hospital patient days, improving patient outcomes, and ultimately prolonging the life of our dialysis patients, all in a cost effective manner. We feel that the next step in laboratory automation is the data management of patient testing results. By automating the analysis of relationships between results and indicating clinical trends which may not be immediately apparent, the services of a specialty laboratory become an important factor in patient treatment decisions, more than simply providing test results