
Abstract
We describe the practical aspects of developing a semiautomated, higher-throughput plasma protein binding (PPB) assay. The assay has a capacity of 32 PPB measurements per screen using triplicate incubations per measurement, and it is flexible with respect to the number of compounds and the number of plasma types used. The described method is based on the 48-well format rapid equilibrium dialysis (RED) device in combination with a robotic liquid handling platform and quantitative bioanalysis. The RED device method was optimized with respect to equilibration time. Method validation was performed by comparison of results from the semiautomated RED PPB assay with both of those obtained using an alternative, manual equilibrium dialysis method and with literature values. Propranolol and warfarin were used as control compounds. We have modeled the effect of dialysis membrane leakage on the measured unbound fraction and implemented a test for measuring protein content in the buffer compartment to confirm the integrity of each insert of the RED device. With the described method, it is possible to screen a relatively large number of compounds for PPB in a drug discovery environment.
Introduction
The extent of plasma protein binding (PPB) can have a major impact on the efficacy and toxicity of a drug, because only the free drug is available for physiological interactions. 1 For compounds exhibiting extensive binding to plasma proteins, a relatively small change in absolute PPB can lead to a large-fold change in unbound fraction. Consequently, if PPB is decreased by, for example, disease or pregnancy, the level of unbound drug can increase to toxic levels. 2,3 PPB has an influence on pharmacokinetic parameters, such as volume of distribution and clearance. 1 The free fraction of drug in plasma (f u,plasma) is also an important input parameter in physiologically based pharmacokinetic and allometric scaling models and in pharmacokinetic/pharmacodynamic (PK/PD) models. 4 As a consequence, in recent years, the demand for the measurement of f u,plasma has substantially increased to an extent which cannot be fulfilled using conventional approaches.
There are a number of commonly used methods available for the determination of f u,plasma values; these include ultrafiltration, ultracentrifugation, gelfiltration, 5,6 and equilibrium dialysis. 7 However, equilibrium dialysis is the most amendable to automation, because it can be implemented using simple liquid handling techniques. We describe here the implementation and validation of a higher-throughput PPB assay, based on a new 48-well format rapid equilibrium dialysis (RED, ThermoFischer Scientific, Tournai, Belgium) device and automated liquid handling. The assay was designed to be fully flexible with respect to the number of compounds and the plasma types used.
The RED device consists of a 48-well Teflon base plate with disposable inserts (Fig. 1). Each insert contains a buffer and a plasma compartment separated by a semipermeable membrane with a molecular weight cutoff of approximately 8 kDa. In the assay format presented here, the RED device is filled with buffer and plasma. The plasma has previously been spiked to a final drug concentration of 5 μM. The drug is then left to equilibrate between the buffer and plasma compartments. At a predefined time point, the RED plate is sampled from both compartments. Samples are matrix matched for analysis by addition of either plasma or buffer. Calibration curves suitable for quantitative bioanalysis (BA) are generated with the robot during the incubation period of the RED device. Drug concentrations of plasma and buffer samples are then measured by liquid chromatography-mass spectrometry/mass spectrometry (LC-MS/MS) in single reaction monitoring (SRM) mode.
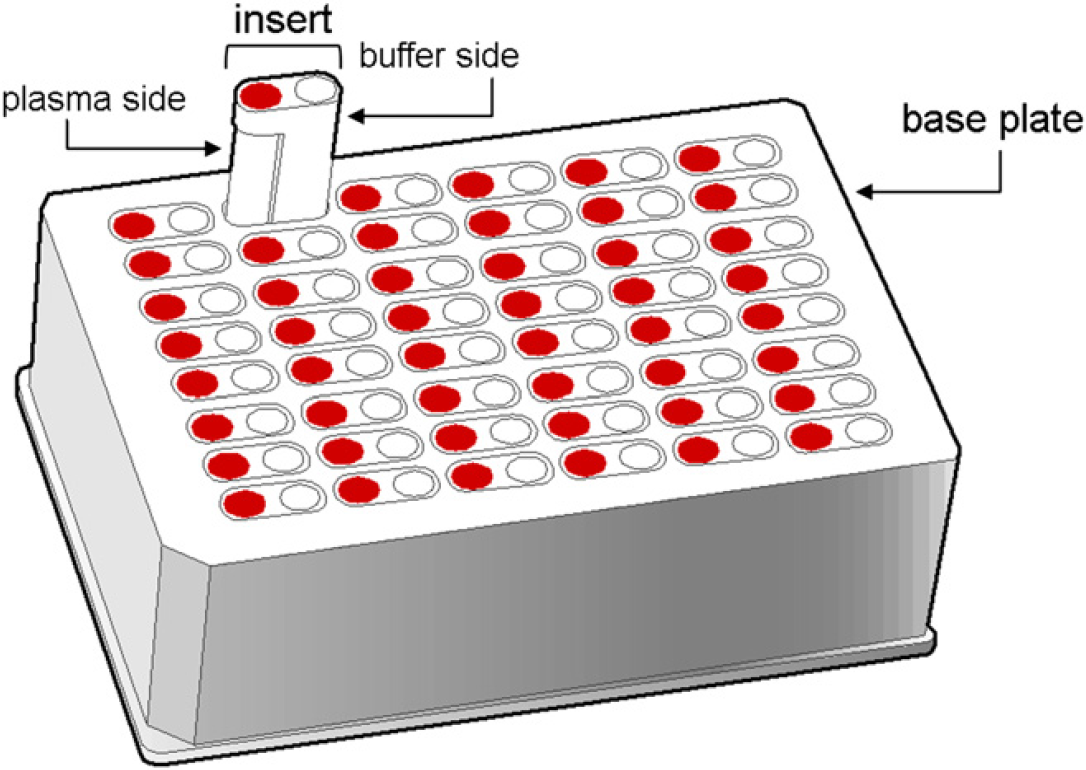
The rapid equilibrium dialysis device base plate and inserts.
The RED device itself has previously been validated by Waters et al. 8 However, this validation was not performed in combination with automated liquid handling or absolute quantitative BA. As part of the validation of our implementation, the equilibration time of the system was characterized using three chemically diverse compounds: propranolol, clozapine, and warfarin. Once optimal equilibration time had been established, the f u,plasma was measured using the semiautomated assay, for a set of marketed compounds for which literature data were available and for a set of in-house compounds for which f u,plasma had previously been measured manually using a Dianorm (Munich, Germany) equilibrium dialysis system. Comparison of literature data and in-house historical data with data obtained using the semiautomated RED assay showed excellent correlation. Finally, based on the observed distribution of f u,plasma data for the two control compounds propranolol and warfarin, assay acceptance criteria were defined. During the validation experiments, it was observed that some inserts showed leakage of plasma proteins into the buffer compartment, resulting in a significant impact on the measured free fraction in plasma (f u,plasma). Consequently, a final measurement of buffer protein content was introduced to the workflow to allow data from leaking inserts to be excluded. In conclusion, the semi-automated RED PPB assay is a robust assay suitable for the screening of f u,plasma for relatively large numbers of compounds in a drug discovery environment.
Methods
Materials
Propranolol, fluconazole, verapamil, naproxen, atenolol, warfarin, acetonitrile (MeCN), dimethyl sulfoxide (DMSO), formic acid (FA), and bovine serum albumin (BSA) were purchased from Sigma-Aldrich (Bornem, Belgium). The 12 proprietary compounds used for comparison of the RED device with the Dianorm system were synthesized in-house (Johnson and Johnson Pharmaceutical Research and Development, Beerse, Belgium). Pooled human male plasma (n = 3 donors) was purchased from Bioreclamation Inc. (Hicksville, NY) and was stored at −80 °C. Pooled dog plasma was obtained from the blood of male Beagle dogs, sampled in Li-heparinized tubes and centrifuged for 10 min at 1400 rpm at 4 °C (Eppendorf 5810R; New Brunswick Scientific, Rotselaar, Belgium). Analysis of the pH of thawed plasma samples confirmed previous observations that freezing and subsequent loss of CO2 from the plasma results in an increase in plasma pH over time, which is expected to have a significant effect on PPB. 9,10 The pH was measured before each run and adjusted to 7.4 by titrating with a 10% (v/v) solution of lactic acid in water (approximately 2 μL lactic acid solution per 10 mL plasma, depending on the pH shift). Phosphate-buffered saline (PBS), pH 7.4, was obtained from Gibco (Merelbeke, Belgium). The RED device base plates and inserts were obtained from Thermo Fischer (ThermoFischer Scientific, Tournai, Belgium).
Characterization of Leakage of the Rapid Equilibrium Dialysis Device Inserts
In preliminary experiments, it was visually noted that a number of the RED device inserts showed leakage of plasma into the buffer compartment. To minimize leakage, different shaking modes were investigated, that is, diagonal and orbital at 200 and 750 rpm (Variomag Teleshake; Thermo Scientific, Tournai, Belgium). The degree of leakage was quantitated by measurement of the protein content of the buffer compartment using a standard Bradford proteinassay. 11 In short, after equilibration, the buffer (10 μL) was sampled in a microtiter plate (MTP) (Greiner, Wemmel, Belgium), and fivefold-diluted Bradford reagent (200 μL) (Bio-Rad, Nazareth Eke, Belgium) in PBS was added. The reagent and the buffer were mixed in the plate for 10 min on an orbital shaker, and the ultraviolet (UV) absorption of each well was measured with a Spectra Max 190 UV plate reader (Molecular Devices Ltd, Wokingham, UK) at a wavelength of 595 nm. A calibration curve of BSA, with concentrations ranging from 12.5 to 400 μg BSA/mL PBS was used to quantify the protein concentration of each sample.
Optimization of Equilibration Time in the Rapid Equilibrium Dialysis Device
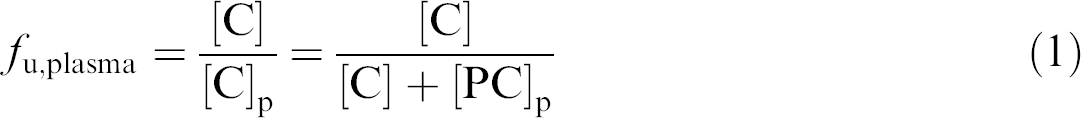
To establish the optimum time for full equilibration of the RED device, the system was manually filled with spiked plasma (300 μL) and PBS (500 μL). Propranolol, clozapine, and warfarin were used as test compounds at a final drug concentration in plasma of 5 μM. The final DMSO concentration of the spiked plasma was 1% (v/v). The RED device was sealed and transferred to a shaker, placed in a CO2 (5%) incubator (Forma 3548; ThermoFischer Scientific, Tournai, Belgium), and incubated at 37 °C (diagonal shaking, 200 rpm, corresponding to the conditions under which leakage was minimized). The RED device was sampled manually into a 2-mL 96-well square deep well plate (SDWP) (Porvair, Shepperton, UK), with analysis of buffer (50 μL) and plasma (25 μL) samples in triplicate over a time course of 0.5, 1, 2, 3, 4, 5, 6, and 7 h. Subsequently, matrix was added to yield a final sample composition of plasma (25 μL), buffer (50 μL), DMSO (50 μL), and MeCN (300 μL). Samples were mixed for 10 min on an orbital shaker at 1000 rpm and centrifuged for 10 min at 5600 rpm to pellet the precipitated proteins. Quantitative analysis was performed by LC-MS/MS. Absolute concentrations were measured with a nine-point calibration curve, ranging from 5 to 2500 nM. The f u,plasma values were determined using Eq.(1).
f u,plasma Determination of Marketed Compounds in Rapid Equilibrium Dialysis Device
To compare data obtained with the RED device with historically published f u,plasma data, a number of commercially available, chemically diverse compounds, representative of a wide range of f u,plasma values, were incubated with human plasma for 4.5 h. The RED device was filled manually with PBS (500 μL) and spiked human plasma (300 μL). The test set comprised propranolol, warfarin, clozapine, verapamil, naproxen, fluconazole, and atenolol. Incubation, sampling, and analysis were performed as described in the previous paragraph. The results were compared with the literature values.
Automation of the Assay
After optimum conditions for the RED device had been established, focus turned to the development of a semi-automated procedure. The liquid handling platform was a 200-cm Tecan Freedom EVO robot (Tecan, Männedorf, Switzerland), which was equipped with an eight-channel liquid handling arm (LiHa) using disposable, conductive 1- or 200-μL tips and a 96 multichannel arm (MCA) with disposable 200-μL tips. The deck layout used in the PPB assay is shown in Figure 2; it includes positions for disposable 200- and 1000-μL tips for the LiHa, tip boxes for the MCA, 100- and 300-mL troughs, SDWPs, and MTPs. The assay program consists of four different sections as described later. With this setup, it was possible to perform 32 experiments per run, where an experiment is defined as the measurement of a f u,plasma value for one compound in one species of plasma in triplicate. The method is completely flexible in that it is possible to vary the number of compounds and species as required for each run. To this end, a custom Excel spreadsheet was used to define the experiment order and generate plate layouts (Fig. 3). Sample quantitation was achieved by means of a single mixed matrix calibration curve comprising both plasma and buffer. In addition, quality control (QC) samples were included to assess the reliability of the data.
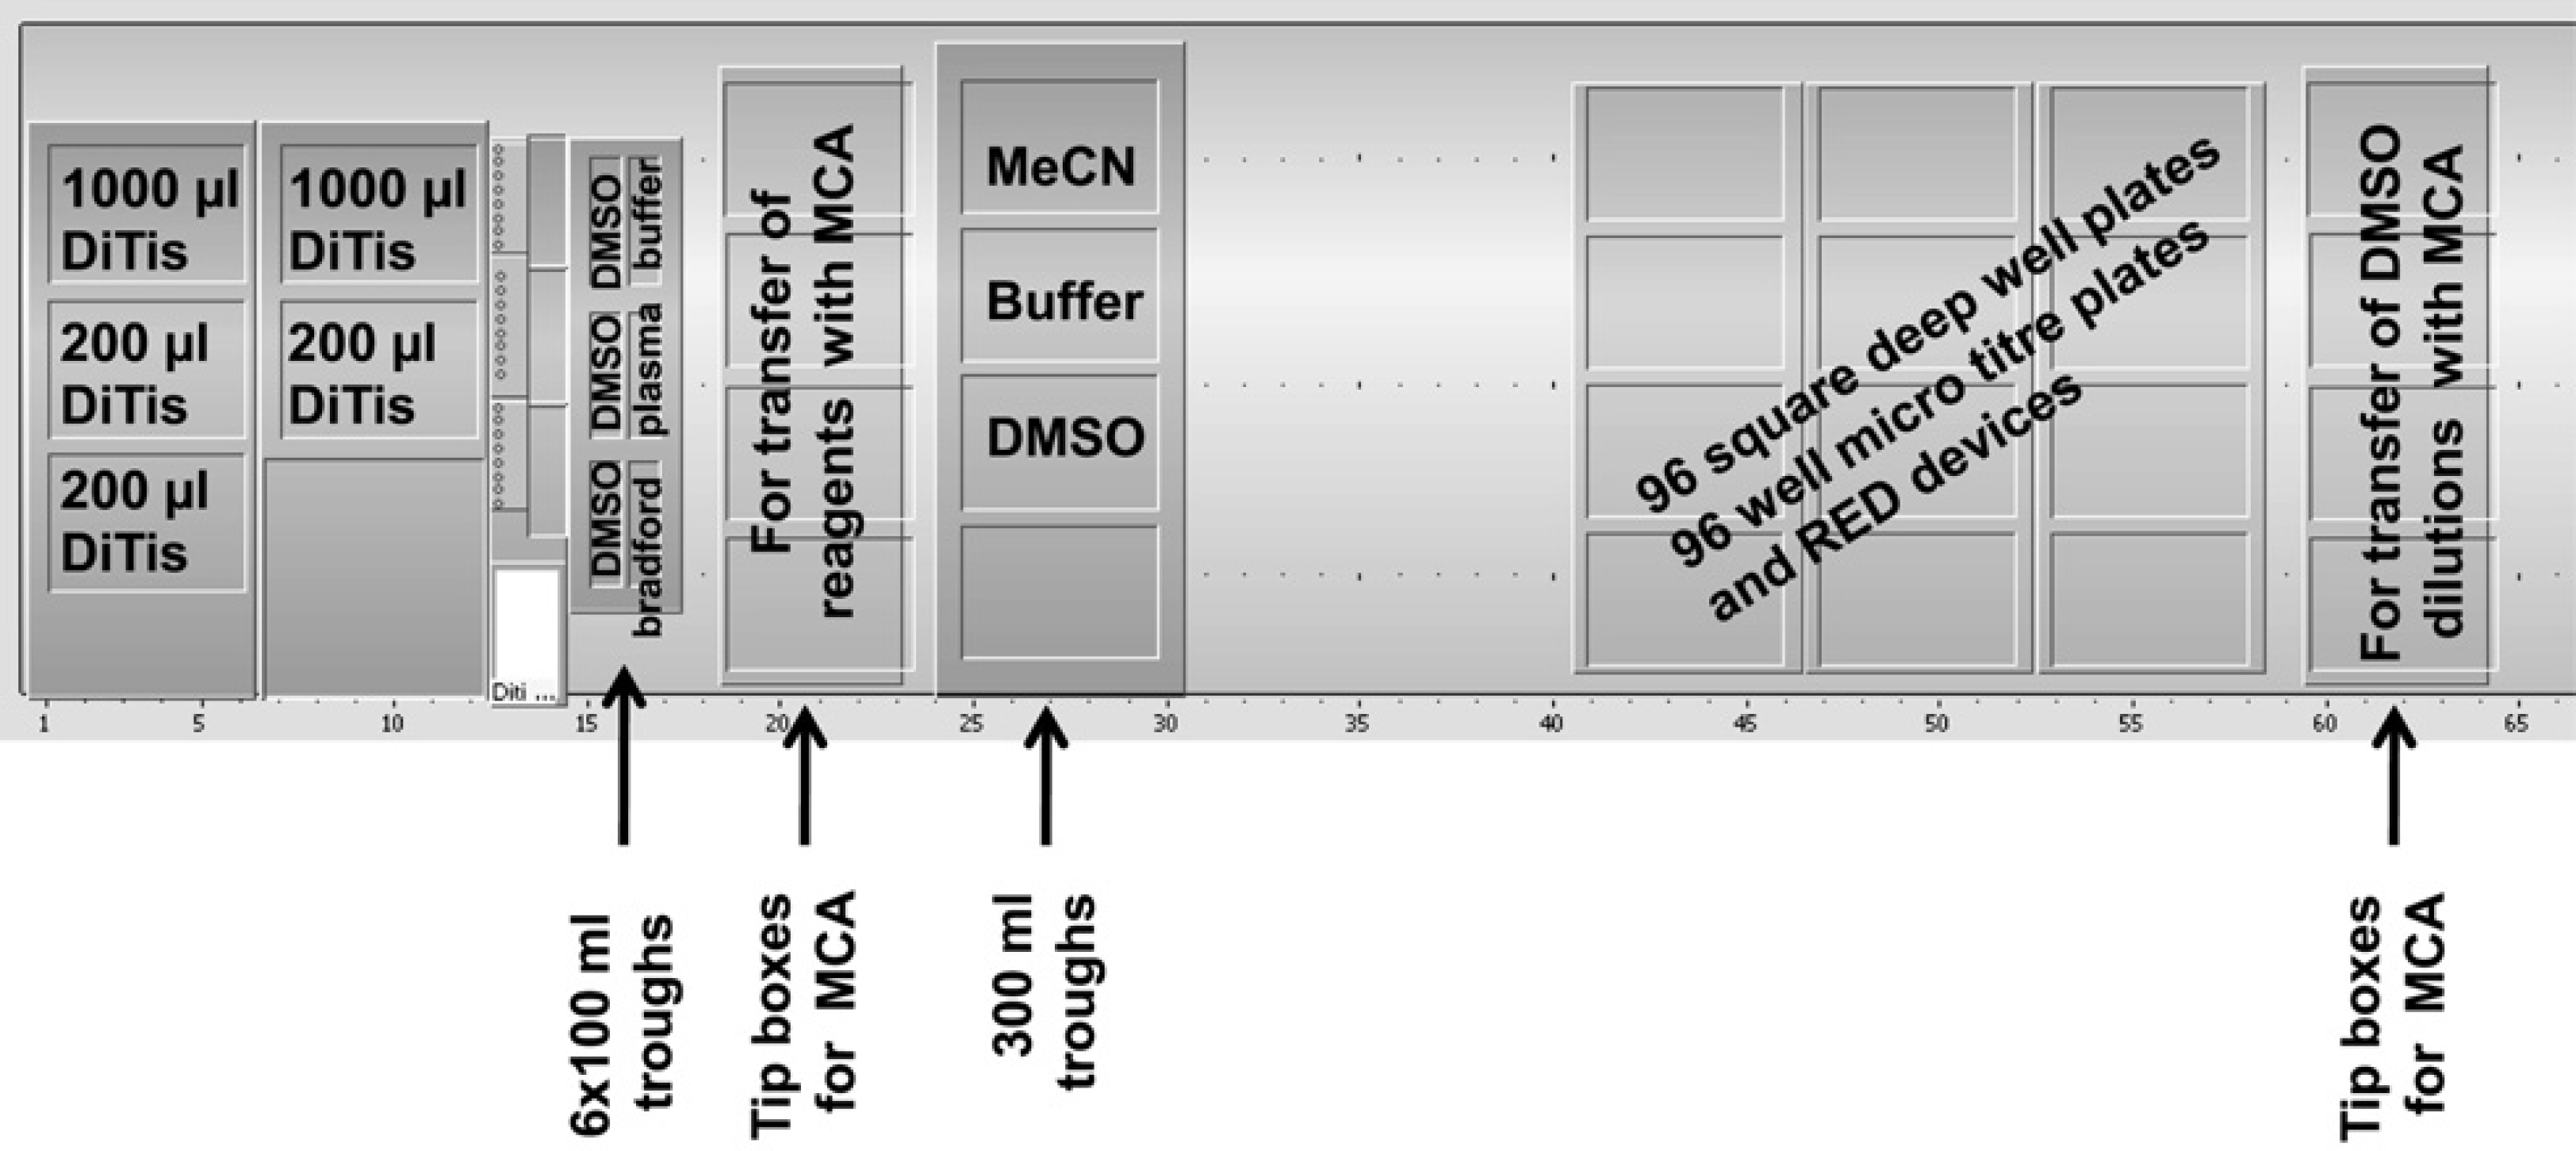
Deck layout of the Tecan EVO200 liquid handling platform.
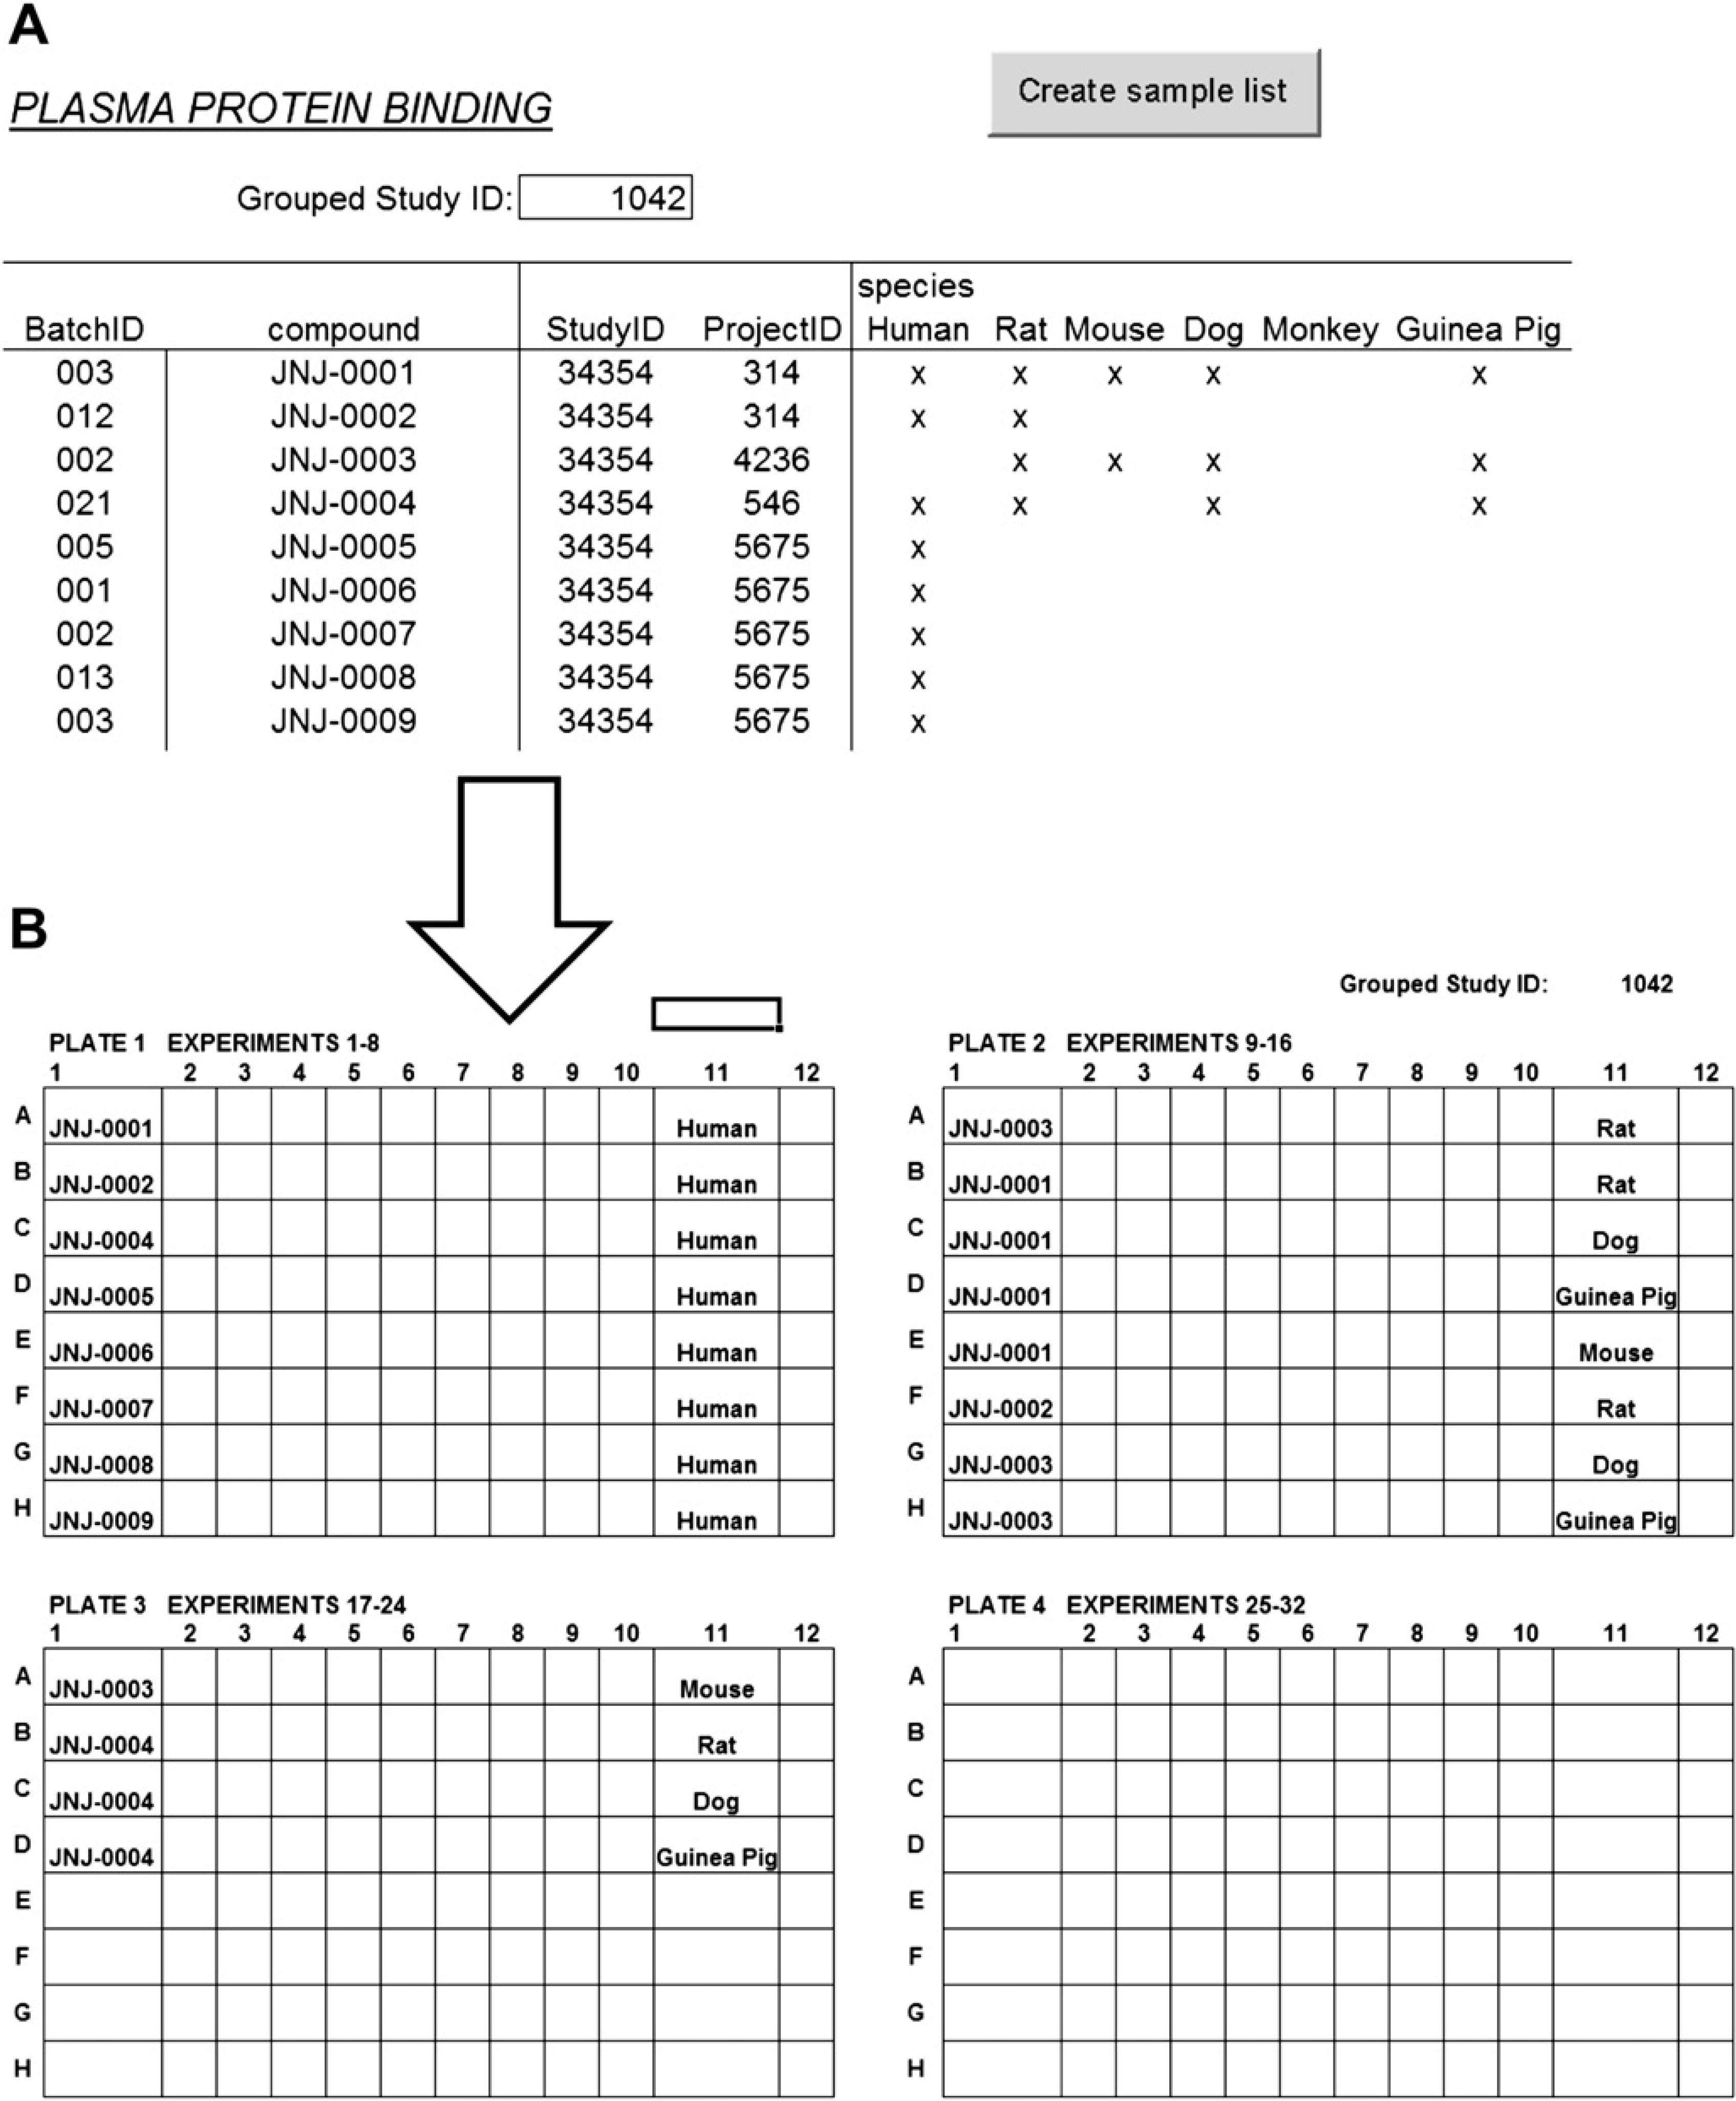
The request form (A) from which plate layouts (B), LC-MS/MS sample lists, and result tables are produced. In the request form, compound identification details are input, and species selection is achieved by means of simple box checking. In this example, 9 unique compounds divided over 5 species in a total of 22 experiments have been entered. The first 2 compound entries represent the control compounds propranolol and warfarin. The plate layout diagrams (B) are automatically generated and used as an aide memoire to ensure that the compounds and accompanying plasma bulk samples are added to the correct positions. Note that all unique compounds in the plate layouts are grouped on plates 1 and 2 such that only as many calibration curves as there are unique compounds are prepared. After the compounds are grouped, the experiments are grouped by species.
Workflow. The pipetting schemes used in the preparation of the RED device and generation of calibration and BA samples are described in Table 1 and depicted in its embedded image. The steps are briefly outlined as follows.
Timeline of events during the assay (numbers in figure correspond with those in the table)
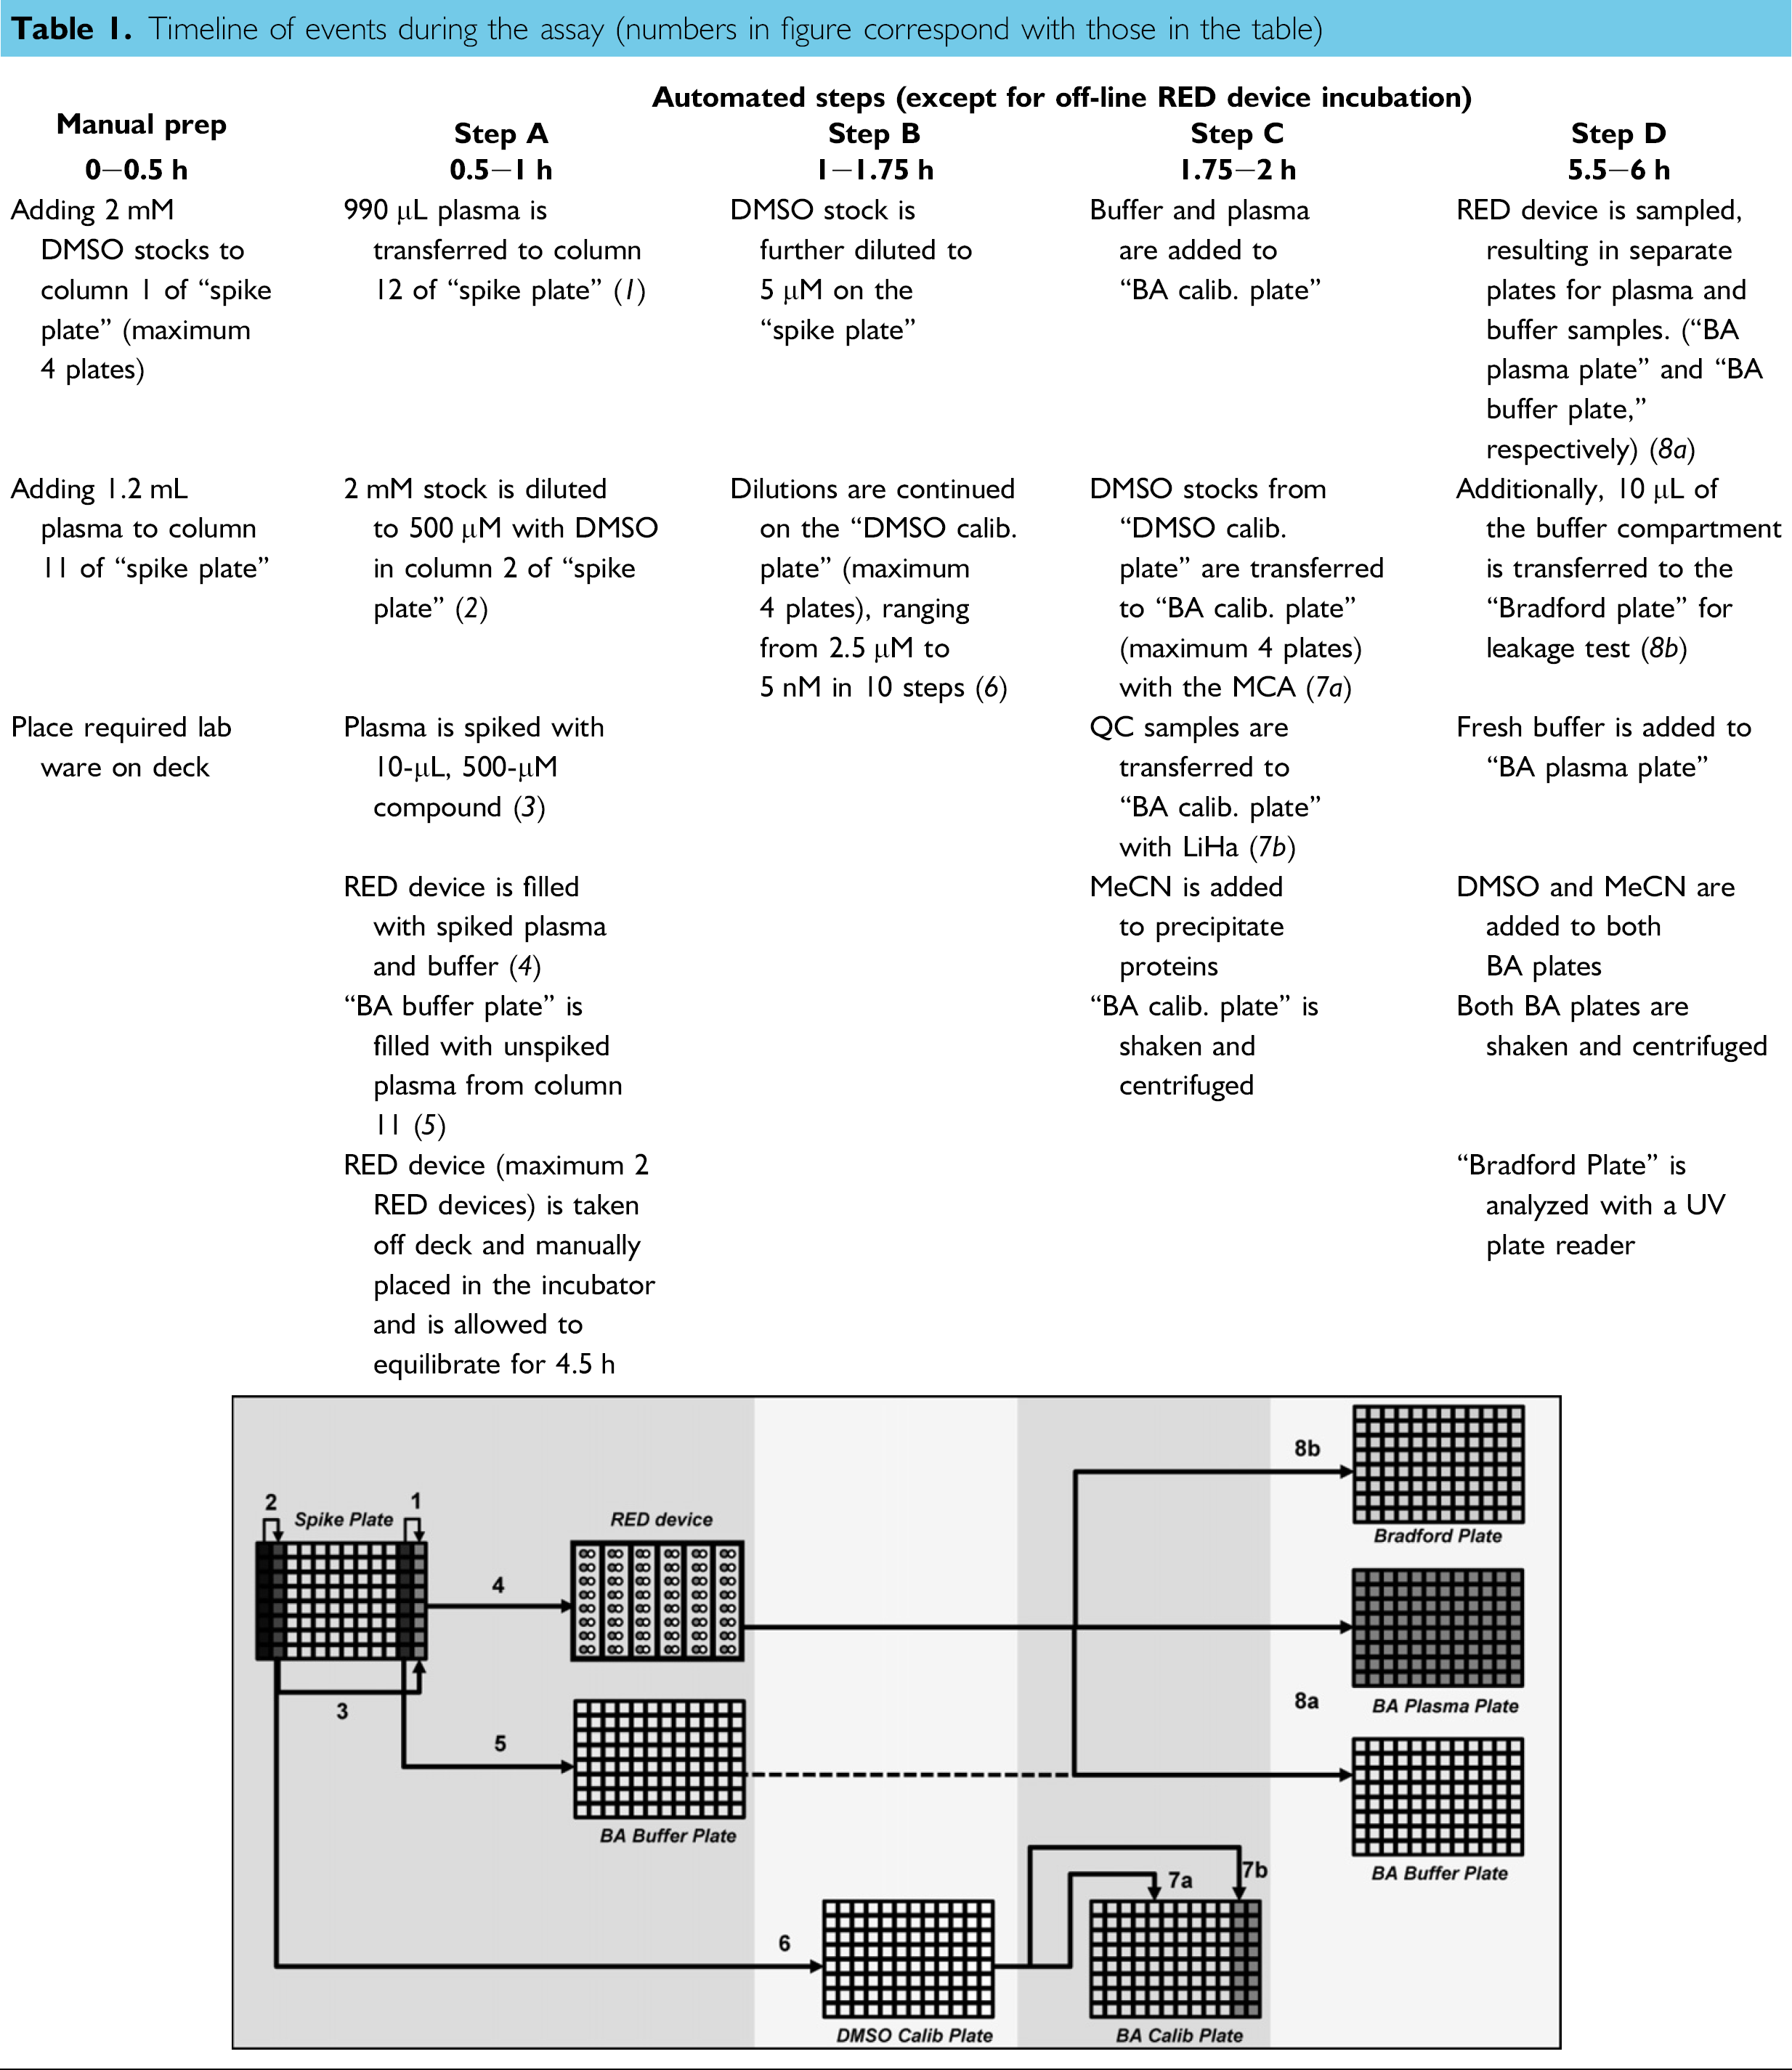
Two millimolar compound stock solutions (200 μL) in DMSO were manually pipetted into the wells of column 1 of the “spiking plate” according to predefined positions, as determined by the Excel macro, described later. Corresponding plasma aliquots (1200 μL) were manually pipetted into column 11 of the “spiking plate.” Further pipetting actions were performed with the liquid handling platform.
Control plasma (990 μL) was transferred to column 12 of the “spiking plate” (Table 1, step A, 1). The 2 mM DMSO stock solutions were diluted in parallel using the LiHa to 500 μM in DMSO (2). The 500 μM stock was then used to spike the plasma (column 12) to a final concentration of 5 μM (3). The spiked plasma was transferred to the plasma compartments in the RED device and immediately after, PBS buffer was added to the buffer compartments (
Concomitant with the incubation period, the second automated protocol for preparation of calibration curves and QC standards was performed. Serial compound dilutions were performed in DMSO from 250 μMto 5 nM (Table 1, step B,
At this stage, the robot deck was replenished with consumables in preparation for automated generation of the final calibration curve plates for BA (BA calib plate). To simplify the experimental setup and save on reagents, calibration curves for all compounds in a run were generated in a single-species plasma. Aliquots of control plasma (25 μL) and buffer (50 μL) were added to the BA calib plate. Then, 50 μL aliquots of serial diluted stock solutions in DMSO were added with the MCA (Table 1, step C,
After a 4.5-h incubation, the RED device was placed back on the deck for preparation of the “BA plasma plate” and “BA buffer plate” for analysis. In addition, the buffer compartments of the RED device were sampled for the Bradford protein assay. Plasma (25 μL) and buffer (50 μL) were sampled into the “BA plasma” and “BA buffer plates,” respectively, using the eight-channel pipetting tool (Table 1, step D,
Liquid Handling. For serial dilution of DMSO stocks, spiking of plasma, filling the RED device with buffer and plasma, and subsequent sampling of the RED device, the LiHa tool with disposable conductive tips was used. Default liquid classes for low-volume disposable tips (DiTis) were used for pipetting buffer, acetonitril, and DMSO. As a rule of thumb, the value of aspiration speed in μL/s should be equal to the amount of liquid pipetted in μL, for example, a volume of 50 μL should be aspirated at 50 μL/s. For pipetting plasma, a customized liquid class, based on the default serum liquid class, with an increased blowout volume (150 μL instead of the default value of 20 μL) was used. Addition of buffer, DMSO, and acetonitrile to prepare the matrix for BA was performed with the MCA. For liquid handling with the MCA, default settings were used for all liquid classes, that is, DMSO, buffer, and acetonitrile.
Consumables. For a full screen of 32 compounds in one species of plasma, 145 mL PBS buffer, 50 mL plasma, 350 mL DMSO, 190 mL MeCN, and 30 mL Bradford reagent is consumed. Furthermore, 96 RED inserts, 14 SDWPs, three 300-mL troughs, six 100-mL troughs, 616 200-μL conductive DiTis, 296 1000-μL conductive DiTis, and seven MCA tip boxes with 200-μL tips are needed. When fewer compounds in more species are assayed, the number of tips and SDWPs needed decrease significantly, because most of the tips and plates are used during the serial dilution used for the creation of calibration curves. For example, when eight compounds are measured in four species, only five SDWPs, 376 200-μL conductive DiTis, 128 1000-μL conductive DiTis, and four MCA tip boxes are used.
Data Handling. A custom Excel spreadsheet was created for automatic generation of plate layouts, in particular, to define the locations to which compounds and plasma of various species have to be manually transferred. After entry of the requested compounds and accompanying species (Fig. 3), the macros within the spreadsheet order the experiments such that all unique compounds are placed underneath each other. If f u,plasma for a compound is requested in more than one species, the remaining experiments for that particular compound are placed below the list of unique compounds. This grouping of DMSO stocks for unique compounds is necessary to facilitate the serial dilutions by the eight-channel LiHa. The spreadsheet also calculates and lists the required consumables and generates sample lists for LC-MS/MS analysis.
After analysis, the LC-MS/MS result files, containing concentration data of calibration curves, QC samples, and analyte samples, are exported from the MS instrumentation into the Excel workbook, and f u,plasma and approximate recovery values are calculated.
Data Acceptance Criteria. Two QC samples of 10 and 100 nM, acquired before and after the analyte samples, are used to confirm the acceptability of the quantitative BA for each specific compound. If two out of four QC samples differ by more than 15% from the expected value based on the calibration curve, the analysis for that compound is rejected. 12
Each assay run includes two control compounds, that is, propranolol (moderate binder) and warfarin (high binder), measured in each species present in the run. Based on an extensive review of data trends over approximately 50 screens (data not included), screens were deemed acceptable when f u,plasma values in human plasma for propranolol and warfarin were in the range 0.2–0.4 and 0.007–0.017, respectively. Acceptance criteria for other species of plasma were also defined (data not shown).
The total recovery of the compound in the experiment was evaluated, based on mass balance calculations. This value is only approximate, because the absolute concentration of the initial spiked plasma is not measured but assumed to be 5 μM. Low recovery may indicate nonspecific binding to the RED device or plasma instability issues. We regard the data for an individual measurement to be acceptable when the recovery is greater than 75%. This decision was made because protein binding is not generally considered to be affected by relatively minor changes in drug concentration. Data were rejected on the basis of membrane leakage if more than 160 μg protein/mL buffer (∼0.4% plasma protein) was detected in a buffer compartment at the end of the equilibrium period.
Dianorm versus Semiautomated Rapid Equilibrium Dialysis Device Method
To assess the performance of the semiautomated RED device methodology, data were compared with historical data obtained with the Dianorm system (Dianorm), an established technology for performing equilibrium dialysis. The historical data were collected over a period of 12 months, that is, data were not regenerated for the purposes of this comparison. The test set was comprised of 12 structurally diverse proprietary compounds that were incubated with both human and dog plasma. The RED device method was performed as described earlier. For the Dianorm experiments, plasma was spiked with the test compound to a concentration of 2000 ng/mL. Semipermeable membranes with a molecular weight cutoff of 5 kDa were boiled for 5 min in Milli-Q water (Milli-Q Gradient A10; Millipore, Brussels, Belgium) before use. The Dianorm cells were assembled such that each cell consisted of two compartments divided by the semipermeable membrane. Spiked plasma aliquots (1.0 mL) were added to one compartment of the cell and PBS (1.0 mL) to the other. The cells were sealed and incubated by rotation in a water bath at 37 °C for 4 h. After incubation, buffer and plasma samples were collected and prepared for quantitative analysis. Sample collection was done by transfer of the entire contents of both the buffer and plasma compartments into glass tubes which were sealed and stored at —20 °C until analysis. Analysis of the Dianorm samples was performed by transferring 50 μL buffer or plasma to an SDWP and addition of matrix. Protein precipitation was performed as described previously.
Liquid Chromatography-Mass Spectrometry/Mass Spectrometry Analysis
The LC system consisted of an Agilent 1100 series quaternary pump (Agilent Technologies, Diegem, Belgium) coupled with a Shimadzu SIL-20AC/Rack Changer autosampler (Shimadzu, Deurne, Belgium). Mass spectrometry for samples prepared in the RED device was performed on a Sciex API 4000 Q-Trap instrument (Applied Biosystems, Halle, Belgium), equipped with an electron spray ionization Turbo V source. The MS/MS system was operated in SRM mode. Compounds were tuned in infusion mode, optimizing declustering potential, collision energy, and cell exit potential. The source temperature was set to 550 °C, the ion spray voltage was 4.5 kV, and the entrance potential was 10 V. MS acquisition methods were developed using the transition ion with the highest response. All compounds were eluted with an aqueous phase (A) of 99.6% Milli-Q water, 0.5% MeCN, and 0.1% FA, and an organic phase (B) consisting of 99.9% MeCN and 0.1% FA. A Waters XBridge C18 4.6 × 50-mm, 3.5-μm column (Waters, Leuven, Belgium) was used for separation. LC conditions were optimized by injection of pooled compounds (up to 10 test compounds each), which were then eluted with a gradient of 30% B to 99% B in 2.5 min, back to 30% B in 0.1 min and held constant for a further 2.4 min. Dependent on the retention time, the gradient was adjusted in steps of 10% B to a higher percent B for compounds eluting outside the gradient and a lower percent B for compounds eluting before 1.5 min. This resulted in a retention time of between 1.5 and 2.5 min with gradients starting between 0% and 50% B. Samples measured in the Dianorm were analyzed on an API 3000 triple quadrupole instrument. The source temperature was set to 350 °C, the ion spray voltage was 4.5 kV, and the entrance potential was 10 V. Tuning was performed as described, whereas LC optimization was performed one compound at a time.
Data analysis was performed using standard autointegration tools within Analyst v1.4.2 software (Applied Biosystems, Halle, Belgium). Calibration curves were generated using the PowerFit functionality (log-log plot).
Calculations
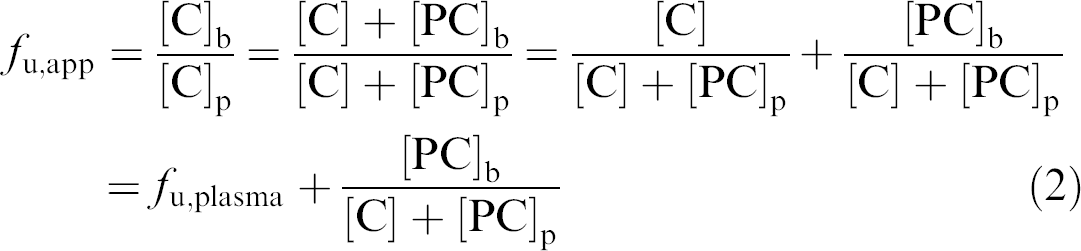
The variation in the determined f u,plasma because of leakage (the apparent f u,plasma or f u,app) can be expressed as the ratio between f u,app and the f u,plasma (the real f u,plasma). This ratio can be written as a function of f u,plasma and leakage (L). To derive this function, the following relationships are important:
and
where [C] is the free concentration of compound, which is equal to the measured concentration on the buffer side when there is no leakage. Also, at equilibrium, [C] is always equal in both compartments. [C]p and [C]b represent the total concentration of compound as measured in the plasma compartment and the buffer compartment, respectively. [PC]p and [PC]b are the concentrations of bound compound in the plasma compartment and, because of protein leakage, the buffer compartment.
The equilibrium constant (K) between the bound and free concentrations on the plasma and buffer sides can be expressed as follows:
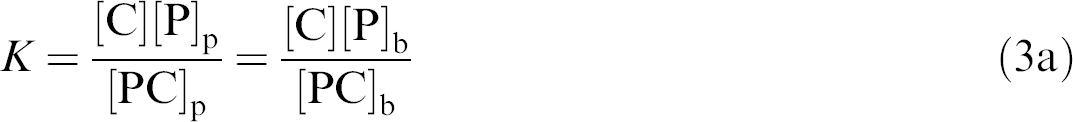
Therefore
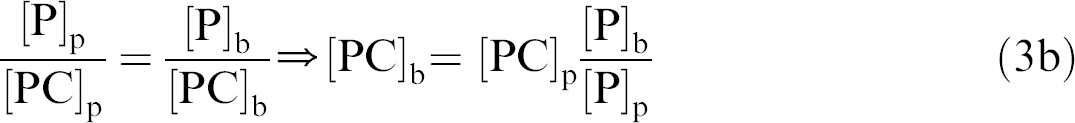
And if leakage is defined as:
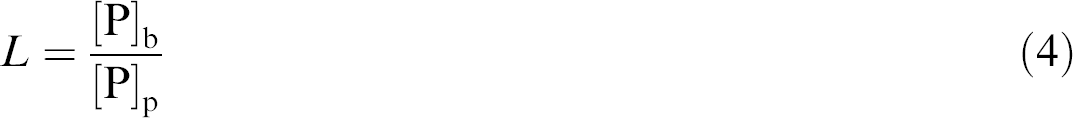
where [P]p and [P]b are the protein concentrations on plasma and buffer side, then we obtain

Inserting Eq. (5) into the formula for f u,app (Eq. (2)) gives
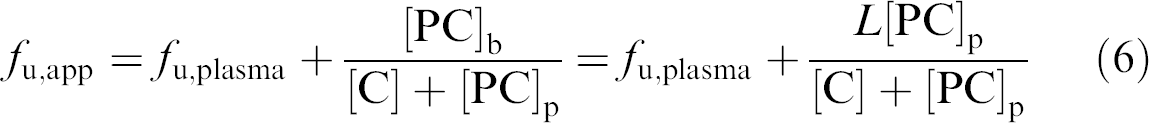
And because

Then,
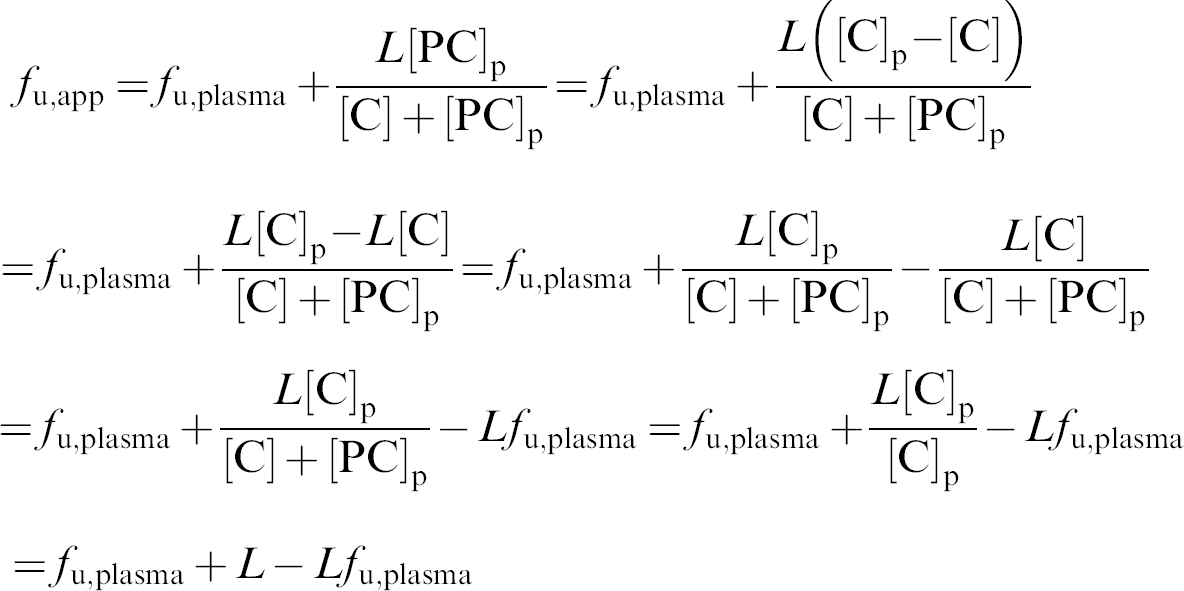
The ratio between f u,app and f u,plasma then becomes:
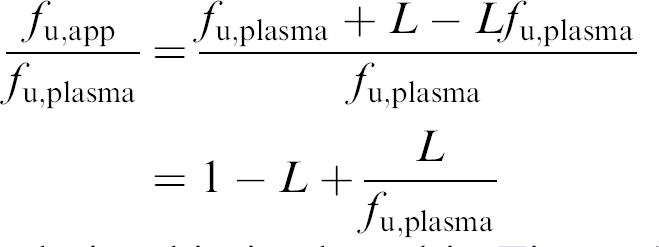
This relationship is plotted in Figure 4.
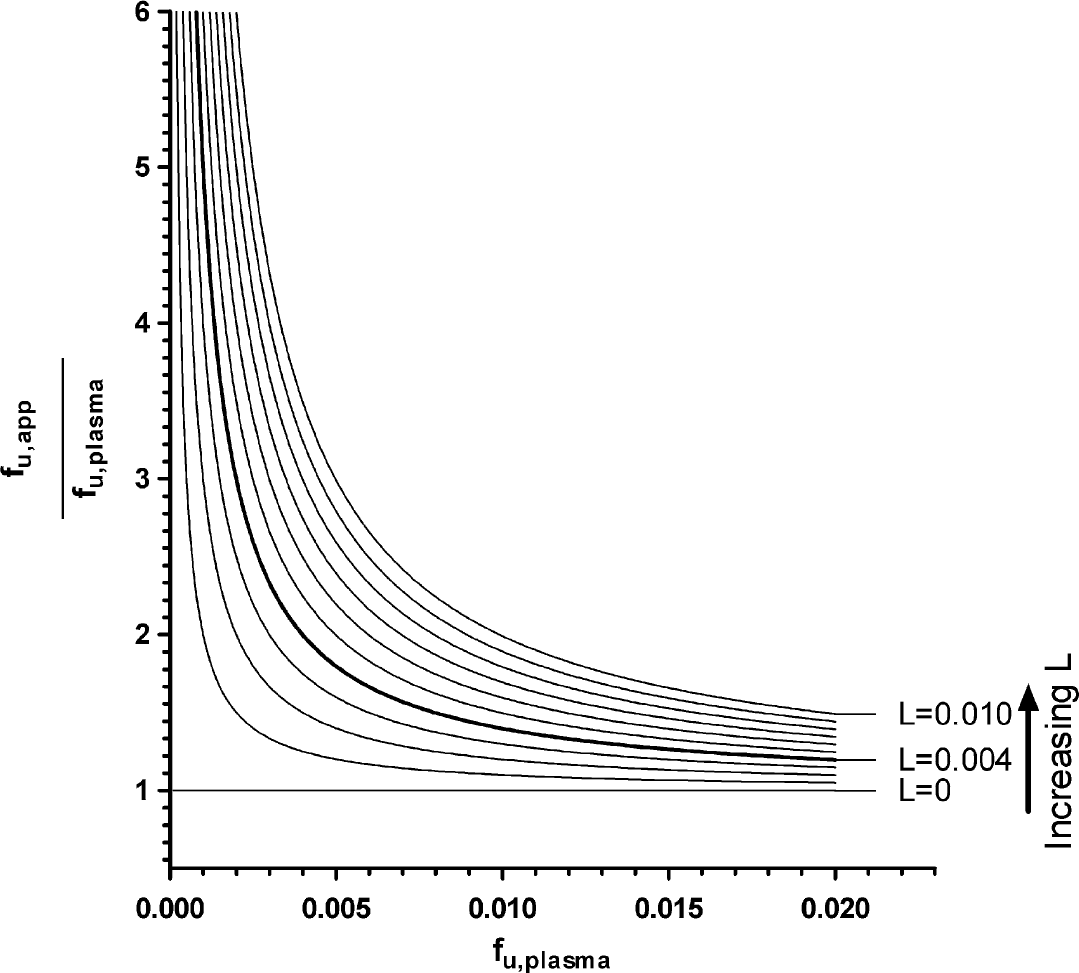
Theoretical representation of the effect of leakage (L) and unbound fraction (f u) on the variation in f u,app expressed as the ratio of f u,app and f u. Note that each curve represents a different L value (ranging from 0 to 0.01). The bold curve represents the cutoff value (L = 0.004) for rejecting an f u,plasma value.
Recovery (R) of compounds after incubation is calculated as follows:
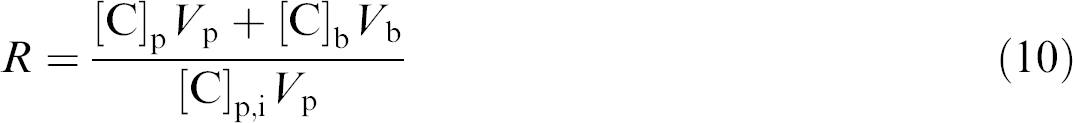
where [C]p,i is the initial compound concentration in the plasma, assumed to be 5000 nM, that is, the actual concentration is not measured. V p and V b are the volumes of the plasma (300 μL) and buffer (500 μL) compartments.
Results and Discussion
The optimum time required for complete equilibration of the RED device was first determined. Subsequently, and to contextualize the use of the RED device in an automated, higher-throughput context, f u,plasma data obtained using the RED device were compared with those obtained with an established equilibrium dialysis method and with literature data. In the course of these validation experiments, leakage of plasma into the buffer compartment was observed, causing underestimation of the PPB values. To minimize leakage, experiments were carried out with different shaking modes and speeds. Having established optimal conditions (minimal leakage, acceptable equilibration time), f u,plasma values of commercially available compounds were compared with those reported in the literature. Next, a semiautomated method based on the RED device and quantitative BA of f u,plasma samples, using a liquid handling platform, was created. This method was then used to generate f u,plasma values in human and dog plasma of 12 in-house JNJ compounds, which were compared with historical f u,plasma data for the same compounds obtained with the Dianorm method.
Determination of f u,plasma Values
We elected to measure absolute concentrations in buffer and plasma compartments to determine f u,plasma values rather than to base calculations on relative peak areas with an internal standard. 7,8 Determination of absolute concentrations by means of power-fitted calibration curves was used to correct for the nonlinear response of the MS at high concentrations. Consequently, absolute quantification can improve data quality, particularly for extensively bound compounds, where plasma and buffer concentrations reside at the extremes of the calibration range. Additionally, absolute quantitation experimental allows the estimation of experimental recovery. This highlights those compounds that may be either unstable in plasma over the incubation period or other losses, for example, extensive nonspecific binding to the RED device. Correlation coefficients (r 2 ) of the calibration curves for the measured compounds lay in the range 0.9984–0.9999. There was no significant difference between the calibration curves that were prepared manually or with the automated liquid handling platform.
Leakage of the Rapid Equilibrium Dialysis Device Inserts
In the course of the equilibration experiments, it was observed that the buffer compartment of some inserts was colored brown at the end of the incubation. This suggested a leakage from the plasma compartment into the buffer compartment of the inserts. Closer inspection demonstrated that there was a correlation between shaking mode and shaking speed and leakage (Table 2). Orbital shaking at 750 rpm caused the most leakage. Under these conditions 30% of the inserts had more than 160 mg protein/mL in the buffer compartment. Decreasing the shaking speed to 200 rpm and changing the shaking mode from orbital to diagonal led to a sharp decrease in leakage; only 2% of the inserts showed more than 160 mg/mL protein in the buffer compartment. Because leakage was significantly decreased by lowering the shaking speed and because the top was sealed with a sticky seal, we surmise that the leakage might have been caused by a weak point at the top of the membrane. Diagonal shaking at 200 rpm was chosen as the default agitation method for the rest of the experiments, because under these conditions, the leakage was low and equilibration took less than 5 h (Fig. 4).
Percentage leakage of RED device inserts under different conditions
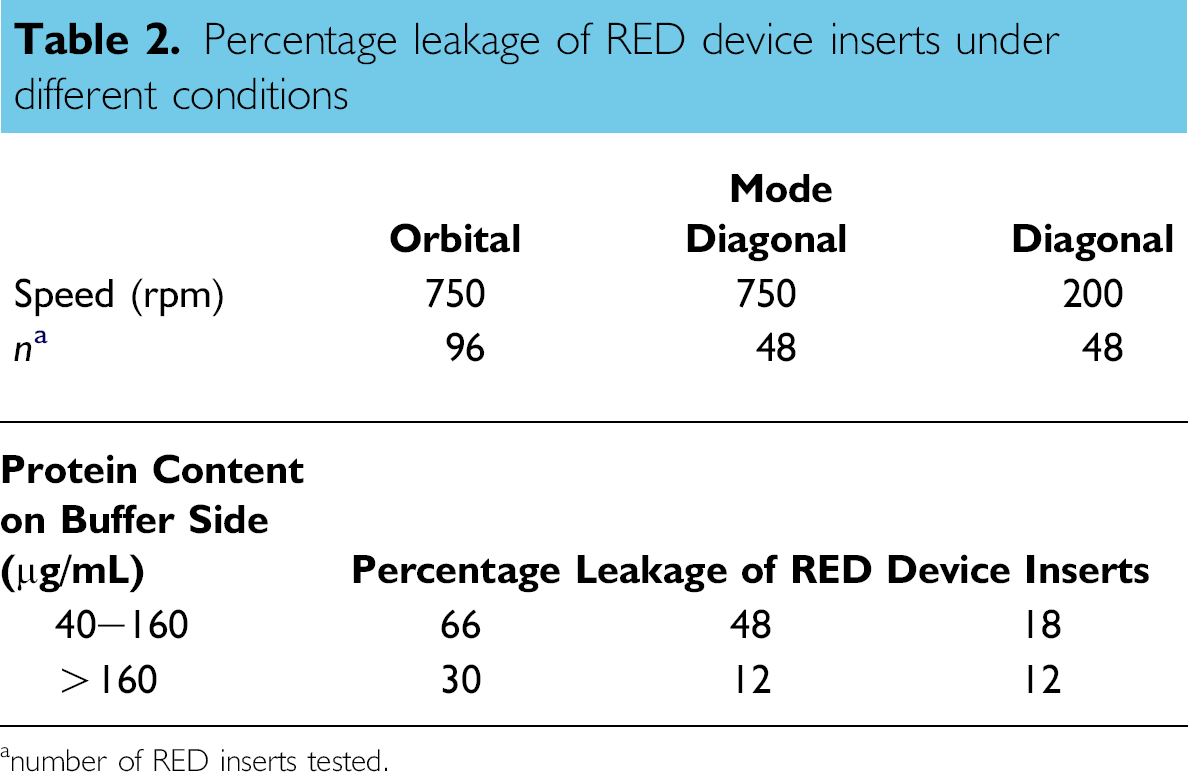
number of RED inserts tested.
To understand the effect of leakage on the apparent, calculated free fraction (f u,app), we derived a mathematical expression where the ratio between f u,app and the real free fraction (f u,plasma) is expressed as a function of leakage (L) and f u,plasma (Eq. (9)). The expression is based on the assumption that leakage is caused by ruptured membranes, so that a part of the total protein content is spilled in the buffer side. Therefore, all proteins involved in PPB, regardless of their size, are present in the buffer compartment after leakage.
This can have a profound effect on the measured PPB values, as visualized in Figure 5. The f u,app/f u,plasma ratio increases dramatically with leakage, especially for high-binding compounds. Let us consider the case where L = 0.004 (because plasma contains about 40 mg protein/ mL, L = 0.004 means that there is 160 μg protein/mL present in the buffer compartment [Eq. (4)]). If L = 0.004 and the actual f b is 0.980 (PPB = 98.0%), then f u,app/f u,plasma is 1.20, which means that the apparent (measured) value differs 20% from the actual value. For L = 0.004 and f b = 0.996 (PPB = 99.6%), the difference between the actual and measured value is already increased with 200%. In theory, Eq. (4) can be used to back calculate a true f u,plasma value from the f u,app value when the extent of leakage is known. However, we did not formally validate this and, therefore, reject rather than correct the measurement if leakage greater than our arbitrary threshold (160 μg prot/mL) is detected.
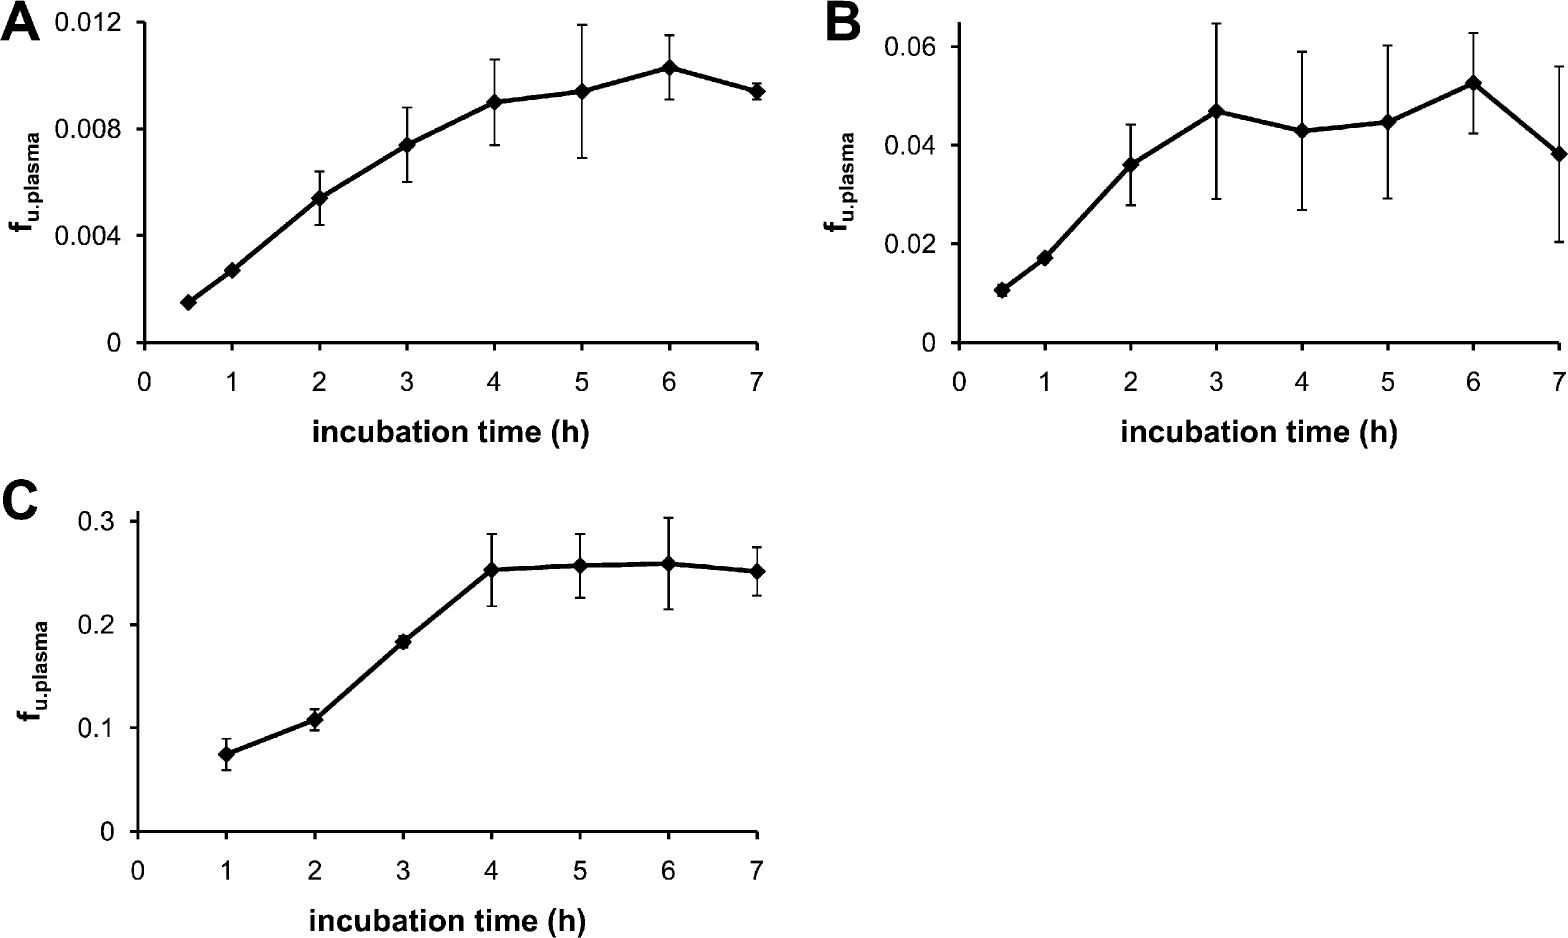
Relationship between incubation time and f u,plasma for (A) warfarin, (B) clozapine, and (C) propranolol, at 200-rpm diagonal shaking. Equilibrium is complete after 4 h for all compounds.
Equilibration of the Rapid Equilibrium Dialysis Device
The time necessary for full equilibration of the RED device was determined by performing a time course experiment using propranolol, clozapine, and warfarin as test compounds (f u,plasma = 0.251, 0.045, and 0.009 in human plasma, respectively). The RED device was sampled at 0.5, 1, 2, 3, 4, 5, 6, and 7 h, and f u,plasma values at different incubation times were determined. The results show that the f u,plasma values reach equilibrium after 4 h of incubation for all compounds (Fig. 4). In all subsequent experiments, an incubation time of 4.5 h was used (i.e., allowing an additional 30 min).
Comparison of Rapid Equilibrium Dialysis Device Data with Literature Values
To compare data obtained by means of the automated RED device methodology with that previously reported in the literature, a set of commercially available compounds (atenolol, fluconazole, propranolol, verapamil, clozapine, warfarin, and naproxen) were measured in human plasma (Table 3). Compounds had either high or low affinities for plasma proteins. The reported literature values were all measured with equilibrium dialysis techniques, which, in general, were comparable to the Dianorm method described herein.
Comparison of PPB data of commercially available compounds in human plasma, obtained with the RED device in different locations (results adapted from poster presentations), with literature values
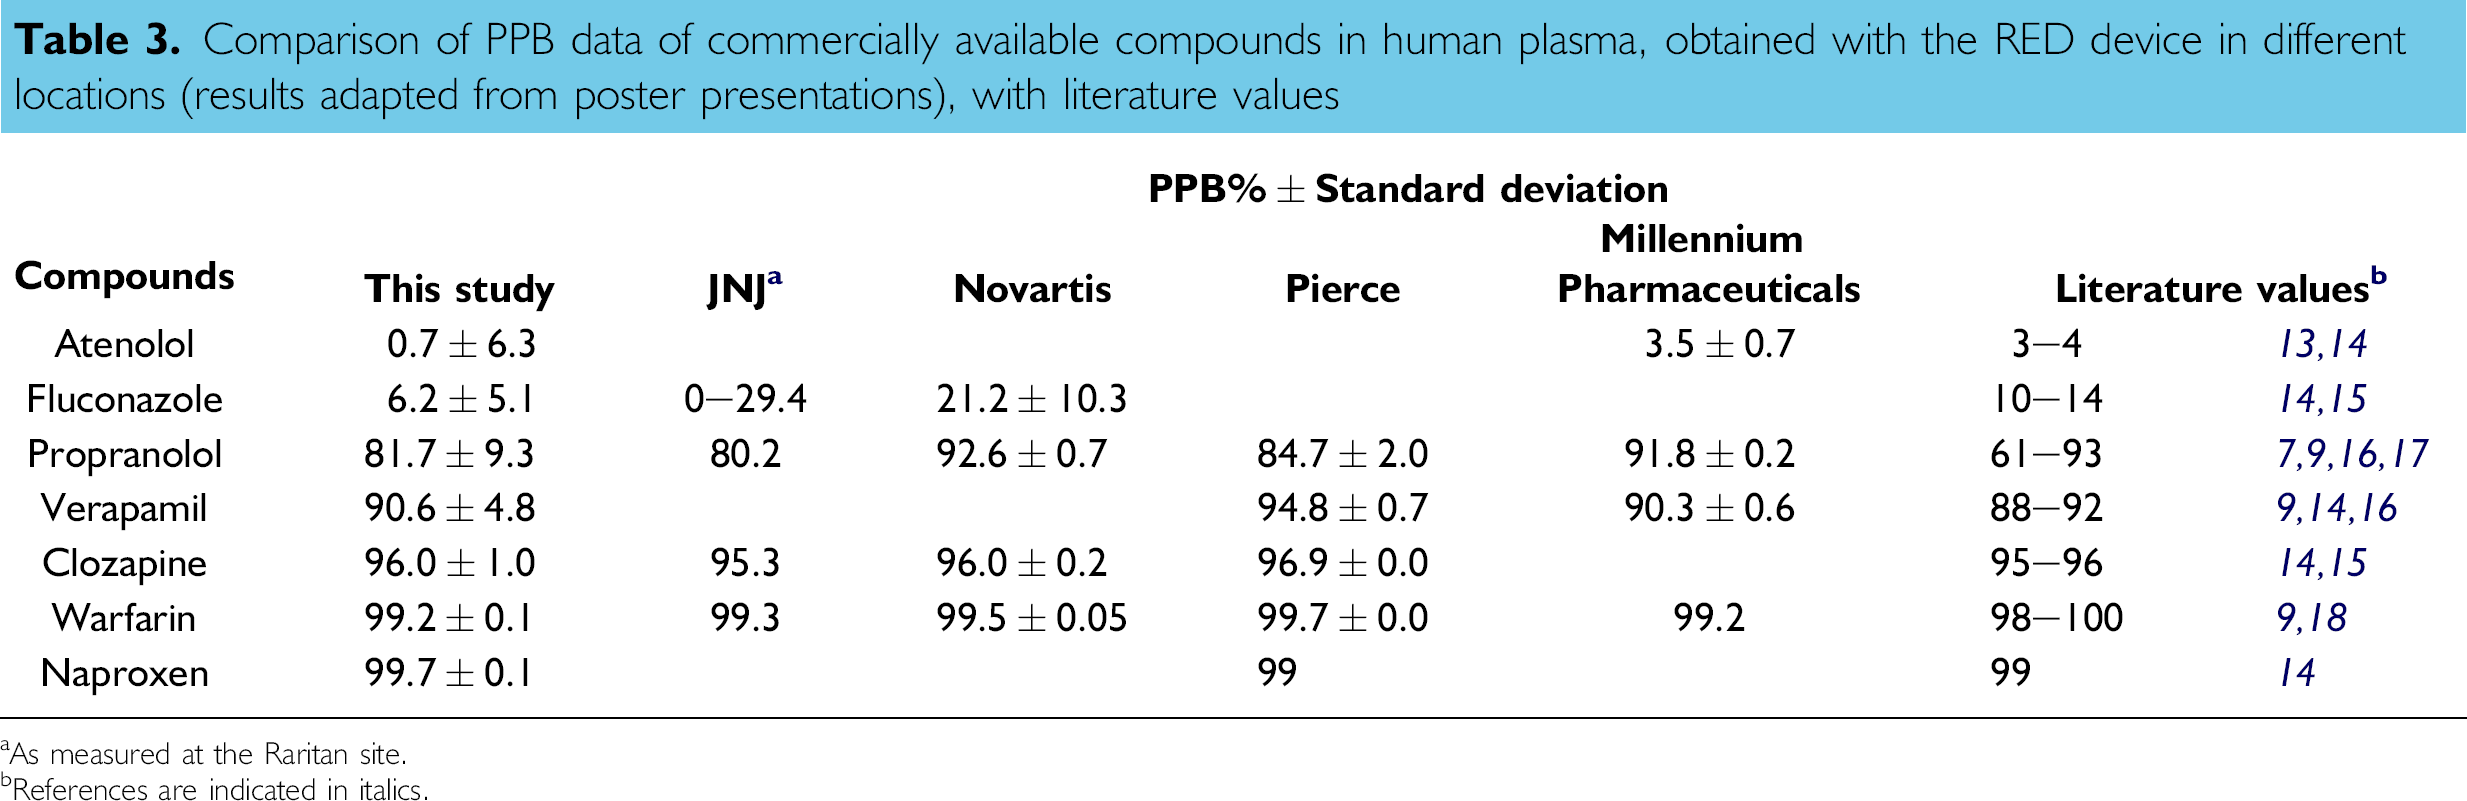
As measured at the Raritan site.
References are indicated in italics.
Separately, we compared in-house RED device results with f u,plasma data measured using the RED device in different laboratories (unpublished, poster presentations). The data compared well between laboratories, that is, within 20% of each other.
Validation of the Semiautomated Rapid Equilibrium Dialysis Plasma Protein Binding Method
The final step in the validation of the semiautomated assay was the comparison of f u,plasma values measured with the RED versus the Dianorm system for chemotypes chemically relevant to the in-house discovery projects. f u,plasma values of 12 in-house compounds were determined with the RED device in both dog and human plasma and compared with historical data previously determined in the Dianorm. In general, there was a good correlation between the semiautomated RED and the Dianorm method (Fig. 6). When f u,plasma values of all compounds in both human and dog plasma were taken into account, the r 2 value of the correlation graph was 0.93, with only a slight deviation from the line of unity.
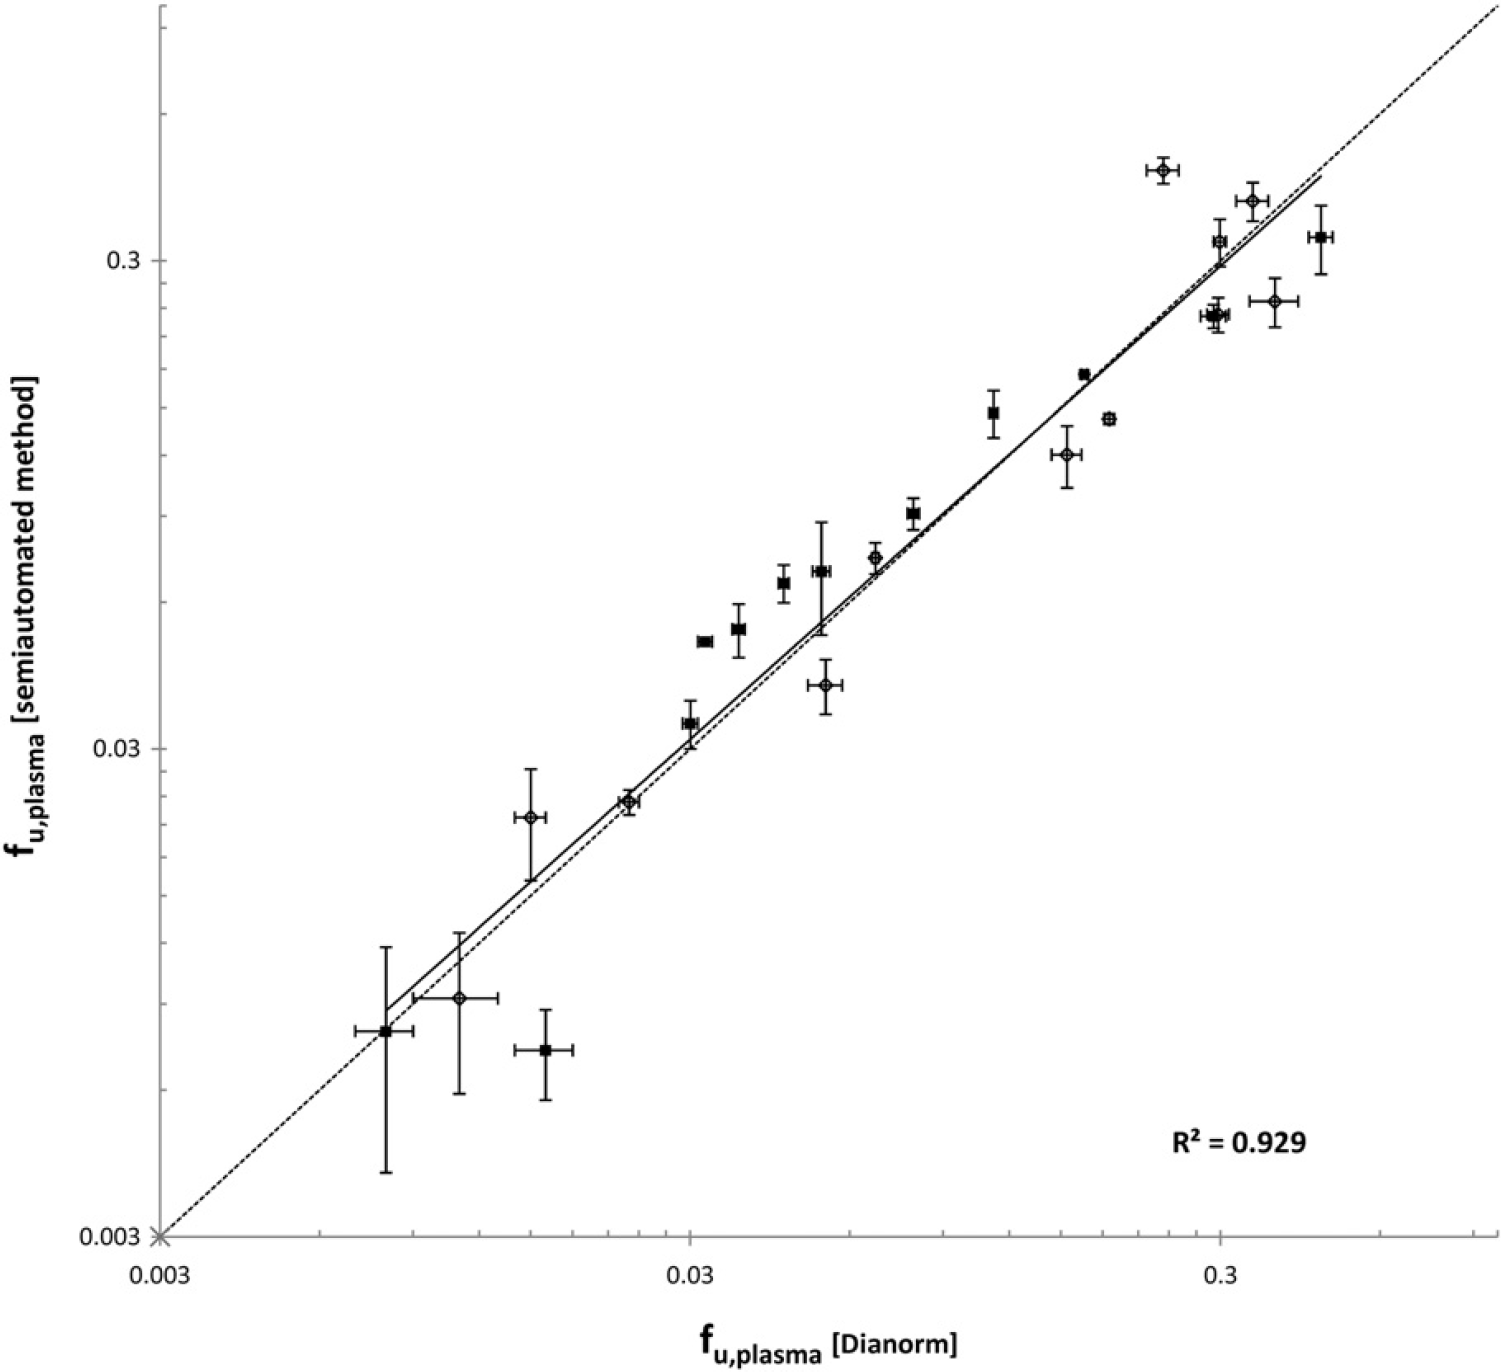
Correlation between f u,plasma values obtained for a series of JNJ compounds obtained manually using a Dianorm device and with the semiautomated RED PPB assay in human (▄) and dog plasma (⋄). The dotted line indicates the line of unity, whereas the bold line indicates the regression line of both human and dog f u,plasma values. Bars indicate standard deviations.
Conclusion
An increased focus on the prediction of human pharmacokinetics and pharmacodynamics using physiologically based models has led to a significant increase in the need for measurements of the free fraction of a drug in plasma. The semi-automated method described here, based on a 48-well format equilibrium dialysis device, allows up to 32 triplicate f u,plasma measurements to be undertaken in a single run. The method is completely flexible with regard to the number of compounds and the number of plasma types per compound. The data obtained compare well with those obtained using a traditional manual assay based on equilibrium dialysis. Standard deviation values for the triplicate determinations appear to be marginally larger compared with those data obtained with the manual assay; however, we believe that this level of variability is acceptable for screening measurements in a drug discovery environment. Validation experiments demonstrated the influence of shaking speed on the potential for protein leakage from the plasma to the buffer side. The impact of leakage on overall f u,plasma results was modeled, and this led to the incorporation of a leakage measurement component to the semiautomated assay.
Yet, significant time and cost savings are achievable using the semiautomated RED approach. The cost of a full screen (32 experiments) with the assay described costs approximately €900 in consumables (RED devices, plates, DiTis, plasma, solvents). This is somewhat higher than that of a full screen (six experiments) with the historical Dianorm method, mainly because of the relatively high costs of the RED device. However, the labor costs of the semiautomated assay are substantially reduced compared with the Dianorm method. The setup and interventions required in the assay described here require relatively little time investment—of the order of 0.5 person days per study. In contrast, performing 32 incubations using the Dianorm would require ca. 2.5 person days per study. Based on the assays performed within our laboratory over a 6-month period, we estimate that data were generated at ca. one-fifth of the cost compared with that of the manual assay.
Acknowledgments
The authors wish to thank Claire Mackie and members of the ADME-Tox Department for useful discussions, and Lieve Dillen and the Bioanalysis department for generating the historical Dianorm data. We would also like to acknowledge our colleagues at the J&J Raritan site for provision of PPB validation data generated using the RED device. The authors wish to thank Henk Mouthaan and Tai Huang from Thermo Fisher Scientific for valuable discussions concerning technical matters for the RED device.
Competing Interests Statement: The authors certify that they have no relevant financial interests in this manuscript.