
Abstract
In the triage of hits from a high-throughput screening campaign or during the optimization of a lead compound, it is relatively routine to test compounds at multiple concentrations to determine potency and maximal effect. Additional follow-up experiments, such as agonist shift, can be quite valuable in ascertaining compound mechanism of action (MOA). However, these experiments require cross-titration of a test compound with the activating ligand of the receptor requiring 100–200 data points, severely limiting the number tested in MOA assays in a screening triage. We describe a process to enhance the throughput of such cross-titration experiments through the integration of Hewlett Packard’s D300 digital dispenser onto one of our robotics platforms to enable on-the-fly cross-titration of compounds in a 1536-well plate format. The process handles all the compound management and data tracking, as well as the biological assay. The process relies heavily on in-house-built software and hardware, and uses our proprietary control software for the platform. Using this system, we were able to automate the cross-titration of compounds for both positive and negative allosteric modulators of two different G protein–coupled receptors (GPCRs) using two distinct assay detection formats, IP1 and Ca2+ detection, on nearly 100 compounds for each target.
Keywords
Introduction
The ability to rapidly and efficiently screen large chemical libraries of 105 to 106 compounds in low microliter volumes in order to identify small molecules that modulate the biology of interest is standard business practice in pharmaceutical research labs. Where bottlenecks continue to persist is in the triage of the hit lists that can come out of these screening campaigns, often in more complex and/or challenging assay formats. One such example of a complex biology with complex follow-up is the identification of positive or negative allosteric modulators (PAMs or NAMs) of G protein–coupled receptors (GPCRs). 1 Screening of these targets has challenges in that a consistent level of ligand effect must be maintained throughout the screen (typically generating ~20% or ~80% maximal efficacy for PAM or NAM, respectively) in order to find compounds that will modulate the ligand’s signal.2–4 The effort is further complicated by the day-to-day variability that a given ligand concentration can have. Once these screening campaigns are complete, an agonist shift experiment can be performed in which the compound of interest is cross-titrated with the receptor agonist to determine the relative influence of the modulator on agonist potency and maximal effect, as well as direct activity of the compound itself. 1 These experiments allow a more nuanced understanding of how a modulator affects the receptor in the presence of the ligand; however, they require sufficient coverage of the activity range of both compounds to enable an accurate fit of the data to the allosteric model, typically requiring a matrix of two compound concentrations over three to four orders of magnitude encompassing tens to hundreds of data points. Due to the intensive data requirement, many studies examined shifts in potency and/or maximal effect without fitting data to models of allostery and/or focusing on a limited number of advanced compounds.2,5–7 In an effort to increase the throughput of cross-titration experiments, Hendricson et al. 8 developed an automated process to examine the agonist shift for GPCRs in a 384-well format incorporating acoustic transfer of compounds. Here, we describe a process to enable the execution of cross-titration assays on hundreds of samples per day in a fully automated, 1536-well miniaturized format. The heart of the operation is a compound management system on a Biomek-FX (Beckman Coulter, Brea, CA) coupled with the integration of Hewlett Packard’s (Palo Alto, CA) D300 digital dispenser.9,10 This dispenser allows us to make cross-titrations on the fly with low dead volume, avoiding carryover and the premaking of cross-titration mother plates. All the rest of the hardware components are standard screening labware orchestrated by our proprietary process control software, Telios. Importantly, the D300 enabled expansion of titration concentrations to allow more complete curve fitting and improved determination of allosteric parameters through a global fit model, including parameters for potency and efficacy, as well as endogenous activity for the modulator itself. 4
Materials and Methods
Positive Allosteric Modulator Assay
Human embryonic kidney cells stably expressing a Gαq-coupled GPCR target of interest (GPCR1) were plated at 4800 cells/well (8 μL of 6 × 10⁵ cells/mL/well) into white, cyclic olefin copolymer (COC), poly-D-lysine-coated 1536-well plates (Corning no. 7427, Corning, NY) using a GNF bottle valve dispenser (GNF, San Diego, CA) and incubated overnight in an incubator (LiCONiC Instruments, Liechtenstein) at 37 °C, 85%–90% humidity, 5% CO2. Growth media contained Dulbecco’s modified Eagle medium (DMEM) with high glucose (Invitrogen no. 11965, Carlsbad, CA), 10% fetal bovine serum (Invitrogen no. 10082), penicillin/streptomycin/glutamine (Invitrogen no. 10378), and 500 μg/mL geneticin (Gibco no. 10131, Carlsbad, CA). Following 18–24 h of incubation, the plate was retrieved and washed two times on a GNF plate washer with 1× stimulation buffer (diluted from 5× stock, CisBio no. 62IPAPEJ, Bedford, MA; final concentrations [mM]: 10 HEPES, 1 CaCl2, 0.5 MgCl2, 4.2 KCl, 146 NaCl, 5.5 glucose, 50 LiCl pH 7.4), leaving 3 μL volume/well. Compounds were added at room temperature (HPD300—details below), and returned to the incubator for 1 h. Following incubation with compounds, IP1 11 detection reagents were added at 1.5 μL/well each of IP1-d2 and Ab-Cryptate (CisBio no. 62IPAPEJ; each reagent prepared at a 1:30 dilution in lysis buffer supplied in the kit) and the plate was incubated for 25 min at room temperature. The plate was then read on a laser Envision (PerkinElmer Model 2104, Waltham, MA) with excitation at 337 nm and emission reads at 665 and 615 nm with 60 μs delay, 400 μs window, and 16,600 μs time between flashes.
Data Analysis
Data analysis was performed using Prism 6 (GraphPad Software Inc., La Jolla, CA). A ratio of 665/615 nm relative fluorescence units (RFUs) was determined for all wells. For each day’s run, an IP1 standard curve (16 points, threefold dilution of IP1 starting at 55 μM) was generated from a four-parameter logistic equation: 11

where Y is the resulting Ratio of 665/615, X is the log[IP1], EC50 is the half-maximal concentration of IP1, n is the hill slope, and Bottom and Top represent the lower and upper asymptotes, respectively, of the 665/615 nm ratio for the curve. Using the best fit of the above equation for the IP1 standard curve run on that day, all well data were transformed to convert the 665/615 ratio values to the concentration of IP1 using an interpolation of the above equation.
The maximum and minimum responses (in M [IP1]) for each plate were determined from an average of the positive and negative reference controls, and all plate data were normalized as %Activity:
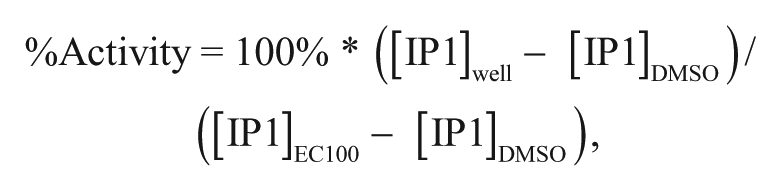
where [IP1]well is the calculated concentration of IP1 from a given well, and [IP1]DMSO and [IP1]EC100 are the average calculated concentrations of IP1 from the EC0 (DMSO vehicle only) and the EC100 (concentration of a full agonist at GPCR1 giving a maximal response) regions of the plate, respectively. The resulting data from each cross-titration of 10 points of agonist versus 14 points of modulator were subjected to fit by a model of allosteric effect.4,12 Data were visualized in Spotfire (TIBCO, Palo Alto, CA). The minimum significant ratio (MSR) for agonist titrations was calculated as described previously. 13
Negative Allosteric Modulator Assay
CHO cells stably expressing a Gαi GPCR force-coupled to Gα16 (GPCR2) were plated at 4000 cells/well (8 μL of 5 × 10⁵ cells/mL/well) into black, COC, 1536-well plates (Corning no. 7388) using a GNF bottle valve dispenser (GNF) and incubated overnight in a LiCONiC Instruments incubator at 37 °C, 85%–90% humidity, 5% CO2. Media contained DMEM without glutamine (Invitrogen no. 11960), 10% fetal bovine serum (Invitrogen no. 10082), penicillin/streptomycin/glutamine (Invitrogen no. 10378), nonessential amino acid (Invitrogen no. 12383), 120 ng/mL proline (Sigma no. P5607, St. Louis, MO) (and 35 μg/mL hygromycin (Sigma no. H5727). Following 18–24 h of incubation, the plate was retrieved and washed two times on a GNF plate washer with wash buffer (Hank’s Balanced Salt Solution [HBSS], Thermo Fisher Scientific no. SH30268.02, Waltham, MA); final concentrations (mM) were 20 HEPES (Gibco no. 15630-130), 2.5 probenecid (Sigma no. P-8761), and 0.1% BSA (Sigma no. A-9576), leaving 2 μL volume/well. Solution containing 4 μL of Fluo-4 Calcium dye (Invitrogen no. F26216) at 6 μM, Pluronic F-127 (Invitrogen no. P3000MP) at 0.06%, and TR-40 (Invitrogen no. K1031) at 3% were added to each well. Following 50 min incubation at 37 °C, 85%–90% humidity, 5% CO2, the plates were equilibrated at room temperature for 10 min. Compounds were added at room temperature (HPD300—details below). Following 20 min incubation with compounds, the plate was then read on a FLIPR-Tetra (FR0200-9999, Molecular Devices, Sunnyvale, CA) with excitation at 470–495 nm and emission read at 515–575 nm for 5 s. Then, 1 μL of the agonist from an intermediate plate was added into the assay plate with the elastomeric head. The plate was read for another 60 s.
Data Analysis
Data analysis was performed using Prism 6 (GraphPad Software Inc.). Ratios of max/min RFUs were determined for all wells, which were then normalized as %Activity:
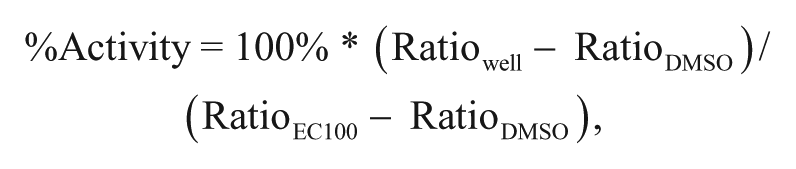
where Ratiowell indicates the individual max/min value for a given well, and RatioEC100 – RatioDMSO indicates the average ratio values for the EC100 (maximal efficacy of a full agonist for GPCR2) and EC0 (DMSO vehicle) regions of the plate. The resulting data from each cross-titration of 12 points of agonist versus 15 points of modulator were subjected to global fit by a model of allosteric effect.4,12
Robotics/Hardware/Drivers
The entire workflow was enabled using an internally developed automation control software suite called Telios (Thermo’s Momentum or HRB’s Cellario would be analogous commercial products). While the technical details of the Telios and its instrument drivers are not discussed in this work, we will discuss the capabilities of the instruments that are critical to this process: the management and distribution of test compounds (Biomek-FX Compound Manager), the loading and unloading of D300 dispense cassettes (Robotic Tool), the physical dispense of compounds (D300), data handling, and data analysis. The layout of devices controlled for the described assays was as follows (
Biomek-FX Compound Manager ( Fig. 1 )
The Biomek-FX manages the distribution of compounds into the D300 dispense cassettes. An internal compound management repository provides source plates with test compounds (referred to here as unknowns), and a plate map (as a .csv file) is provided specified by the barcode of the plate, and well positions of compounds with their corresponding unique number identifiers, volumes, and concentrations. This cluster of compound information is stored in the custom driver, and compounds that need to be tested have a status of “pending” assigned to them. As the request for filling cassettes occurs, the compound manager allocates pending compounds to a cassette and then sets the status of these compounds to “complete.” Controls, DMSO, and other identities can be stored on a plate that exists on the deck of the Biomek-FX and can be added to any user-defined position within the cassette. With all the cassettes in place at the Biomek-FX, the Telios control software sends the command for the device driver to start the Biomek-FX filling cassettes with the appropriate parameters as specified by the operator. Specifically, the driver receives a cluster of information (the cassette cluster), which contains the instructions on how the cassette positions should be filled (DMSO, unknown or agonist). (The term agonist is used generically in our methods and this article to indicate the ligand that will be tested against the unknowns.) The compound manager processes this cluster and assigns the contents as described below. From this information, the driver builds the file that the FX reads during its method on what “well-to-cassette transfers” are to occur. The driver also arranges so that it minimizes the number of source plates needed on the FX deck to populate the current set of cassettes. During this transfer process, a new tip is used for every fluid transfer. The cassette cluster is updated with the specific compound information (compound identifier, volume, and concentration). The compound manager updates its records for the corresponding compound by marking it complete and recording the cassette ID and position of its final location. At the completion of the Biomek-FX cassette filling process, the driver passes back to the Telios control software the updated cassette cluster, and this is stored to be recalled later when the cassettes are used at the D300 dispenser. If there are no further pending compounds to process, the user can define what to use instead. This is typically DMSO. This piece is critical for handling the likely scenario that at the end of a run, there are fewer compounds pending than there are dispense heads to fill on the cassette. If the dispense protocol on the D300 requires more than one cassette, the compound manager will fill the appropriate number of cassettes as defined by the operator. For example, an experiment may have eight unknown compounds, the agonist of interest, and DMSO. These will span two or three cassettes (eight dispense heads per cassette). The cassette cluster will contain all the information for all the cassettes used for one assay plate.
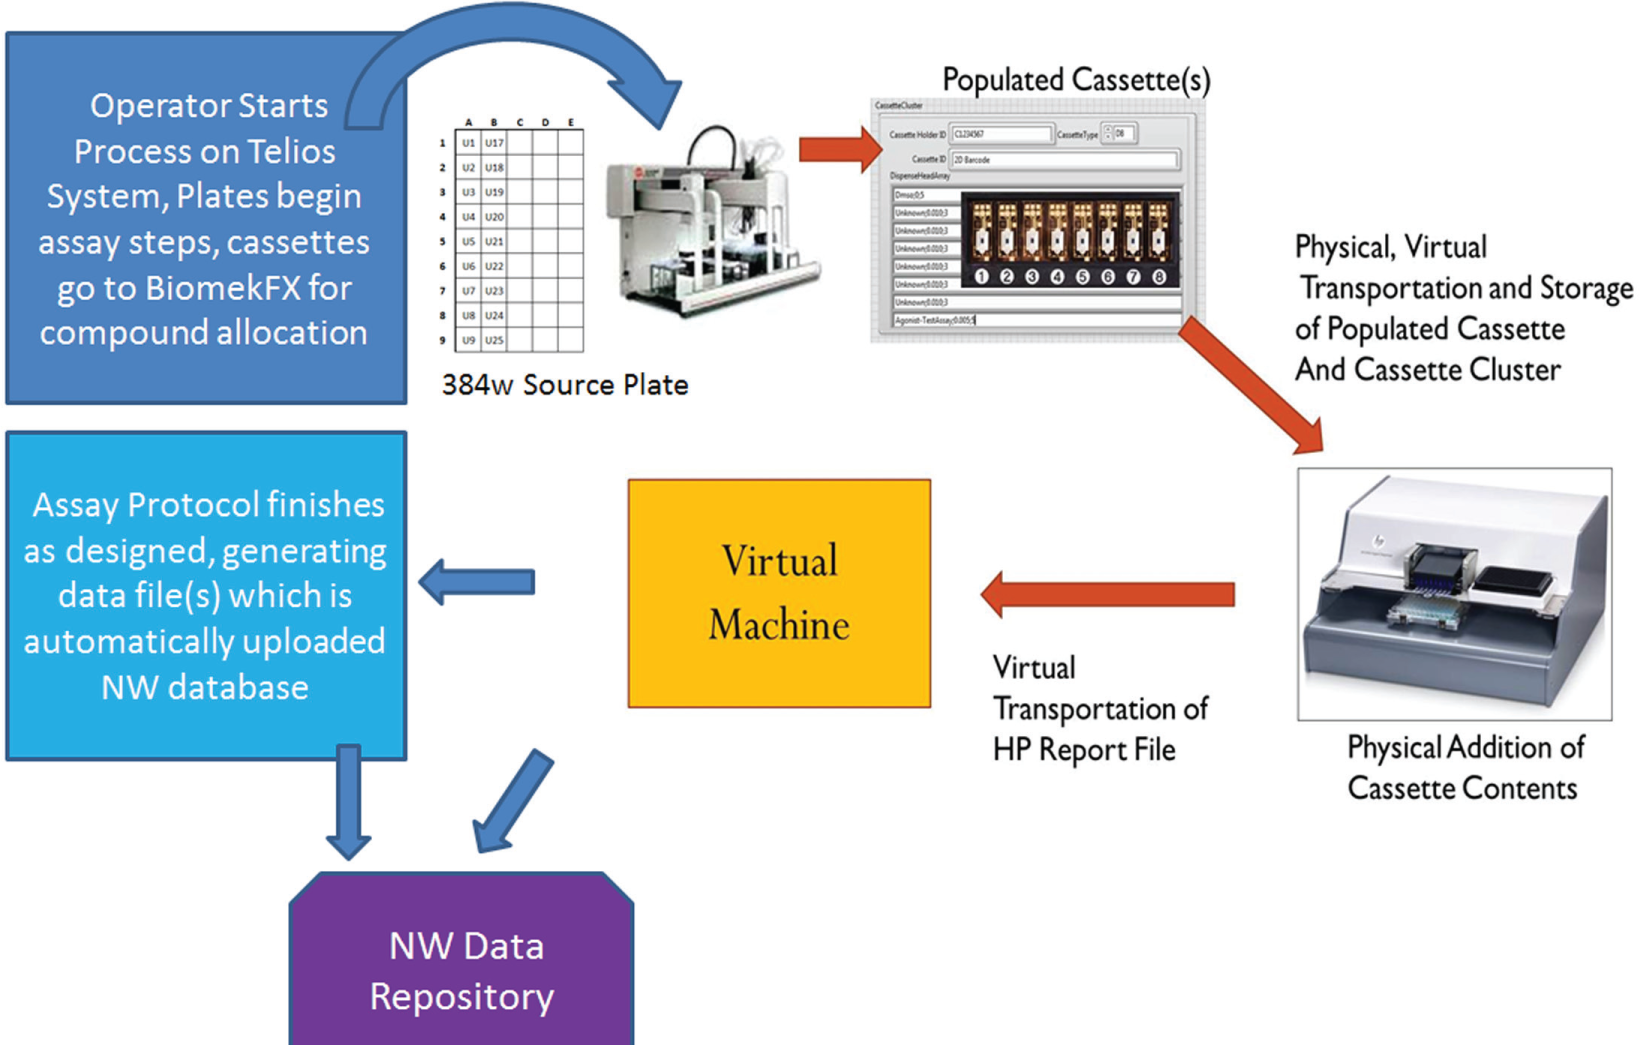
Data workflow. A visual representation of the compound data flow and physical cassette loading and application to assay plate as described in the Robotics/Hardware/Drivers section.
We implemented a functionality in the Telios control system we call iterative parameters. The operator can specify an alternate set of parameters to be run at a specified instrument for user-defined plate numbers. For example, during an agonist shift run, one may periodically want to insert a known control compound in place of an unknown for a set of cassettes. The operator simply creates an alternate cassette cluster that she would want to be run at plates X, Y, etc., in the robotic run. Additional use of these iterative parameters may be set or removed on the fly.
Robotic Tool
One of the major obstacles to integration of D300 was the fact that the D300’s dispense cassette is not able to be handled by a robotic gripper built for handling microtiter plates. To meet this challenge, we developed a robotic tool (
Hewlett Packard’s D300
The D300 handles dispense of the compounds into the assay plate. As per the manufacturer’s instructions, simulation files are produced for the protocol that needs to be run and are accessible by the D300’s Telios instrument driver. Once the first cassette and assay plate are loaded at the D300, the Telios director instructs the driver to start the user-defined process. The Telios control software recalls the compound cluster generated at the Biomek-FX for this operation and provides it to the D300 driver. The D300 subsequently starts the dispense. Protocols with multiple cassettes are enabled with robotic cassette changing as part of the process. The D300 pauses itself and alerts the system a cassette change is required. For the cassette change, the robot will put on the robotic tool, remove the used cassette, put on the new cassette, and tell the dispenser that the cassette has been changed (ManageCassette() command given). A similar process (without the robotic tool) can be used for protocols that call for multiple assay plates (ManagePlate() command given). After the entire dispense is completed, a report is generated that incorporates the information from the cassette cluster and the dispense protocol called in the automated process to generate a plate map. The D300 report uses the compound ID, compound concentration, dispense table locations, and volumes dispensed to create the new plate map indicating which sample is where at what concentration. This plate map is then used by a downstream process (discussed below) to track the contents of each well. Since the D300 provides no feedback on the dispense, we opted to use the simulation file together with the information in the cassette cluster to make our plate map, as opposed to extracting the information back from the D300. While we do not extract the information back from the D300, we do use the SetFluidNames() in the device control. We use this as a safety check to ensure that the information contained in the cassette cluster matches the expected input for a certain protocol, as the device will error if the number of fluid names does not match the expected number.
In the two assays described in this manuscript, GPCR2 uses one cassette in the D300 protocol and GPCR1 uses three cassettes. For the three-cassette protocol, a larger range of compound concentrations (four orders of magnitude) was desired, and for a 1536-well assay, we needed to have two source concentrations in order to reach this range without having too much DMSO at the top concentrations. In the population of the cassettes at the Biomek-FX, the two compound concentrations were populated in adjacent dispense heads on the cassette. Built into the compound manager at the Biomek-FX is logic to handle these situations by identifying duplicate samples in the source plate and arranging them with the higher concentration adjacent to the low concentration in the cassette. Likewise, two stock concentrations of the agonist were used. With the eight unknowns, agonist, a positive control, and backfill DMSO, a total of 21 dispense heads was needed. The dispense time for all dispenses at the D300 was ~16 min. In order to help keep the cycle time lower, we broke the protocol into two parts. One D300 did all the dispenses of the unknowns, and a different one would do the agonist and backfill. This prevented having one protocol step that was exceedingly long. To accomplish this, we produced two simulation files from the D300 protocol with certain fluids being set to dispense or not for the two protocols. Managing the simulation files this way ensured no errors in making two separate protocols and helped keep the fluid names correct for the fluid name check described above.
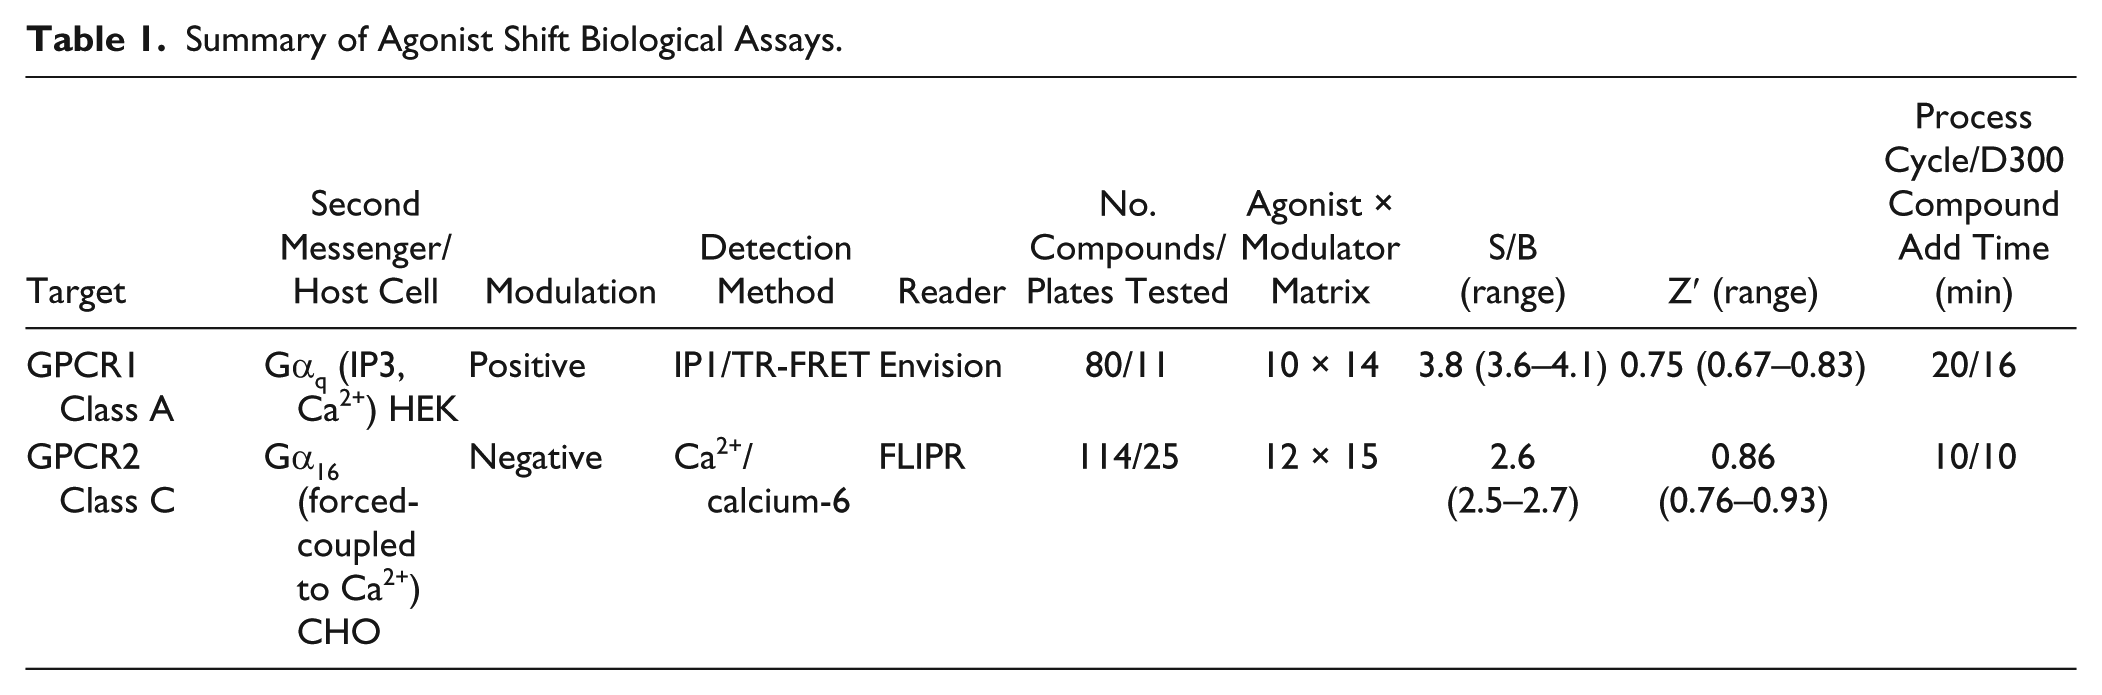
Because of the long cycle times that would result from a strictly in-line process, in the Telios control software, we implemented a functionality we refer to as a parallel call. This allows the operator to program the system to parallel process operations. For example, in one of the assays, the cell plate wash can occur at the same time the cassettes are being populated; this has the advantage of decreasing the overall length of the assay and can help in maintaining lower cycle times. The cycle times for GPCR1 and GPCR2 were 20 min with 24 compounds tested per hour and 10 min with 30 compounds tested per hour, respectively ( Table 1 ).
Summary of Agonist Shift Biological Assays.
Data Handling
Depending on the protocol, we may use one or two D300 dispensers to add compounds to a plate. Once all dispensing is complete, the reports generated by the driver are merged together such that all the plate’s contents are combined showing the mixtures of compounds in each well (e.g., compound 1, concentration 1, and compound 2, concentration 2). In protocols with an aqueous-soluble agonist (such as our Tetra assay reported on here), a standard report is made of that plate map, and this is overlaid on top of the report from the D300. These mixtures are then registered into our local database and assigned a new sample ID that designates both the individual components of the well and their respective concentrations. This new plate map is then registered in our local screening database and is ready to be unified with the data once the plate is read. The procedure just described requires resources that are not dedicated to the screening platform (i.e., the database calls necessary to register our mixture and register the plate). To handle this efficiently and not have the process flow dependent on successful database connections external to the system, we have a dedicated computer to handle these operations and let them run independently (referred to as the “virtual machine” in our system). When a data handling operation is set to run, Telios recalls all the information associated with this assay plate and provides it to the virtual machine and starts the process. The virtual machine acknowledges the request, and Telios continues on to the next step. The handling of these requests is done via a queue. By having a queue, if database calls take longer than the cycle time of the process or if the database connection is unavailable, the new call waits until the preceding call has finished. This allows the assay to finish unhindered by any data handling issues. All data are available post assay, so the registration can be completed at a later time if needed to allow the assay run to complete successfully. Data were analyzed using a method similar to that of Pechter et al. 12
Results
To test the robustness of the D300 and the accompanying automation platform, we examined the behavior of two different, well-established assays for GPCRs overexpressed in a heterologous cell system ( Table 1 ). In prior assay development work, a range of agonist concentrations and dilutions were tested to identify a sufficient number of data points to reliably describe the upper and lower asymptotes, as well as the inflection point, for each receptor agonist response. Agonist concentrations of 10 and 12 points for GPCR1 and GPCR2, respectively, spanning approximately four orders of magnitude were selected ( Fig. 2 ). Furthermore, positive control PAMs for GPCR1 or NAMs for GPCR2 were cross-titrated at different concentrations and dilutions to identify ranges that would adequately saturate the full extent of modulation (see below). Based on the activity of the respective agonist and positive control modulators, plate maps were designed to maximize the number of “unknown” modulators that could be tested in agonist shift format for each GPCR assay while accommodating standard positive and negative controls for each assay. For this study, it was determined that eight positions per plate for GPCR1 in a 10 × 14 matrix ( Fig. 3A , U1–U8) and five positions per plate for GPCR2 in a 12 × 15 matrix ( Fig. 3B , U1–U5) could be achieved. Heat maps from representative assay plates are shown from the GPCR1 assay ( Fig. 3C ) and the GPCR2 assay ( Fig. 3D ) to illustrate the behavior of a variety of unknown modulators tested in the corresponding plate formats.
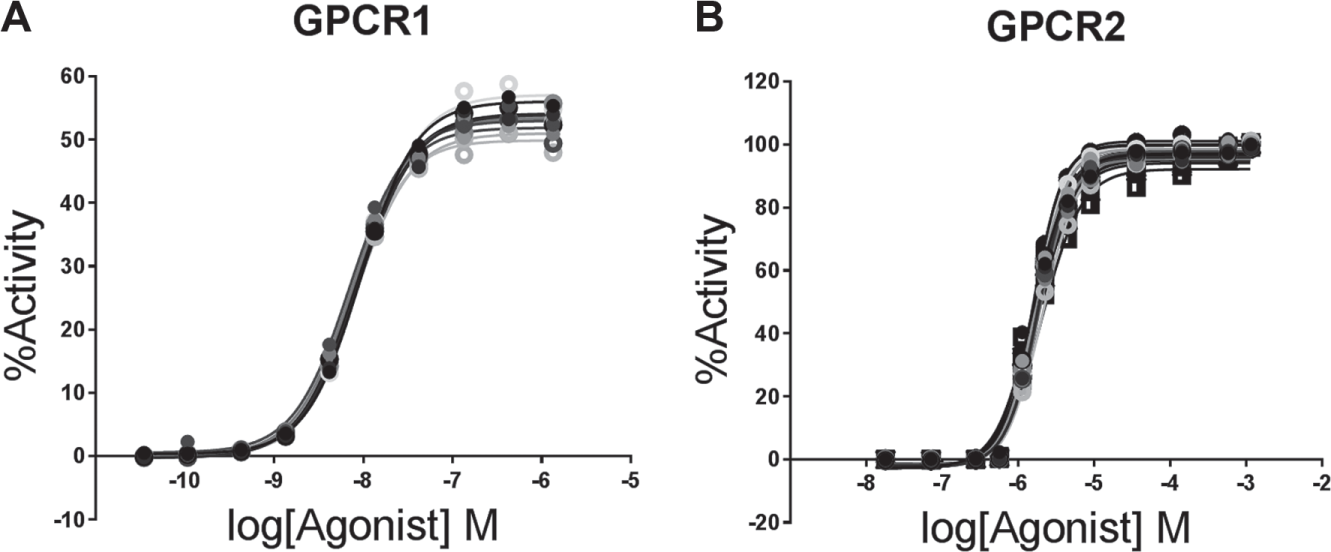
Agonist titrations. An overlay is shown of the agonist titration runs for each of 11 consecutively run plates for GPCR1 (
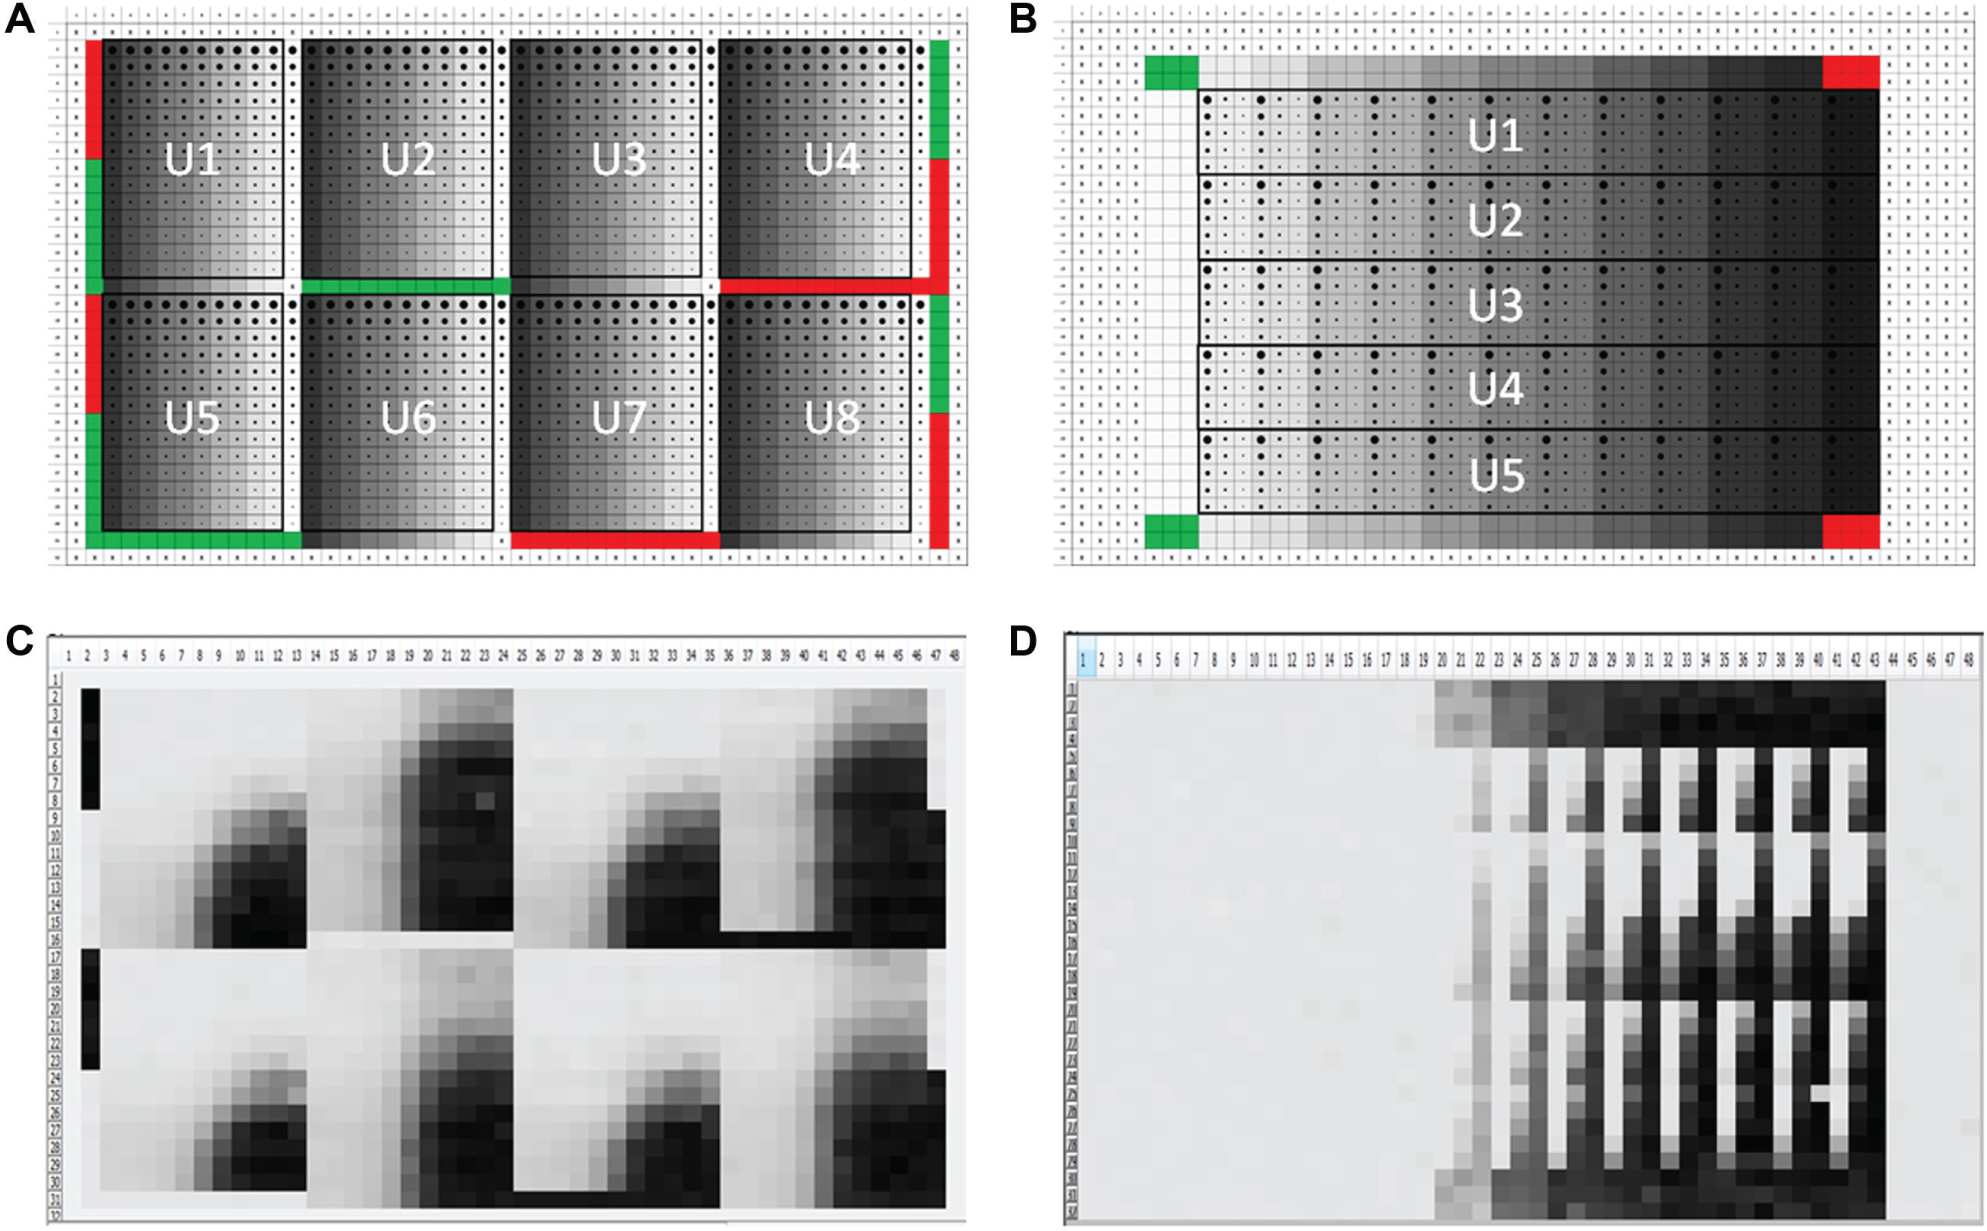
Plate Maps. (
Agonist titrations were performed in replicates on each assay plate (n = 4 and n = 2 for GPCR1 and GPCR2, respectively), and agonist titration curves demonstrated reproducible results across multiple plates ( Fig. 2 ), with EC50 values of 8.8 ± 2.1 nM and 1.8 ± 0.14 μM, respectively. The MSR was also determined to be 1.31 for the GPCR1 agonist and 1.25 for the GPCR2 agonist. To further establish the robust performance of the agonist shift assays, reference modulators were tested in cross-titration in different positions on the assay plate. Data from two example modulators for GPCR1 are shown with the resulting curve fits ( Fig. 4A , E ). Both of these modulators demonstrate saturable effects on agonist shift, enabling global fit of an allosteric model. Allosteric modulators can have multiple effects on a receptor, changing the potency (alpha) and/or maximal effect (beta) of an orthosteric agonist, as well as directly affecting the receptor response (tauB). The magnitude of the changes can be quantified with an allosteric model generating the parameters alpha, beta, and tauB from fits to the data. 4 Figure 4B–D , F–H illustrates the stability of these values for the two reference compounds for GPCR1 across multiple positions within a plate and across multiple plates.
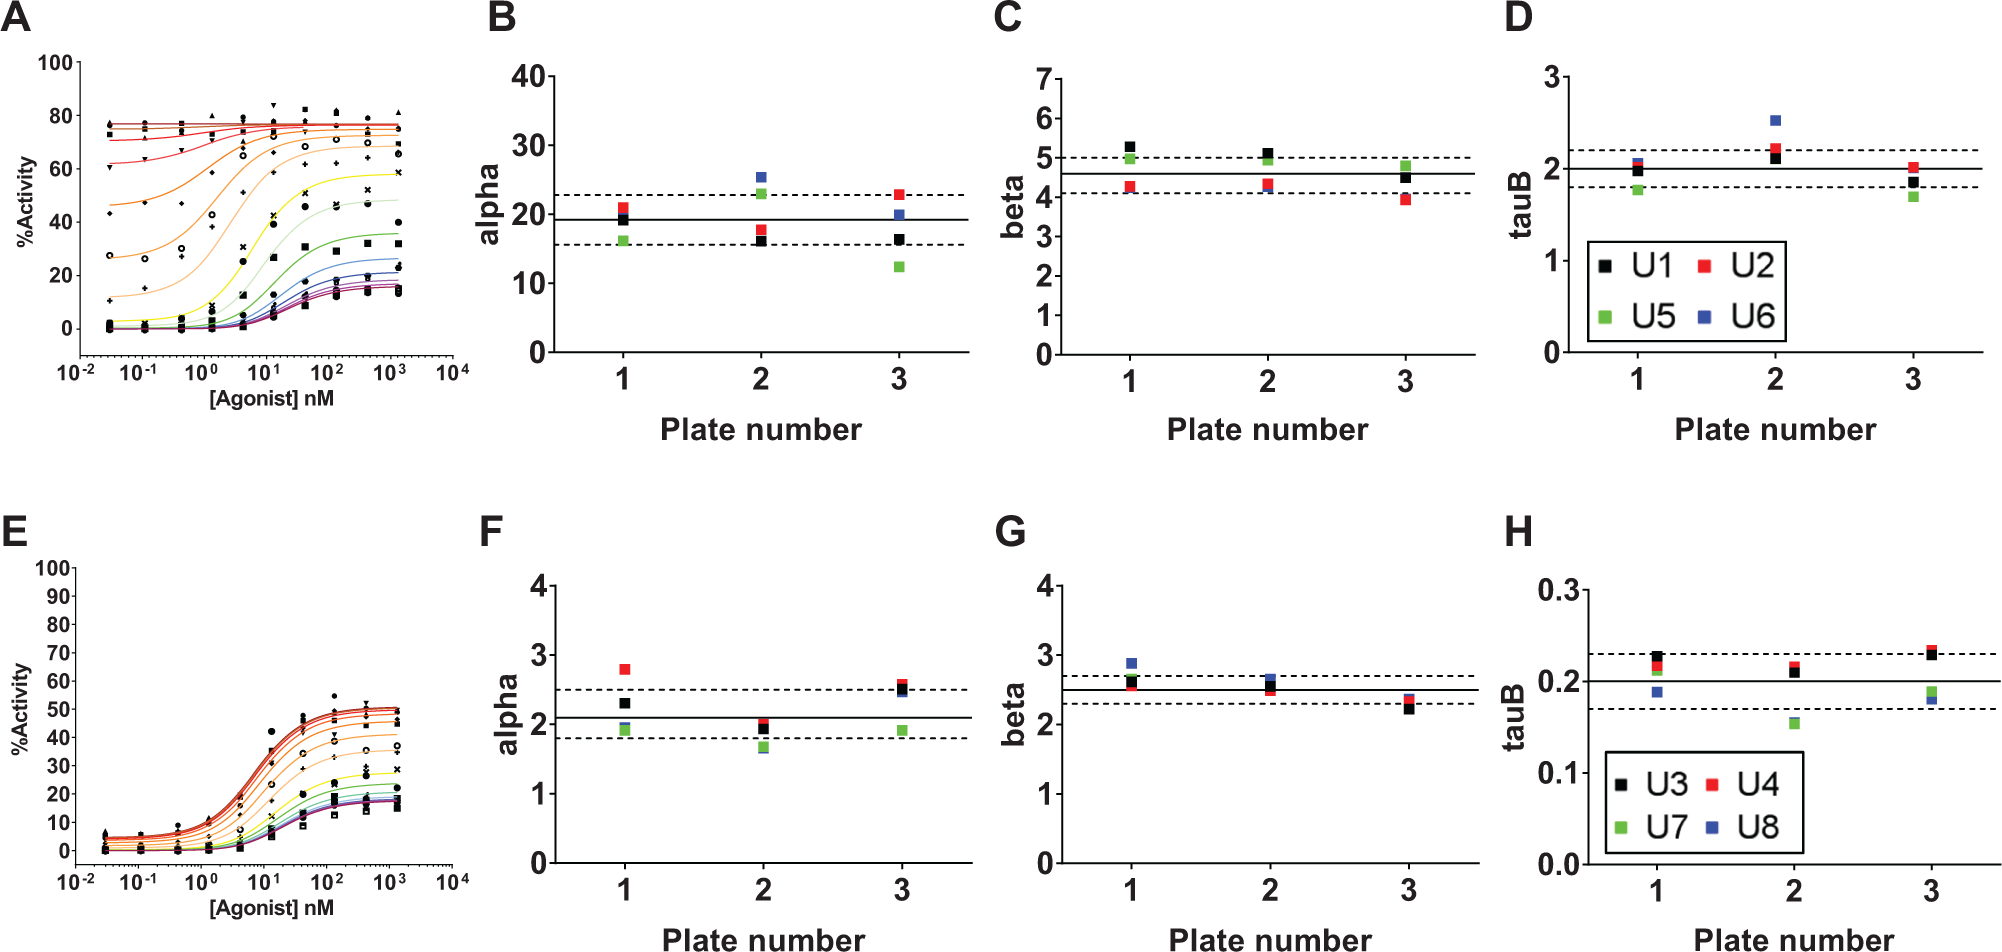
Positional reproducibility. Agonist shift results for two different GPCR1 allosteric modulators are shown, one with strong effects on all three global fit parameters (
To fully employ the capabilities of this platform, we examined a larger number of test modulators across a run of multiple plates for GPCR1 and GPCR2 ( Table 1 ). While standard screening quality control measures, such as signal-to-background ratio (S/B) and Z′, were monitored on every plate ( Table 1 ), we also wanted to ensure that agonist shift was reproducible as well. To track the reproducibility of allosteric modulation, the iterative parameters feature was employed to introduce a positive control PAM or NAM for GPCR1 or GPCR2, respectively ( Fig. 5A , B ), at regular intervals during the run. For GPCR1, the PAM (same compound used in Fig. 4A ) was introduced in one unknown position on every other plate to generate five replicates in the 11-plate run. Similarly for GPCR2, a known NAM was introduced into one unknown position on four plates to generate six replicates in the 25-plate run. These compounds exhibited reproducible global fit values during the run ( Fig. 5 C , D ).
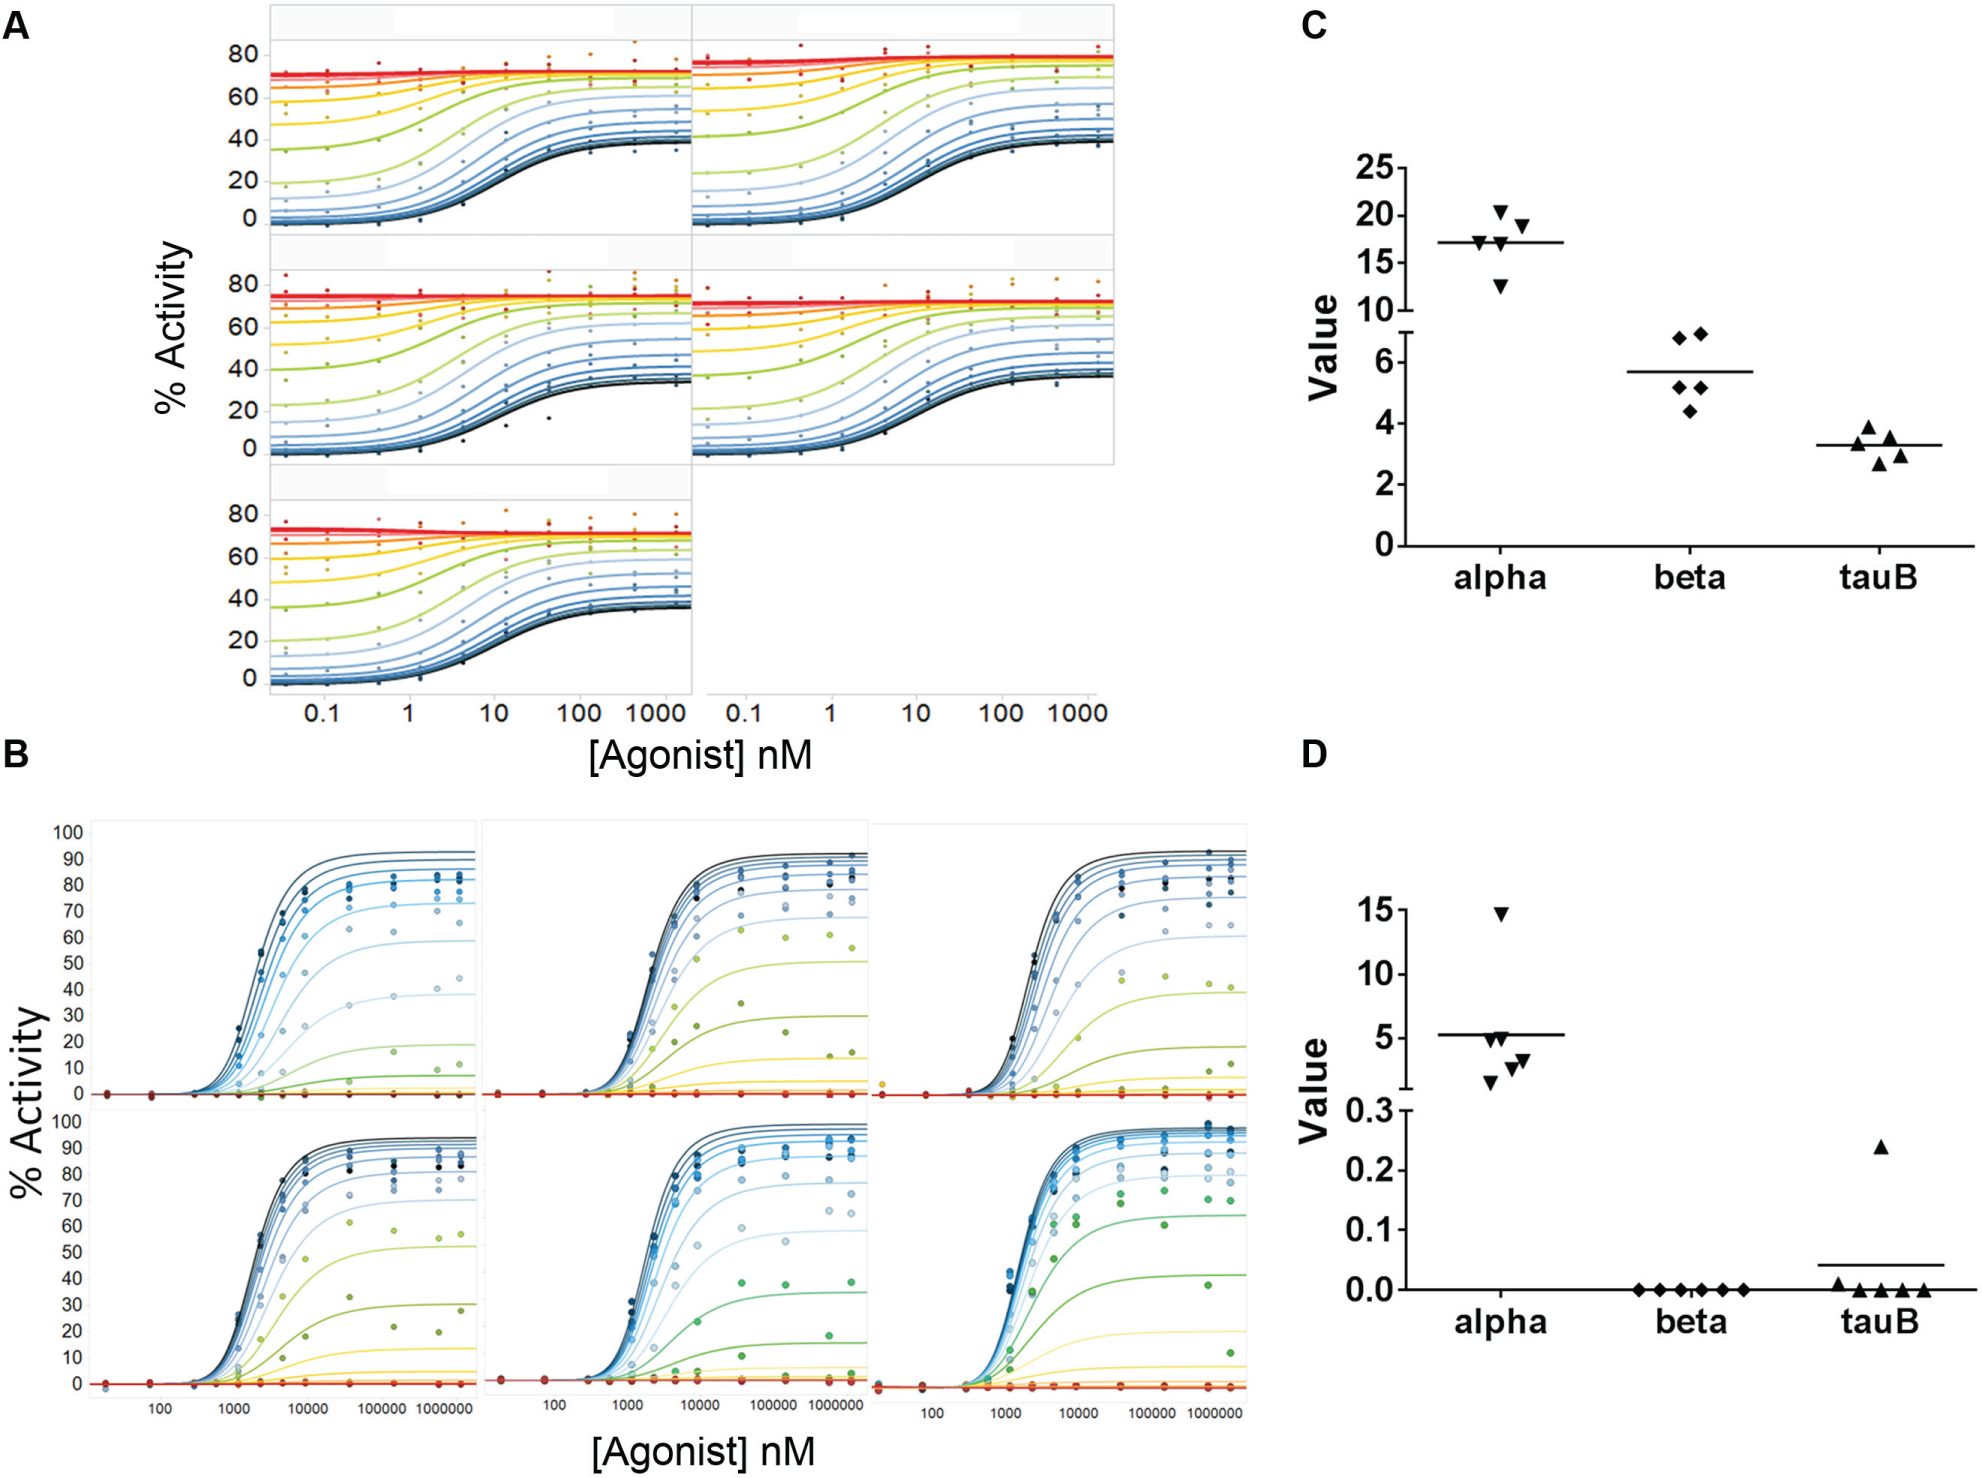
Reference compound repeats. Agonist shift data with global fit curves for the GPCR1 (
Among the compounds tested for GPCR2, a sizable subset (22 of 94) appeared not to saturate within a given range of test concentrations, an example of which is shown in Figure 6A . The lack of saturation can lead to inaccurate assessments of allosteric parameters. 3 The experiment was subsequently repeated, but with a higher starting concentration to capture the full effect of these compounds ( Fig. 6B ). Although the shift in alpha, the primary parameter affected by the NAMs in our GPCR2 study, for this example was modest (1.5-fold greater in the low range over the high range), alpha values were overestimated by >2-fold in eight of the unknown modulators.
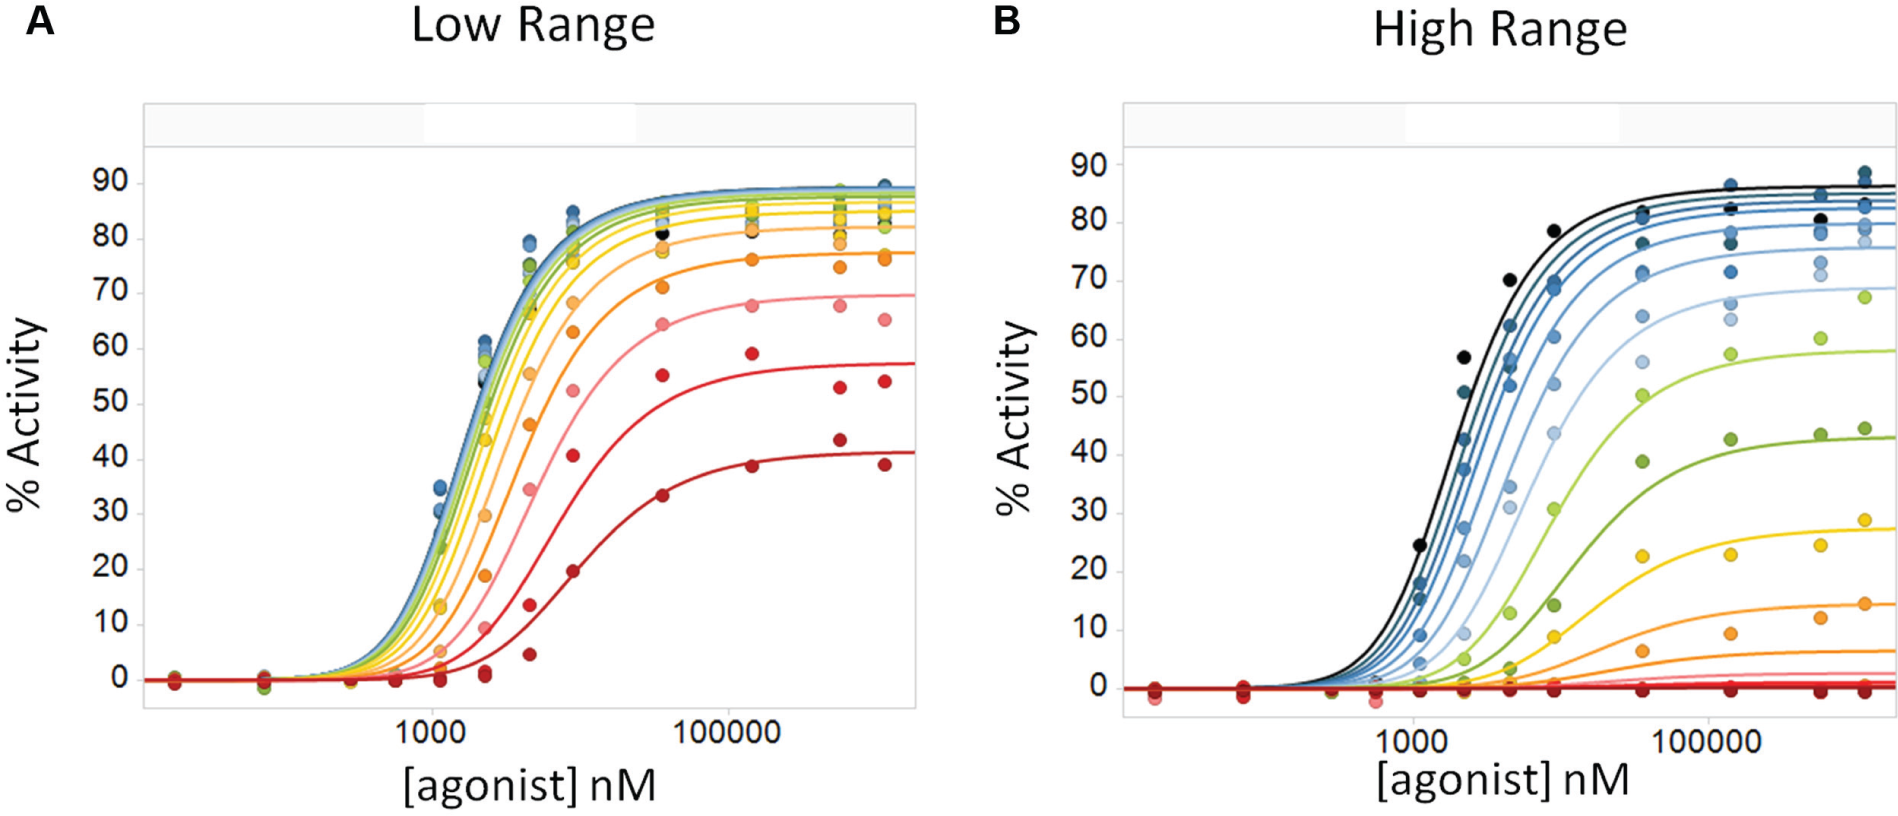
Testing different modulator dose ranges. (
Following data generation, an automated analysis was employed driven by PipelinePilot and Prism to fit the data. 12 Figure 7 illustrates one approach to visualize the resulting agonist shift data in Spotfire, facilitating the formation of subcategories of modulators based on their relative effects on global fit model parameters.
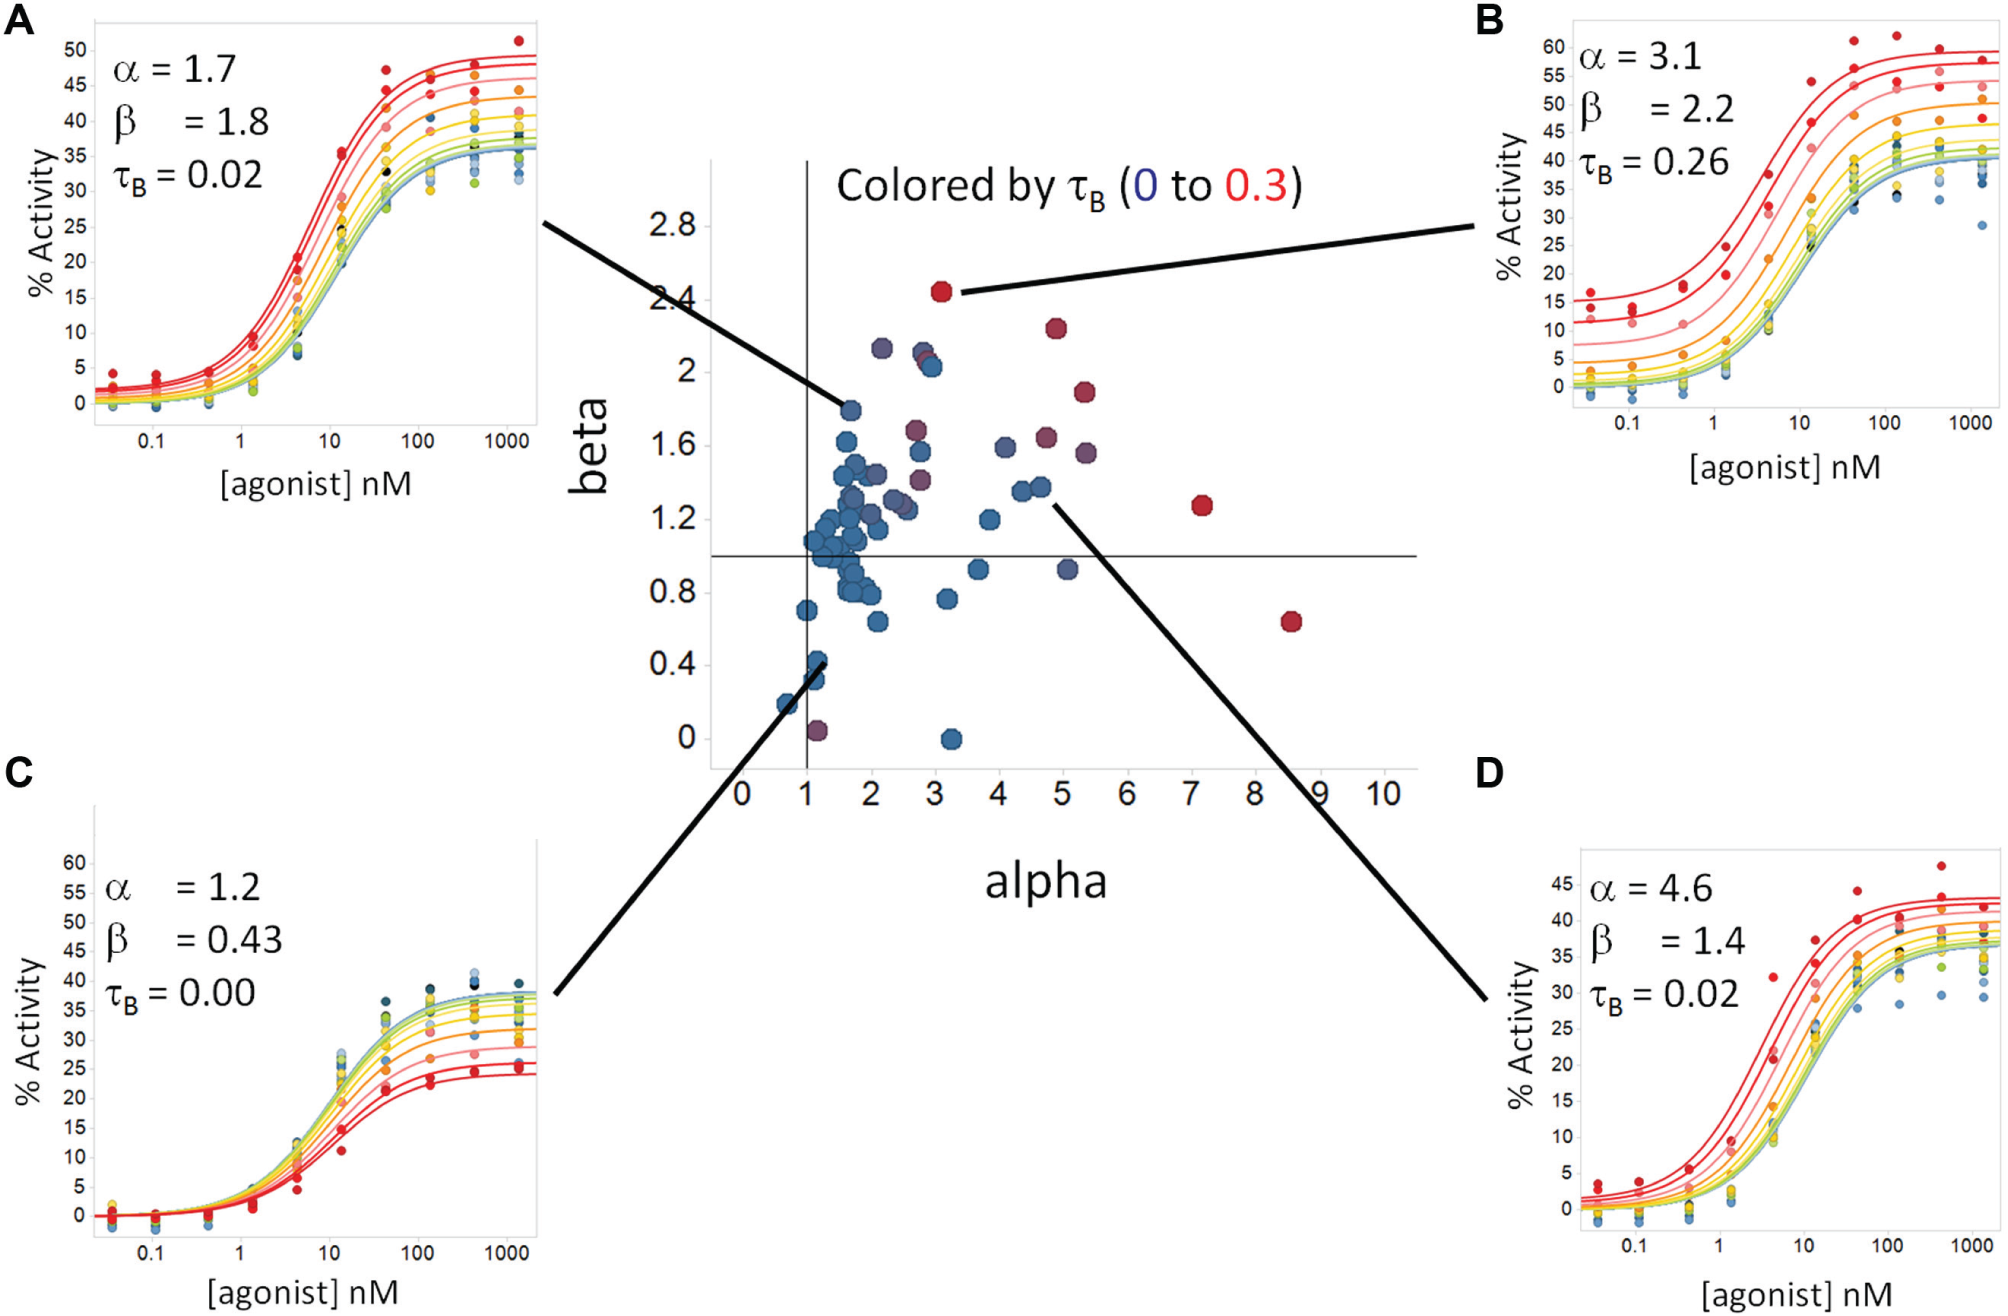
Bucketing compounds. Center: A plot of alpha vs. beta is shown for GPCR1 modulators in which the individual compound values for tauB are colored from blue to red (0–0.3). Agonist shift plots with global fit curves (
Discussion
In this study, we illustrate the flexibility and robust behavior of our robotic platform to examine agonist shift assays for two different GPCRs. By integrating the D300 digital dispenser onto a robotic platform and implementing a series of automation, compound, and data management tools supporting the process, we have been able to fully automate this process in a 1536-well format ( Fig. 1 ). Although acoustic dispense of compounds is feasible to support agonist shift experiments in a 384-well format, 8 the D300 enables a wider range of dispense volumes, and thereby compound concentrations, from a given chip, facilitating increased data points in the agonist × ligand concentration matrix. For acoustic dispensing, a typical bottom volume is 2.5 nL for the LabCyte ECHO (Sunnyvale, CA). For a 1536-well assay, one can quickly hit a limit on DMSO since the volumes just go up from that low end. Assuming a 5 μL assay volume and 2% DMSO as the tolerance, a top volume becomes ~20 nL (depending on percent DMSO in the compound stock). That leaves less than one log of workable volume from a single compound stock. To get a wide range of doses, multiple stock solutions would have to be available. With the D300, 13 pL is the bottom volume for dispensing, so going from 13 pL up to 20 nL from a single stock gives a >1000-fold concentration range without creating additional starting concentrations. Additionally, the user interface of the D300 makes the creation of cross-titration plate maps very simple and easy to change as needed. Within the context of our process, it is very easy to repeat, modify, or exclude compounds without needing to create new source plates. Depending on the protocol, if the data are found to not be in the ranges desired in the early plates, the dispense volumes can be changed on the fly by creating a new simulation file for plates later in the run. For our work, these advantages outweighed the disadvantage of having to fill the cassettes and move them within the system.
Using cross-titrations of 100–200 data points, reproducible results can be obtained within a plate and across multiple plates in a run, as illustrated by the positive control modulators for each respective GPCR ( Figs. 4 and 5 ). The system is sufficiently robust to test nearly 100 compounds in the course of 1 day, with a potential to expand to much larger compound sets. The flexibility both in the system design and in the D300 to test a wide range of compound concentrations enabled achieving complete data sets for modulators with different potencies ( Fig. 6 ). The full automation of assays to help characterize the behavior of allosteric modulators of GPCRs will be a major advancement in effective identification of a variety of profiles with respect to modulator effects on agonist potency, efficacy, and endogenous modulator activity. By expanding the analysis of allosteric parameters to hundreds to thousands of compounds, these data can be used earlier in a screening triage to enable proactive testing of specific hypotheses and development of SAR around the relative contributions to alpha, beta, and tauB, rather than discerning these properties retrospectively due to lower-throughput approaches on fewer compounds. 14 In addition, by integrating the HP D300 dispensers onto a screening platform, as well as enabling the underlying information tracking, we have been able to successfully overcome this hurdle while not imposing a huge burden on our compound management group to prepare large numbers of titration plates in various different plate maps and orientations. The D300 offers us the ability not only to do a large initial triage of the compounds, but also to then refine the data by doing further analysis of select compounds under different conditions without having to create new source plates. This flexibility is illustrated with GPCR2, where a number of compounds with different relative potencies were tested at different ranges of concentrations ( Fig. 6 ). Furthermore, the same processes implemented for agonist shift studies may similarly be employed for enzyme kinetics, buffer scouting, and other processes requiring extensive cross-titrations while limiting compound volumes.10,15
Footnotes
Acknowledgements
We would like to thank Adam Weinglass, David Pechter, Rumin Zhang, and Mary Jo Wildey for reviewing our manuscript and providing useful input for this work.
Supplementary material for this article is available online.
Declaration of Conflicting Interests
The authors declared no potential conflicts of interest with respect to the research, authorship, and/or publication of this article.
Funding
The authors received no financial support for the research, authorship, and/or publication of this article.
References
Supplementary Material
Please find the following supplemental material available below.
For Open Access articles published under a Creative Commons License, all supplemental material carries the same license as the article it is associated with.
For non-Open Access articles published, all supplemental material carries a non-exclusive license, and permission requests for re-use of supplemental material or any part of supplemental material shall be sent directly to the copyright owner as specified in the copyright notice associated with the article.