
Abstract
Low-coherence interferometry is presented as a method for nondestructive, noncontact, and high-resolution measurement of liquid volumes and fill heights in microplates. A Meniscense (Bolton, MA) prototype system captures both fill height and meniscus shape and combines them into a volume measurement, allowing for the measurement of a wide range of liquids with different meniscus shapes. The system has a liquid fill height resolution of 0.7 µm, corresponding to a volume resolution of 0.02 µL in a typical 96-well plate, demonstrated in an ideal model system. Initial data on the gravimetric verification of volume measurements on aliquots of distilled water between 50 and 350 µL in a 96-well plate suggest an inaccuracy of volume measurement of <2%. The Meniscense system offers accuracy comparable to ratiometric photometry, the only commercially available high-resolution volume measurement system. Its fill height resolution is substantially better than that of ultrasonic ranging, the only other noncontact, nondestructive method for fill height measurement.
Introduction
A typical biology or chemistry experiment or diagnostic assay relies on transferring aliquots of liquid samples, reagent solutions, or suspensions of cells or beads to reaction vessels such as microplate wells. Interpreting assay results relies on knowing the concentrations of reactants and reaction products. This, in turn, requires knowing the concentration of each liquid constituent and how much of it was actually added to the total assay volume. While there are a number of established approaches to determining reagent concentrations, such as photometric or fluorimetric assays, determining liquid volumes to a high degree of precision and accuracy in a comparably convenient and automatable process has remained a challenge.
Separately, a method that allows for nondestructively measuring sample volumes at high resolution for a wide range of liquids to quantify the liquid transfer precision and accuracy of automated liquid handling equipment could complement existing dye-based and, therefore, inherently destructive methods as a useful tool for quality control in automated laboratory workflows.
Depending on the reason for determining liquid volumes, a variety of technologies are currently employed. Gravimetric testing can determine sample volumes from sample masses with high resolution and is the generally accepted standard for testing of sample volumes delivered by piston-operated pipettes. ISO 8655 specifies the readability of scales used for gravimetric testing as a function of sample volume as 0.001 mg for sample volumes between 1 and 10 µL, 0.01 mg for volumes between 10 and 100 µL, and 0.1 mg between 100 and 1000 µL, which, at a rounded density of 1 mg/µL for a prototypical aqueous sample, yields values for the volume resolution of between 0.01% and 0.1% of sample volume or 0.001 to 0.1 µL. Using gravimetric testing requires knowing the density of the sample, which, in the case of scarce and complex biological samples, may not be independently known or easily obtained. The mass of an empty or partially filled plate (45–80 g for typical 96-well plates and liquids) exceeds the mass limit of the most sensitive scales, and the need to tare this weight precludes their use for applications involving microplates. Scales with sufficient capacity to handle the weight of an empty or partially filled plate have a readability of 0.01 mg, imposing a practical lower limit of 0.01 mg (or 0.01 µL, for aqueous solutions) on the resolution. 1 Rhode et al. 2 report a standard deviation of 0.066 mg (or 0.066 µL for aqueous solutions) for weighing microplates. In many practically relevant cases, the volumes of several samples that have been added simultaneously to a microplate need to be determined independently. Here, gravimetric testing can at best provide a mean volume per well but not well-by-well volume information.
Ultrasonic ranging uses the time of flight of an ultrasound pulse traveling from the sensor to a reflective surface, such as a microplate or liquid surface and back. It is used in a variety of commercial instruments to determine the liquid fill height. For a commercial 96-well flat-bottom microplate with a well bottom diameter of 6.35 mm, a well top diameter of 6.86 mm, and a well depth of 10.67 mm, a change in liquid fill height of 1 µm corresponds to a change in liquid volume of between 0.032 and 0.037 µL, depending on the volume of liquid in the well. At a volume of 100 µL, the value is 0.033 µL/µm. Throughout this article, we use this value to translate values for uncertainty in fill height resolution into volumes as an experimental quantity presumably more familiar to readers. Typical ultrasonic distance sensors3,4 achieve z-height resolutions of 200 to 300 µm, which in a typical 96-well flat-bottom microplate corresponds to a volume resolution of 7 to 10 µL. These sensors operate at a frequency of 380 kHz, which corresponds to a wavelength of ca. 900 µm in air. This relatively long wavelength limits the spatial resolution of ultrasonic sensors, because the portion of the liquid surface that is within the acceptance angle of the sensor may be too small to be resolved, a challenge particularly in wells that have a nonflat bottom or in the presence of strongly curved menisci. In smaller wells, such as those in 1536-well plates, this wavelength is comparable to the size of the well opening, and diffraction of the wavefront at the well opening prevents an ultrasonic fill height measurement: the ANSI/SLAS 4-2004 (R2012) standard 5 prescribes a spacing of well centers of 2.25 mm for 1536-well plates, and several commercially available microplates have well opening diameters or edge lengths of 1.7 to 1.8 mm.
Acoustic liquid transfer instruments use the time of flight of an ultrasonic pulse through the liquid to determine liquid fill height to calibrate the dispense operation. However, the cost and complexity of these instruments make their use as a tool for volume measurement impractical.
In well pressurization, 6 a microplate well is temporarily sealed to a syringe, creating a combined volume of the syringe and the well. Reducing this volume by depressing the syringe leads to a rise in pressure. This pressure increase can be monitored and used to deduce the volume of the gas-filled headspace in the well. The volume of any solid or liquid well contents is the difference between the volume of the empty well and the volume of the headspace. For volumes less than 150 µL, this instrument achieves a random volume error of less than 2 µL and a systematic volume error of ±5 µL. 7 In this method, the fact that the gasket is reused and necessarily touches the rim of the well creates the potential for sample contamination.
Photometric methods2,8 rely on adding dyes to the liquid to be transferred and measuring the absorbance of the well after the transfer. According to the Lambert-Beer law, the measured absorbance is the product of the molar decadic absorption coefficient of the dye at the measurement wavelength, the molar concentration of the dye, and the path length of light through the liquid sample. In microplate readers with vertical beam paths, the path length varies spatially within a well with the shape of the liquid meniscus and is difficult to determine individually. In practice, this method, therefore, relies on an empirical calibration that accounts for the influence of the plate reader’s beam geometry and the sample’s meniscus shape. Rhode et al. 2 report a photometric calibration routine that can characterize the coefficient of variation of transferred sample volumes to within 0.3%. Ratiometric photometry 9 is a well-known method to overcome these limitations through the use of two dye solutions and a plate reader calibration routine and achieves a precision of 0.4% and an accuracy of ±2%. 10
Fluorimetric methods rely on adding fluorophores to the sample to be transferred and deducing the transferred sample volume from the fluorescence signal. Rhode et al. 2 present a fluorimetric calibration routine that can characterize the coefficient of variation of transferred sample volumes to within 0.5% in 96-well plates, to within 1.0% in 384-well plates, and to within 1.6% in 1536-well plates.
While photometric and fluorimetric methods can achieve high resolution, the required addition of a dye means that the sample is irrecoverably altered, making these inherently destructive testing methods.
Meniscense’s volume measurement technology (Meniscense, Bolton, MA) uses low-coherence interferometry to determine liquid fill height in containers and microplate wells. Low-coherence interferometry is a well-known technique used to study the shape of reflective surfaces at high resolution 11 (e.g., the surfaces of optical components or of microelectromechanical systems). This article reports on the performance potential of low-coherence interferometry for measuring liquid volumes in containers and microplates.
Materials and Methods
The experiments described here use an imaging low-coherence Michelson interferometer as described previously 12 and are schematically depicted in Figure 1 . Briefly, light from a light-emitting diode with a nominal center wavelength of 627 nm and a spectral half width of 30 nm (LXML-PD01-0040; Lumileds, San Jose, CA) as a broadband light source (LS) is separated by a beam splitter (BS) into a reference beam (RB) and a sample beam (SB). A reference mirror (RM) reflects the reference beam back to the beam splitter, and the sample surface reflects the sample beam back to the beam splitter. The beam splitter superimposes images of the reference and sample surfaces on a detector (D), which converts light intensity into an electrical signal. In this prototype, a monochrome CCD detector (Chameleon; Point Grey, Richmond, BC, Canada) is used. The difference between the optical path lengths traversed by the sample and reference beams is varied by moving the interferometric fill height sensor, attached to a z-translation stage, relative to the sample, and recording its position with a 100-nm resolution linear encoder (Veratus; Celera Motion, Bedford, MA). A typical signal recorded by one pixel in the detector is shown in Figure 2 . As the fill height sensor is moved, the detector records a sequence of light and dark interference fringes, shown in Figure 2A . When the difference between the optical paths traversed by reference and sample beam impinging on this pixel is an integer multiple of the wavelength, an intensity maximum is observed, and when the path length difference is an odd multiple of half the wavelength, an intensity minimum is observed. The contrast between interference maxima and interference minima and the envelope of the signal, shown in Figure 2B , peak when sample and reference path lengths are equal. The centroid of the envelope, and hence the location of the sample surface at this pixel, is determined from the peak of the envelope shown in Figure 2B using a fitting algorithm. Interference is only observed over a limited range of path length differences corresponding to the coherence length of the light source, which was determined as 8.4 µm (full width at half maximum) by fitting a Gaussian to the envelope in Figure 2B . It is this property that makes low-coherence interferometry well suited to locating the absolute position of reflective surfaces in space. In the present instrument, the microplate is held in a known position relative to the sensor. Therefore, the liquid fill height can be deduced from the elevation of the plate bottom and the liquid surface.
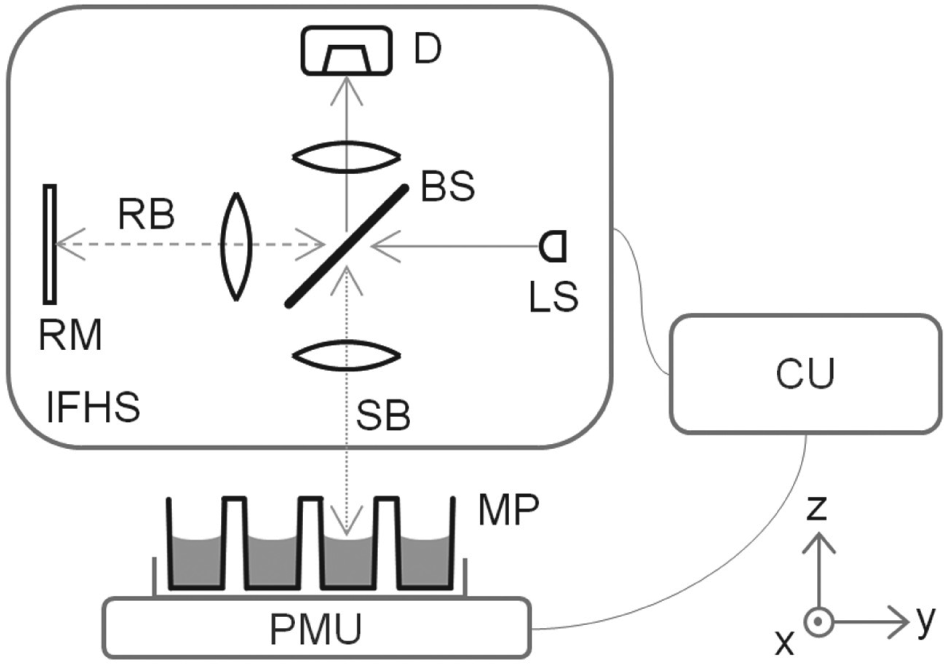
Schematic depiction of the interferometric volume reader, consisting of the interferometric fill height sensor (IFHS), a plate motion unit (PMU) holding a microplate (MP), and a control unit (CU). In the IFHS, light from a light source (LS) is directed toward a beam splitter (BS). The BS directs part of the incident beam as the sample beam (SB) toward the sample surface. The other part of the incident beam is directed as the reference beam (RB) toward a reference mirror (RM). The reflections of both beams are recombined at the BS and imaged onto the detector (D). The xyz vectors in the bottom right corner illustrate the convention used in the text for the orientation of the device.
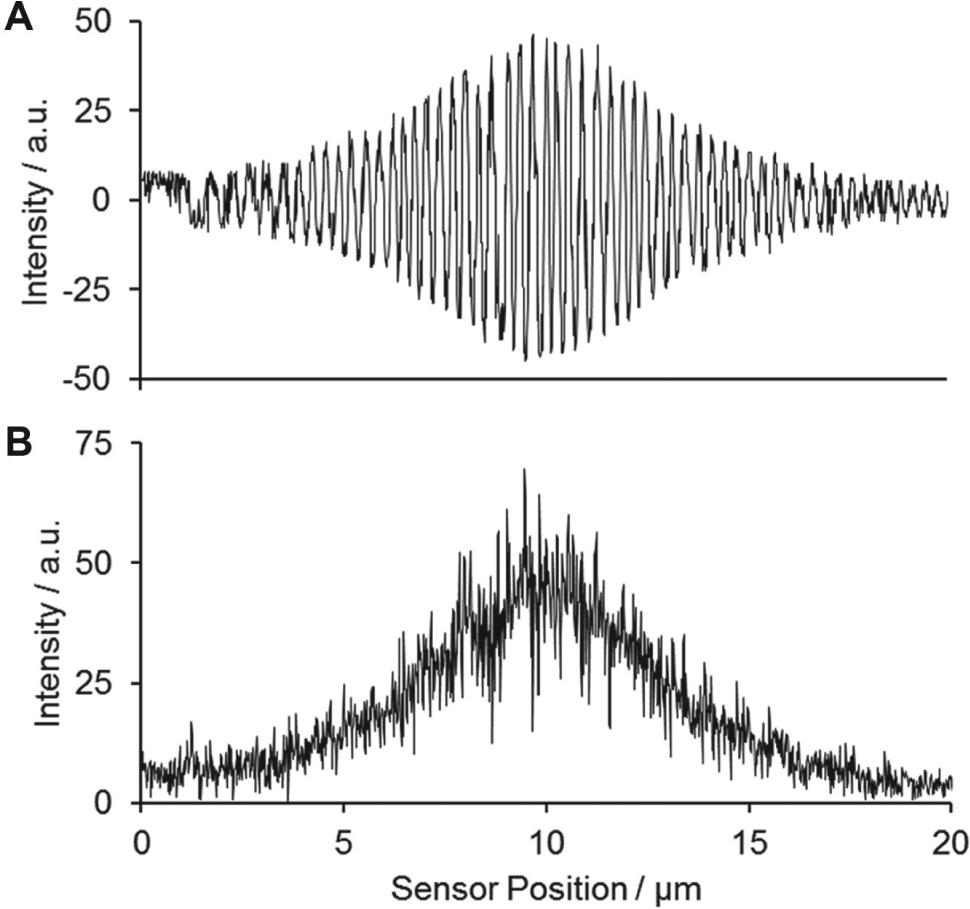
Interference signals. (
The prototype discussed here acquires images at a video rate of 30 Hz, and taking a height scan from a well takes several 10 s. The working distance is 75 mm, ensuring that fill height measurements in deeper containers such as deep-well blocks will be possible. The imaging system of the sensor has a numerical aperture of 0.15. This implies a diffraction limit on the spatial resolution in the xy-plane of ca. 2.6 µm (Rayleigh criterion), sufficient to image even small wells with edge lengths on the order of 1.7 mm, as they occur in 1536-well microplates.
Substantially faster sensors are known in interferometry, and their adaptation to volume measurement is under development. Another prototype explored during this work, also described previously 12 and not shown here, acquires point measurements at a frequency of several kHz, using standard telecommunications optical fibers for beam delivery and a near-infrared superluminescent diode with a center wavelength of 1310 nm as the broadband light source (EXS210032-02; Exalos AG, Schlieren, Switzerland). Using this prototype, early results have been obtained from liquid menisci with a z-height resolution of 1.2 µm, corresponding to a volume resolution of ca. 0.04 µL in 96-well plates. These early results with this prototype indicate that higher data rates are possible, that near-infrared light can be used in the probe beam to measure the volumes of samples that are susceptible to photodamage when visible light is used, and that the probe beam can be delivered to the sample in a compact optical fiber assembly, important for potential integration with other instrumentation.
Like other sensors relying on the specular reflection of a signal, the sensor has a limited acceptance angle. Interferograms with good contrast have been obtained from sample surfaces inclined by up to ±1 degree relative to the plane normal to the optical axis. In practice, this means that, for most liquid menisci, z-height measurements can only be obtained from a limited area around the apex of the meniscus where the deviation of the surface angle from the horizontal is within the acceptance angle of the sensor.
Measuring liquid volumes in microplates with high resolution requires capturing the shape of the meniscus. The location of points described by Euclidean vectors
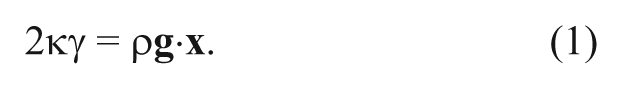
In equation (1), κ is the curvature of the interface, ρ is the density of the liquid,
For simplicity, this discussion focuses on flat-bottom wells with a round horizontal cross section, with the case of other horizontal well cross section geometries being analogous. Geometrically, the space occupied by liquid in a well is described as the sum of two shapes: a cylindrical cone and a “cap” that describes the meniscus shape. The end faces of the cone are determined by the bottom of the well and the parallel plane touching the apex of the meniscus. Its side walls are determined by the shape of the well and have a slight inclination, due to the draft angle of the mold used during production of the plate, as illustrated by Bradshaw et al. 9 In a concave meniscus, the lower boundary of the cap is the plane through the apex of the meniscus, the upper boundary is the liquid meniscus itself, and its sidewalls are the walls of the well. In the case of a convex meniscus, the volume of the cap would be subtracted from the volume of the cylindrical cone.
To establish the instrument’s ability to correctly capture the shape of a known surface, the surface of a concave, uncoated, N-BK7 glass lens (LC1120; Thorlabs, Newton, NJ) with a nominal focal length of −100 mm was used as a fixed mock meniscus.
Stainless bearing balls with diameters of (1.000 ± 0.0025) mm and (2.000 ± 0.0025) mm were used in some experiments for mock dispenses to add a defined incremental volume to wells already containing liquid (1598K16, 1598K18; McMaster Carr, Elmhurst, IL).
For an independent, gravimetric verification of measured volumes, an internally calibrated precision weighing module with a repeatability and readability of 0.1 mg was used in some experiments (SAG 204; Mettler Toledo, Columbus, OH).
The accuracy of liquid volume measurements in containers or wells obtained by interferometric fill height and meniscus shape measurements relies on well-characterized container dimensions: the container walls form the boundary of the liquid volume that is not formed by the liquid meniscus. The same holds true for any other high-resolution volume measurement based on fill heights, such as ratiometric photometry. 9 To compare volume measurements from interferometry with an independent gravimetric measurement, the following ad hoc characterization of a well in a commercial polystyrene 96-well flat bottom microplate was carried out (Corning, Lowell, MA), for the same well in which the experiment was conducted. The depth of the well was measured as 10.695 mm (nominal 10.67 mm) as the difference between the interferometrically ranged elevations of the well bottom and the well top. Then, an aliquot of mineral oil was added to the well. Mineral oil forms repeatable menisci and is therefore well suited for this type of experiment. The height of the apex of the meniscus was determined. Then, a 2-mm diameter stainless bearing ball with a volume of (4.19 ± 0.02) µL was dispensed into the well, and the new meniscus height was measured. This was repeated for three balls, and the well radius at this fill height was calculated from the average liquid level rise at the apex of the meniscus. Two more aliquots of mineral oil were added, and the same sequence of steps was carried out, yielding a total of three pairs of well radius and elevation measurements, which were used to extrapolate the well diameter at the bottom (measured: 6.308 mm; nominal: 6.35 mm) and at the top (measured: 6.736 mm; nominal: 6.86 mm) of the well. This characterization of the well shape was carried out after the gravimetric verification experiment to avoid that mineral oil–contaminated well surfaces affect experimental results.
Results
Surface Shape and Elevation Measurement
To establish the repeatability of the surface elevation and surface shape measurement, 10 measurements of the surface profile of a glass lens were carried out. In between measurements, the relative x- and y-positions of the stage were not varied, and the stage was moved back to its initial z-position. For each measurement, the radius of curvature of the lens was determined by numerically fitting a spherical surface to the experimentally obtained surface elevation in an area of approximately 0.4 × 0.4 mm2 around the apex of the lens. The mean radius of curvature obtained from these 10 measurements was 50.08 mm, with a standard deviation of 0.76 mm. The nominal radius of curvature of the lens was (51.5 ± 0.5) mm, and no attempts were made to independently measure the specimen used for this experiment. To illustrate the effect of an error in the measurement of surface shape on the measurement of a sample volume, it was assumed that the center portion of the lens forms an imaginary meniscus in a round container with a radius between 3.18 and 3.43 mm, the nominal radii of a well in a 96-well plate used elsewhere in this study, at the bottom and the top of the well. If the lens were in fact a liquid meniscus, the standard deviation of the measured curvatures of 0.76 mm would have given rise to a volume error between 0.03 and 0.04 µL in such a well.
In Figure 3A , the mean elevation profile for all 10 measurements along a line of 160 pixels of the detector near the apex of the meniscus is shown. For each pixel, corresponding to a specific radial distance from the apex, the differences between the 10 measured surface elevations at this pixel and their mean were calculated and plotted in Figure 3B . Across these 10 pairs of measurement replicates and radial distances, a standard deviation of 0.20 µm was obtained, and the maximum standard deviation for one pixel was 0.26 µm. Across all 160 pixels and 10 measurements, the maximum and minimum deviations of a single measurement from the mean of all 10 measurements were 0.41 µm and −0.54 µm.
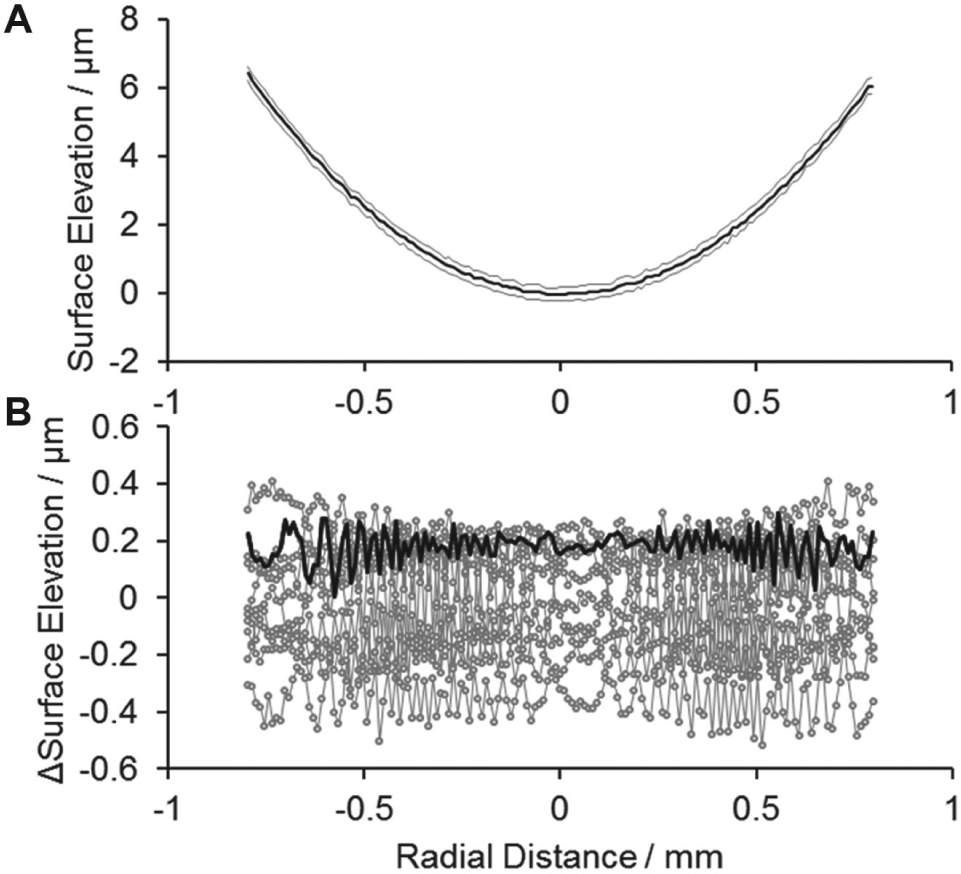
Surface shape measurement. (
When this experiment was repeated, the standard deviation across 10 measurement replicates and radial distances was 0.21 µm, and the maximum standard deviation for one pixel was 0.26 µm. Across all pixels and measurements, the maximum and minimum deviations of a single measurement from the mean of all 10 measurements were 0.59 µm and −0.55 µm.
A fill height difference of 0.2 µm corresponds to ca. 0.007 µL in a typical flat-bottom, round 96-well microplate.
Meniscus Shape
Figure 4 depicts an interference image of the liquid meniscus formed by an aliquot of distilled water in a well of a 96-well flat bottom plate. The concentric elliptical features in the left half of the image are an interference pattern that arises due to the concave shape of the liquid meniscus: just as interference fringes are observed when the interferometric fill height sensor is moved perpendicular to the sample, variations in surface elevation caused by the shape of the meniscus also lead to an interference pattern that follows the contours of the meniscus: on pixels where the relative elevation change from an interference maximum is an integer multiple of the wavelength, another interference maximum will be observed, and where the elevation change is an odd multiple of half a wavelength, an interference minimum is observed. An algorithm measures the fill height using a small number of pixels near the apex of the meniscus and then measures the shape of the meniscus radially from the apex for azimuthal angles spanning 360 degrees. The measurements for each pixel in Cartesian coordinates are interpolated to a cylindrical coordinate system with its center at the apex of the meniscus. Then, a numerical solution of the Laplace-Young equation for each azimuthal angle is fitted to these interpolated experimental data in cylindrical coordinates as described previously. 12 The fit proceeds by minimizing the standard deviation of the residuals between the fit and the experimental data. The residuals of one such fit are depicted in Figure 5C . Note a minimal deviation of less than 0.1 µm between the means of the residuals for these two radial fits (0.1 µm corresponds to a volume error of 0.003 µL in a typical 96-well plate). This deviation is due to the fact that the fill height measurement at the apex uses pixels for all azimuthal angles in the vicinity of the apex. This best-fit solution is then extrapolated to the wall of the well. Figure 5 shows the experimental data and the results of the numerical extrapolation for one such azimuthal cross section through the apex of the meniscus, highlighted as the thin white line in Figure 4 . Note that the apex of the meniscus is not in the center of the well, nor does its shape show symmetry with the well. Experiments show that both the lateral location of the apex of the meniscus within the well and its shape can vary, even with the same liquid in the same well. The same is true for the elevation of the contact line between liquid surface and well wall, as illustrated by the difference in meniscus elevation at both ends of the curve in Figure 5A . The author surmises this may be due to slight variations in the surface properties along the circumference of the well, which lead to differences in wetting as liquid is added to the well and the liquid column climbs. This also implies that the volume of the cap may vary from sample to sample, as is indeed found experimentally and shown in Table 1 , where the volume of the liquid cone, the cap, and the total volume are shown for a number of aliquots of distilled water in a well.
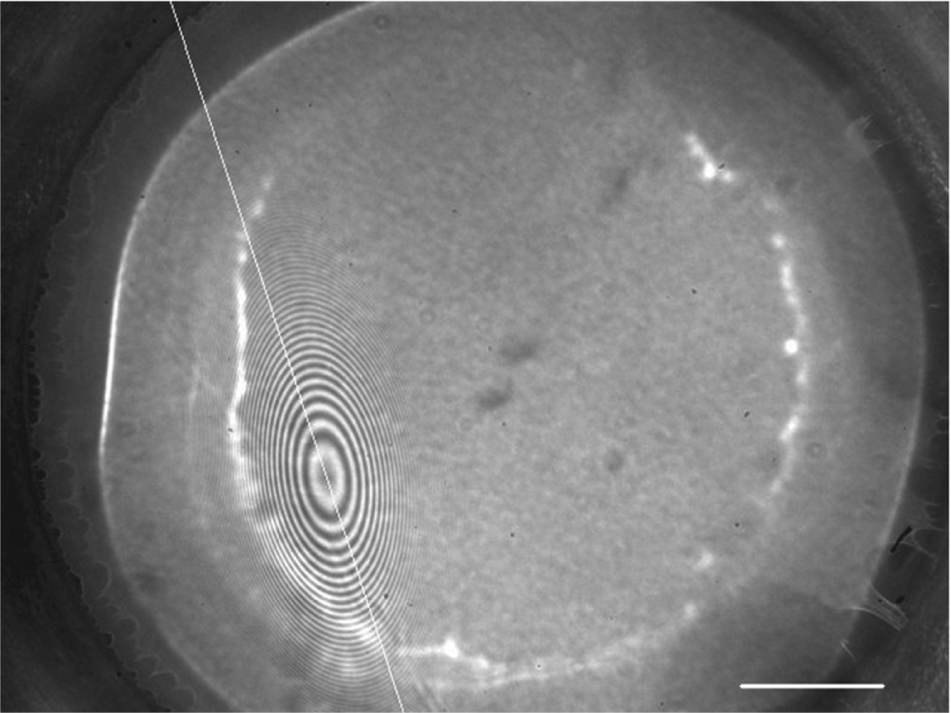
Interference image. Typical interference image of distilled water in a microplate well, obtained near the peak of the interference signal. The concentric elliptical features in the left half of the image are an interference pattern that arises due to the concave shape of the liquid meniscus. For this illustration only, the contrast of the image has been enhanced, and the white line in the image has been added to indicate the line along which the meniscus shape in Figure 5 was obtained. The horizontal white scale bar is 1 mm long.
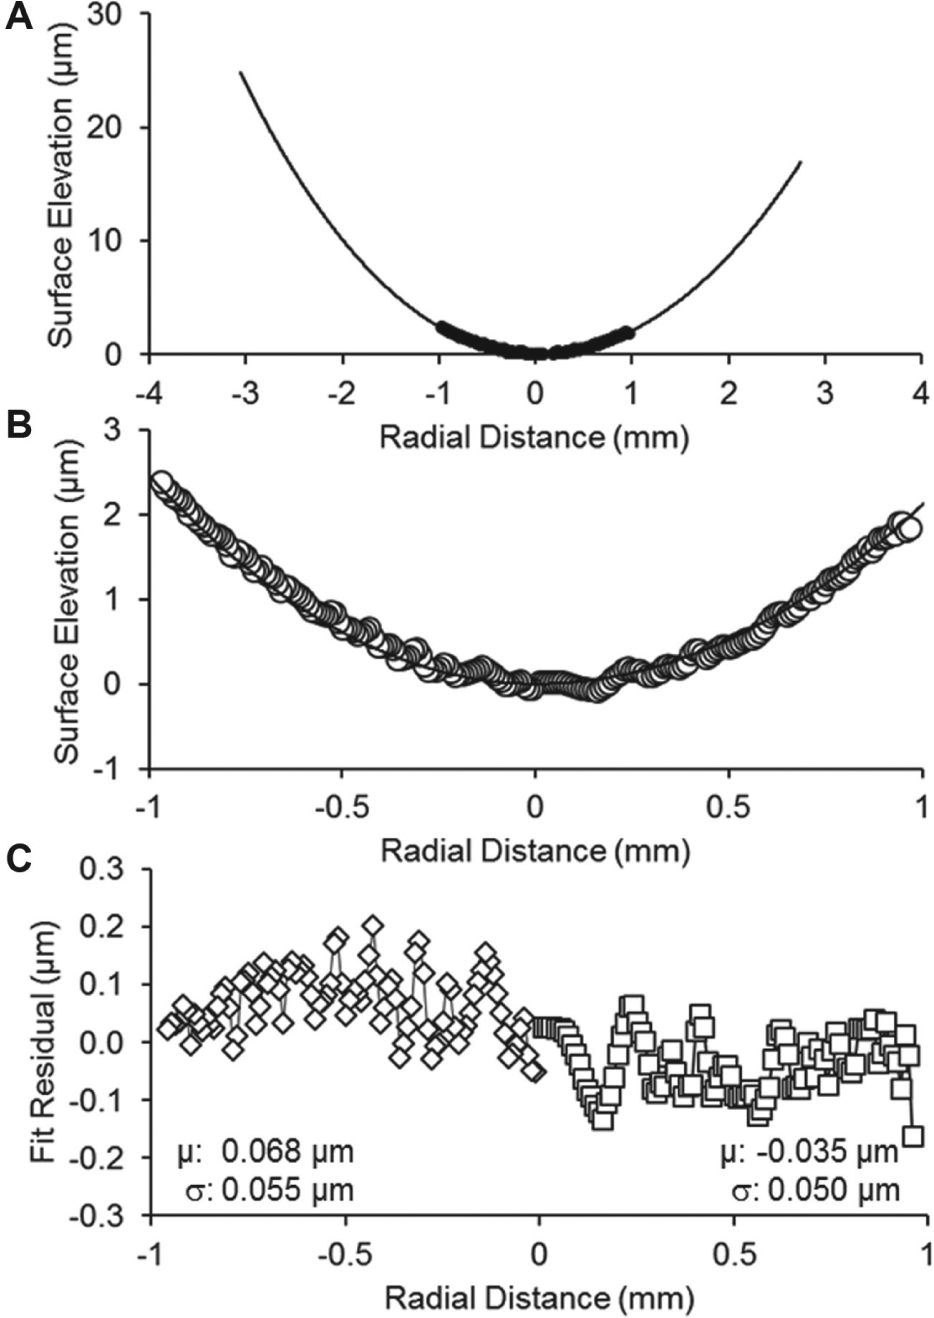
Meniscus shape. (
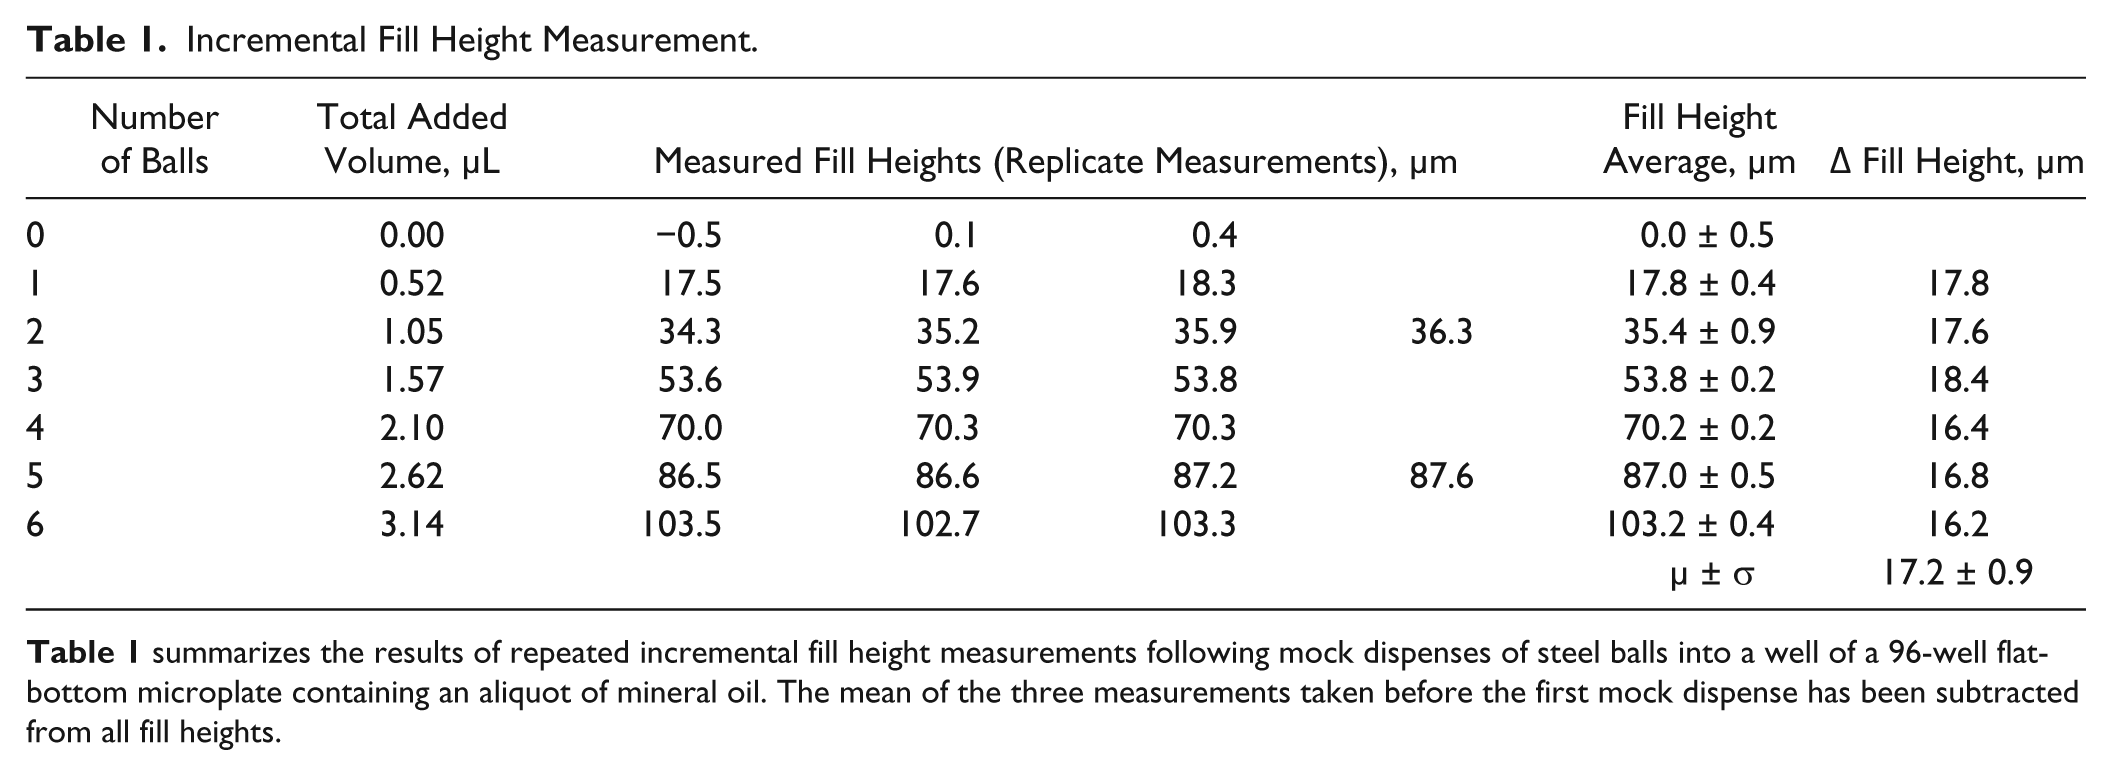
Incremental Fill Height Measurement.
Liquid Fill Height Resolution, Precision
Using a glass lens as a mock meniscus as described above permits the measurement of surface elevation in the absence of effects specific to liquid surfaces: evaporation can reduce liquid sample volume over time, and in the case of liquid mixtures, volatile contents can evaporate preferentially, and this change in liquid composition may also lead to a change in surface shape (let alone to a change in the desired physicochemical properties of the solvent mixture). Similarly, hygroscopic samples may absorb ambient moisture, increasing the sample volume and potentially changing the shape of the meniscus, for example, in the case of samples dissolved in DMSO. Temperature changes in the liquid sample can lead to thermal expansion or contraction, and vibrations can give rise to surface waves on the liquid.
To explore the fill height resolution using liquid samples, the fill height at the apex of the meniscus of a microplate well containing an aliquot of 62.5 µL of mineral oil in a well of a 96-well microplate was measured repeatedly. Mineral oil was chosen as a liquid that forms a repeatable meniscus in polystyrene plates and does not evaporate. In a first experiment, the standard deviation of 10 fill height measurements at the center of the meniscus was 0.67 µm, corresponding to a volume error of 0.022 µL. In a repeat experiment of a separate aliquot of 63 µL, the standard deviation of 10 fill height measurements at the center of the meniscus was 0.62 µm, corresponding to a volume error of 0.020 µL. In both of these measurements, a large proportion of the variance in measured fill heights could be explained by a linear trend in fill heights over the course of the 10 fill height measurements: in the first experiment, a regression of fill height against time yielded a coefficient of determination of 0.96, with a slope corresponding to a surface level rise of 0.0021 µm/s. In the second experiment, a similar regression yielded a coefficient of determination of 0.57 and a slope corresponding to a surface-level drop of −0.0011 µm/s. Given that mineral oil does not evaporate or absorb ambient moisture and that surface waves would not explain a trend over time but rather an increase in the observed measurement error, the author assumes that thermal expansion (in the former case) or contraction of the sample (in the latter case) may be responsible for this change in fill height over time. The volumetric expansion coefficient of mineral oil is 6.3 · 10−4 K−1, 14 and a calculation using the nominal dimensions of the microplate well used here and neglecting the thermal expansion of the microplate itself suggests that an increase in sample temperature of 1.6 °C over the course of 20 min would account for this trend in the first experiment, and a decrease in sample temperature of 1.1 °C would account for the observed trend in the second experiment. These temperature variations are in line with typical temperature fluctuations in the laboratory. For comparison, a regression for the measurements of the apex surface elevation of the concave lens discussed above gave a coefficient of determination of only 0.001 and a slope of 0.00002 µm/s. The N-BK7 glass of the lens used has a volumetric expansion coefficient of 7.1 · 10−6 K–1, 15 two orders of magnitude smaller than that of mineral oil. This explains the smaller standard deviation and the absence of a significant trend in the data, even though the experiment was carried out in the same, poorly temperature-controlled environment.
The volumetric expansion coefficients of common laboratory solvents at 20 °C range from 2.07 · 10−4 K−1 for water to 1.49 · 10−3 K−1 for methanol. An exploratory analysis neglecting the expansion of the plate itself shows that for each 1 °C rise in temperature, the surface of a 50-µL aliquot in a well of a typical 96-well flat bottom plate would rise by 0.3 µm for water and 2.3 µm for methanol, contributing a relative volume error of 0.02% for water and 0.14% for methanol.
In a separate experiment to illustrate the resolution potential of interferometric volume measurement, several 1-mm diameter stainless steel bearing balls selected at random from a purchased sample quantity were dropped into a well of a 96-well flat-bottom plate containing an aliquot of mineral oil as mock dispenses of small, well-defined volumes. These bearing balls have a volume of (0.524 ± 0.004) µL. The apex height of the meniscus was determined in three or four measurements before the first and after each subsequent mock dispense, and the results are summarized in Table 1 . The standard deviations of each group of surface elevation measurements were between 0.2 µm and 0.9 µm. The average rise in surface elevation at the apex of the meniscus for all six mock dispenses was 17.2 µm, with a standard deviation of 0.9 µm. A standard deviation of 0.9 µm corresponds to a volume error of 0.03 µL in a typical 96-well plate. A calculation using nominal well dimensions and assuming a flat meniscus shows that the standard deviation in surface level rises for these six small-volume mock dispenses that arises due to the conical shape of the well should be less than 0.01 µm, far less than the observed value.
Gravimetric Verification
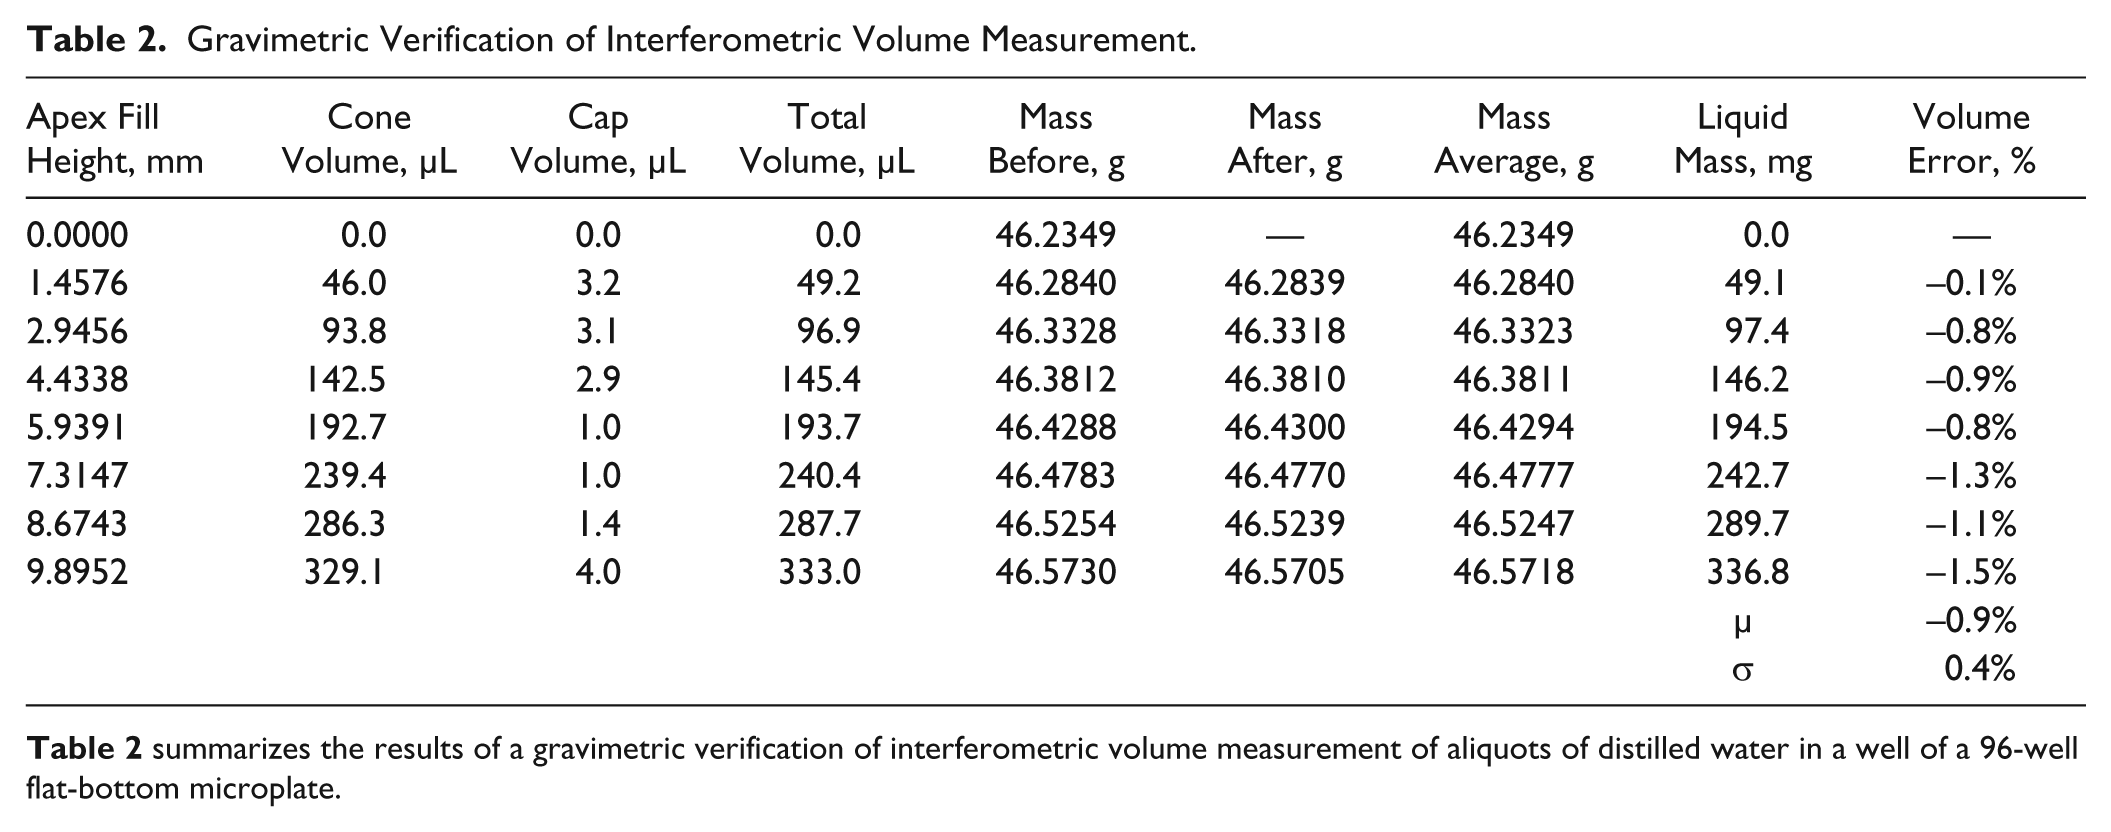
To verify the accuracy of the interferometric volume measurement, aliquots of distilled water (nominally 50 µL) were added sequentially to the plate with a handheld pipettor. The plate was weighed empty, and the elevation of the well bottom was measured. Then, an aliquot of water was added, the plate was weighed, the liquid volume was measured interferometrically, and the plate was reweighed. This process was repeated for seven aliquots, and the experimental data are shown in Table 2 . In Figure 6 , the interferometrically measured volume of the liquid in µL is plotted against the mass of the liquid in mg, and excellent linearity is obtained. The slope of a linear regression was found to be (0.989 ± 0.002) µL/mg. Its reciprocal is the experimentally obtained density of water, 1.011 mg/µL. This value is 1.4% larger than the reference value of 0.996 mg/µL, which is interpolated from tabulated values at 20 °C and 30 °C to the average laboratory temperature of 26.9 °C during the experiment. 16 As an alternative assessment of the accuracy of interferometric volume measurement, the volume error of each liquid sample was calculated as the relative difference between the interferometrically measured volume and the ratio of sample mass and density. The values are shown in the last column of Table 2 . The standard deviation of relative volume errors was 0.4%, and the mean relative volume error was −0.9%.
Gravimetric Verification of Interferometric Volume Measurement.
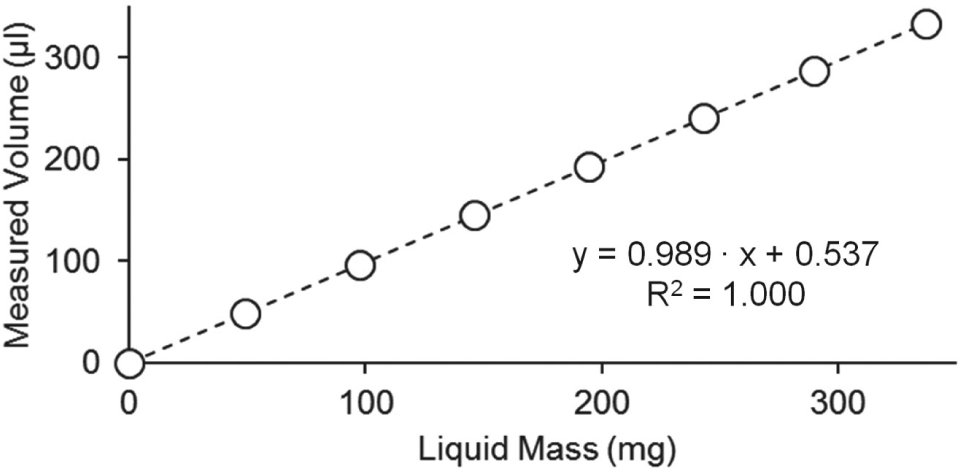
Gravimetric verification of interferometric volume measurement. The figure depicts a scatter plot of liquid mass versus interferometrically measured liquid volume for incremental additions of aliquots of distilled water to a well of a 96-well flat-bottom plate.
This experiment was repeated with four aliquots between nominally 50 µL and 200 µL (data not shown). The slope of this regression line was (1.001 ± 0.003) µL/mg. Its reciprocal, the experimentally obtained density of water, was 0.999 mg/µL. This value is 0.4% larger than the reference value of 0.997 mg/µL, which is interpolated from tabulated values at 20 °C and 30 °C to the average laboratory temperature of 24.6 °C during this experiment. In this experiment, the standard deviation of relative volume errors calculated as described above was 0.7%, and the mean relative volume error was −0.6%. These initial data suggest a volume inaccuracy of less than 2% for interferometric volume measurement.
Nonflat Bottom Plates
Initial results show that the detection of liquid aliquots in V-bottom plates using the interferometric fill height sensor is possible (data not shown). For relatively small aliquots of ca. 10 µL of distilled water that form a droplet with a near-spherical upper surface in the bottom of the well, an interference signal has been obtained from the area near the top of the droplet that is within the acceptance angle of the sensor. Slightly larger aliquots of ca. 50 µL do not completely fill the “V”-portion of the well but rather adhere irregularly partially to the “V”-portion of the well and partially to the near-vertical, upper portion of the well wall. In these cases, a signal has been obtained from a portion of the droplet near the vertical wall. This suggests that interferometric fill height sensors can provide information on sample volumes in these plates, albeit at likely much lower volume resolution.
Discussion
Using interferometric volume measurement, high-resolution fill height information was obtained even from liquids with strongly curved menisci, such as mineral oil, as well as more common liquids such as distilled water. Because the instrument uses light reflected at the liquid surface, it can accommodate opaque or scattering samples, such as cell or bead suspensions.
Initial experiments using gravimetric verification suggest an inaccuracy of less than 2%, comparing favorably with other nondestructive methods such as ultrasonic ranging or well pressurization.
A surface elevation resolution of 0.2 µm has been demonstrated on a glass lens as a mock meniscus. In a liquid model system using mineral oil, a fill height resolution of <0.7 µm has been demonstrated. Theoretically, this corresponds to a volume resolution of 0.02 µL in a typical 96-well plate. In a near-ideal system of mock dispenses of steel bearing balls into mineral oil, an incremental fill height resolution of 0.9 µm has been demonstrated. In this system, the combination of liquid and plate material ensures that the liquid forms a very repeatable meniscus in the well. Following every mock dispense, the apex of the meniscus remains in a near-constant spot near the center of the well, and the shape of the meniscus does not vary much. The data on distilled water show that for a more typical liquid/plate material pair, both the lateral position of the meniscus as well as its shape vary substantially.
For practical purposes, the accuracy and precision of volume measurement are determined by the tolerances of plate dimensions and by external factors directly affecting the liquid volume. Ratiometric photometry, the other high-resolution volume measurement scheme, therefore, uses precharacterized plates. 9 Characterizing plates separately could also be combined with interferometry. Absent the separate characterization of well geometry, plate manufacturing tolerances place a lower boundary on the accuracy achievable with any fill height–based volume measurement system. Other external factors affecting liquid fill height and volume include sample evaporation, water absorption by hygroscopic samples, changes in meniscus shape due to changes in the sample composition from either evaporation or absorption, and thermal expansion or contraction.
Compared to ultrasonic ranging, the only other noncontact, nondestructive volume measurement method, it is expected that the substantially better fill height resolution offered by interferometry (0.7 µm, corresponding to a volume resolution of 0.02 µL in a typical 96-well microplate) should lead to practical advantages in daily laboratory use over ultrasonic sensors (200–300 µm, corresponding to a volume resolution of 7–10 µL in a typical 96-well microplate). Furthermore, optical interferometry is not subject to the same limitations of measuring volumes in small wells or in situations with strongly curved menisci, where diffraction prevents ultrasonic ranging.
In summary, the data presented in this article show that interferometric volume measurement has the potential to fill the need for a high-resolution, nondestructive, and noncontact sample volume measurement technology.
Footnotes
Acknowledgements
H.-C.L. would like to thank Rita Vicaire of the Robot Whisperer for bringing to his attention the need for and advising on the development of a volume measurement method applicable to all liquids.
Declaration of Conflicting Interests
The author declared no potential conflicts of interest with respect to the research, authorship, and/or publication of this article.
Funding
The author received no financial support for the research, authorship, and/or publication of this article.