
Abstract
When acoustic droplet ejection technology was first introduced for high-throughput applications, it was used primarily for dispensing compounds dissolved in DMSO. The high precision and accuracy achieved for low-volume transfers in this application were noted by those working outside of the compound management area, and interest was generated in expanding the scope of the technology to include other liquid types. Later-generation instruments included calibrations for several aqueous buffers that were applicable to the life sciences. The High Throughput Screening Center at Southern Research has made use of this range of liquid calibrations for the Infectious Disease Program. The original calibration for DMSO has allowed the preparation of assay-ready plates that can be sent to remote locations. This process was used as part of the collaboration between Southern Research and Galveston National Laboratory, University of Texas Medical Branch, to develop high-throughput screening for biological safety level 4 containment and to provide compounds for two pilot screens that were run there with BSL-4-level pathogens. The aqueous calibrations have been instrumental in miniaturizing assays used for infectious disease, such as qPCR, tissue culture infectious dose 50, and bacterial motility, to make them compatible with HTS operations.
Introduction
High-throughput screening (HTS) is a process of profiling large numbers of diverse chemical structures to identify lead scaffolds as the starting point for drug discovery. The development of acoustic droplet ejection (ADE) for the transfer of these compounds into assay plates for HTS has improved the accuracy of low-volume transfers, allowing miniaturization to the 1536-well format to become routine.1–3 It further allows the preparation of assay-ready plates (ARPs), which decouples compound management activities from the screening process.4,5 These steps—accurate transfers of nanoliter volumes, miniaturization of screening assays, and separation (in both time and location) of compound preparation from screen execution—all improve the efficiency and flexibility of HTS operations. As an example, the simple process of producing ARPs has enabled synergistic collaborations between sites with different and complementary capabilities in order to move HTS capability into the biological safety level 4 (BSL-4) containment environment. When transfer of aqueous solutions became possible on ADE devices, the ability to transfer small volumes accurately could be applied to biological reagents in physiologically compatible buffers.6,7 This allowed the miniaturization of assays requiring low-volume aqueous transfers and created opportunities for innovative applications of low-volume transfers with biological reagents. The use of ADE technology to transfer biological reagents in aqueous buffers, including in some cases the pathogens themselves, for infectious disease screening has enabled a number of novel applications. These include qPCR virus particle quantitation, tissue culture infectious dose 50 (TCID50) determination of viral titer, bacterial motility, and antimicrobial compound screening.
Materials and Methods
Motility
Assay plate preparation
Compounds were dispensed to the assay plates (black, clear-bottom, tissue culture–treated polystyrene 384-well microtiter plates [Corning 3712; Corning, NY]) using ADE technology. One hundred nanoliters of compound (10 mM in 100% DMSO; Sigma-Aldrich, St. Louis, MO) was dispensed to assay plates using an Echo 555 (Labcyte, Sunnyvale, CA). The Echo was also used to dispense DMSO (Sigma-Aldrich), tetracycline (Sigma-Aldrich) (5 µg/mL final concentration), and phenamil (Sigma-Aldrich) (100 µM final concentration) to the various control wells of the plate. The final DMSO concentration was held constant at 1% for all wells. On the day of the assay, LB media (Difco, Detroit, MI) containing 0.3% agar (Difco) was prepared, autoclaved, and cooled to 40 °C. A Wellmate (Thermo Scientific, Waltham, MA) peristaltic-based dispenser was used to add 50 µL of the agar-containing media to the assay plates containing the compounds. Agar was maintained at 40 °C for the duration of the plating process to prevent solidification during the dispense process. Plates were allowed to cool and solidify at room temperature for several hours before inoculation.
Assay plate inoculation
Vibrio cholerae stocks (strain C7258 was kindly provided by Jorge Benitez) were diluted in phosphate-buffered saline (PBS) (Sigma-Aldrich) to a concentration of 5 bacteria/nL (5 × 10⁶/mL), and 30 µL of this dilution was dispensed to an Echo-compatible 384-well polypropylene plate (Labcyte). Assay plates were inoculated with a plate-to-plate transfer on the Echo 555 using the buffer calibration. The plate definition for the bacterial inoculation was modified to deliver two 2.5 nL drops to the top left corner of the well ( Fig. 1 ), rather than to the center of the well, which is standard format. Plates were inverted, and then incubated at 30 °C in a humidified incubator without CO2 for 14 h.

The technique used to miniaturize a bacterial motility assay to the 384-well format. The Echo 555 was used to dispense 5 nL of bacterial culture, containing ~25 bacteria, in the top left corner of the well depicted by the blue dot (). This was accomplished by creating a new plate definition with a nonstandard offset for the Echo 555. On the EnVision multimode plate reader, the read location indicated by the crosshairs was established using the plate dimension optimization tool in the EnVision software. Normally, the alignment tool is used to ensure that the read location is in the center of the well. In this case, it was used to locate the read position in the bottom right of the well in order to maximize the distance between the inoculation site and the read location in order to monitor bacterial motility.
Endpoint read
Each assay plate was read twice, first by absorbance at 615 nm on an EnVision multimode plate reader (PerkinElmer, Waltham, MA) to evaluate motility and again after treatment with alamarBlue (TREK Diagnostic Systems, Oakwood Village, OH) to evaluate bacterial viability. For the OD 615 motility read, the position of the read in the well was offset to the bottom right in order to maximize the distance between the inoculation site and the read position ( Fig. 1 ). Because nonmotile and nonviable bacteria would produce the same readout from the absorbance read at 615 nm, a bacterial viability endpoint was added to the assay. Following the absorbance read, 5 µL of alamarBlue was added to the assay plates with a Combi (Thermo Scientific). Plates were incubated at 30 °C, high humidity, and no CO2 for approximately 60 min. The viability endpoint was read using a conventional well center location to read fluorescence intensity with an excitation of 535 nm and an emission of 595 nm.
TCID50
TCID50 is a limiting dilution strategy to determine virus titer. Madin-Darby canine kidney (MDCK) cells at 200,000 cells/mL in assay media (OptiPro SFM; Gibco-Life Technologies, Grand Island, NY), 1 µg/mL TPCK-treated trypsin (Affymetrix, Santa Clara, CA), 0.5% bovine serum albumin (BSA) (Bovine Serum Albumin—Fraction V; Sigma-Aldrich), and 1% pen/strep (Gibco-Life Technologies) were dispensed to Corning 3712 microtiter plates in 25 µL. An influenza virus containing the NanoLuc reporter gene (Promega, Madison, WI) (virus construct was kindly provided by Andy Mehle) was transferred to the Echo source plate. One well contained undiluted virus and one well contained virus diluted to 1 × 10⁻³. Twenty wells at each dilution were dispensed at three volumes, 2.5, 25, and 250 nL, allowing the determination of the virus titer across the range of dilutions from 10−2 to 10−7. The plate format is shown in Figure 2A . Following inoculation with virus, plates are incubated for 3 days at 37 °C, 5% CO2, and high humidity.
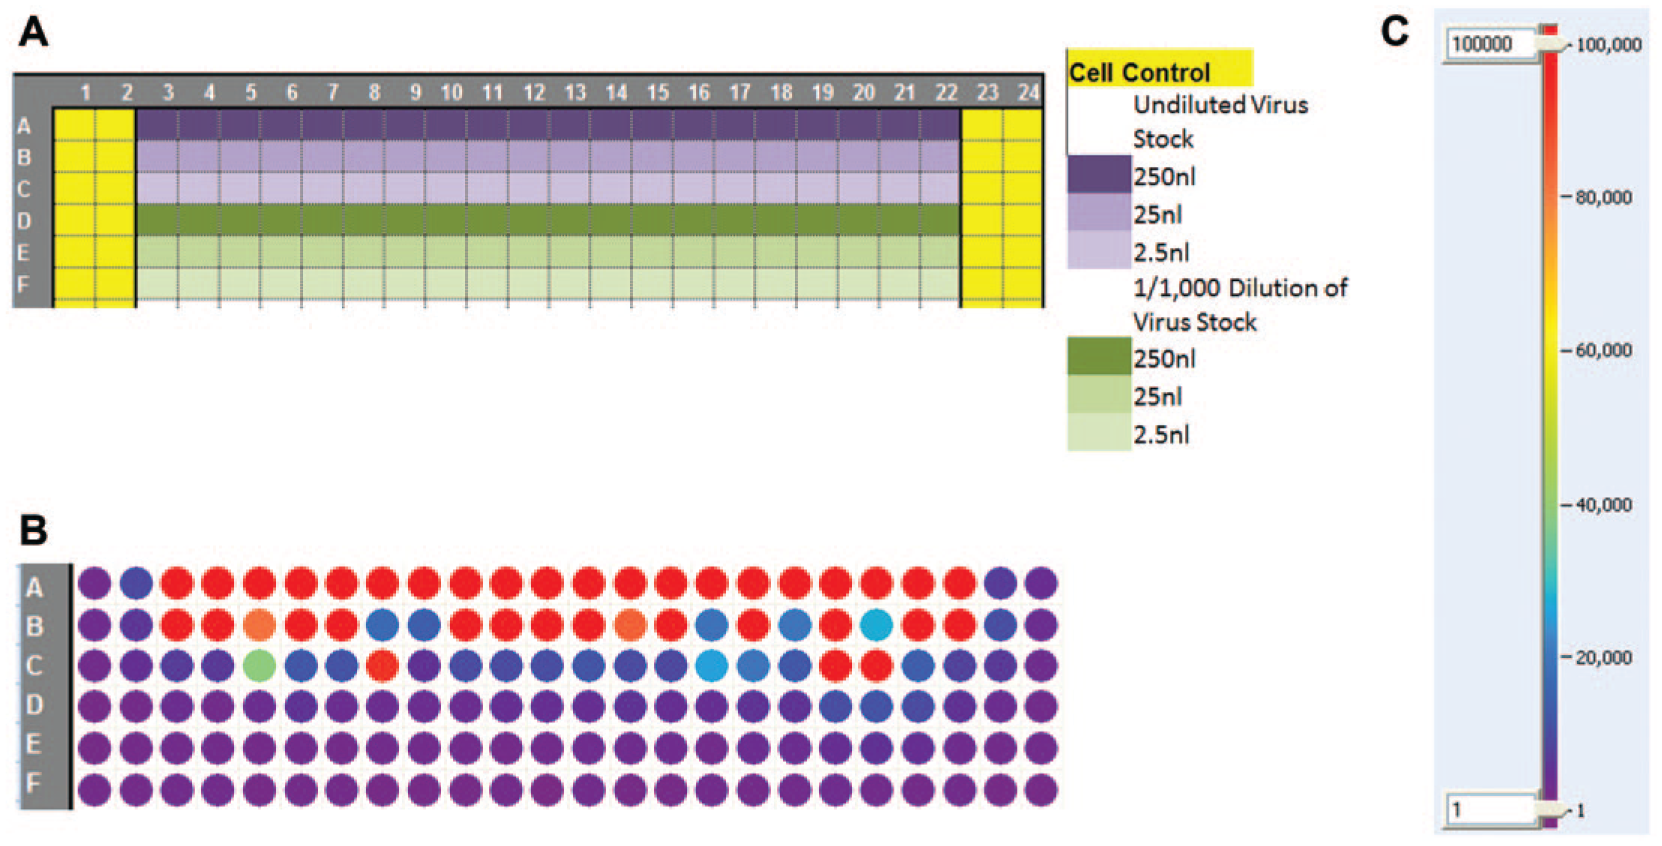
Plate format and heat map for TCID50 assay. (
Endpoint read
Virus replication of the influenza-NanoLuc virus was quantitated with Nano-Glo as per the manufacturer’s instructions (Promega). Wells were scored as either virus positive (greater than 40,000 light units) or virus negative (less than 40,000 light units). A heat map is shown in Figure 2B . The TCID50 is determined by plotting the number of positive wells versus the dilution of virus, as illustrated in Figure 3 . The dilution at which 50% of the wells are calculated to be positive is the TCID50 value.
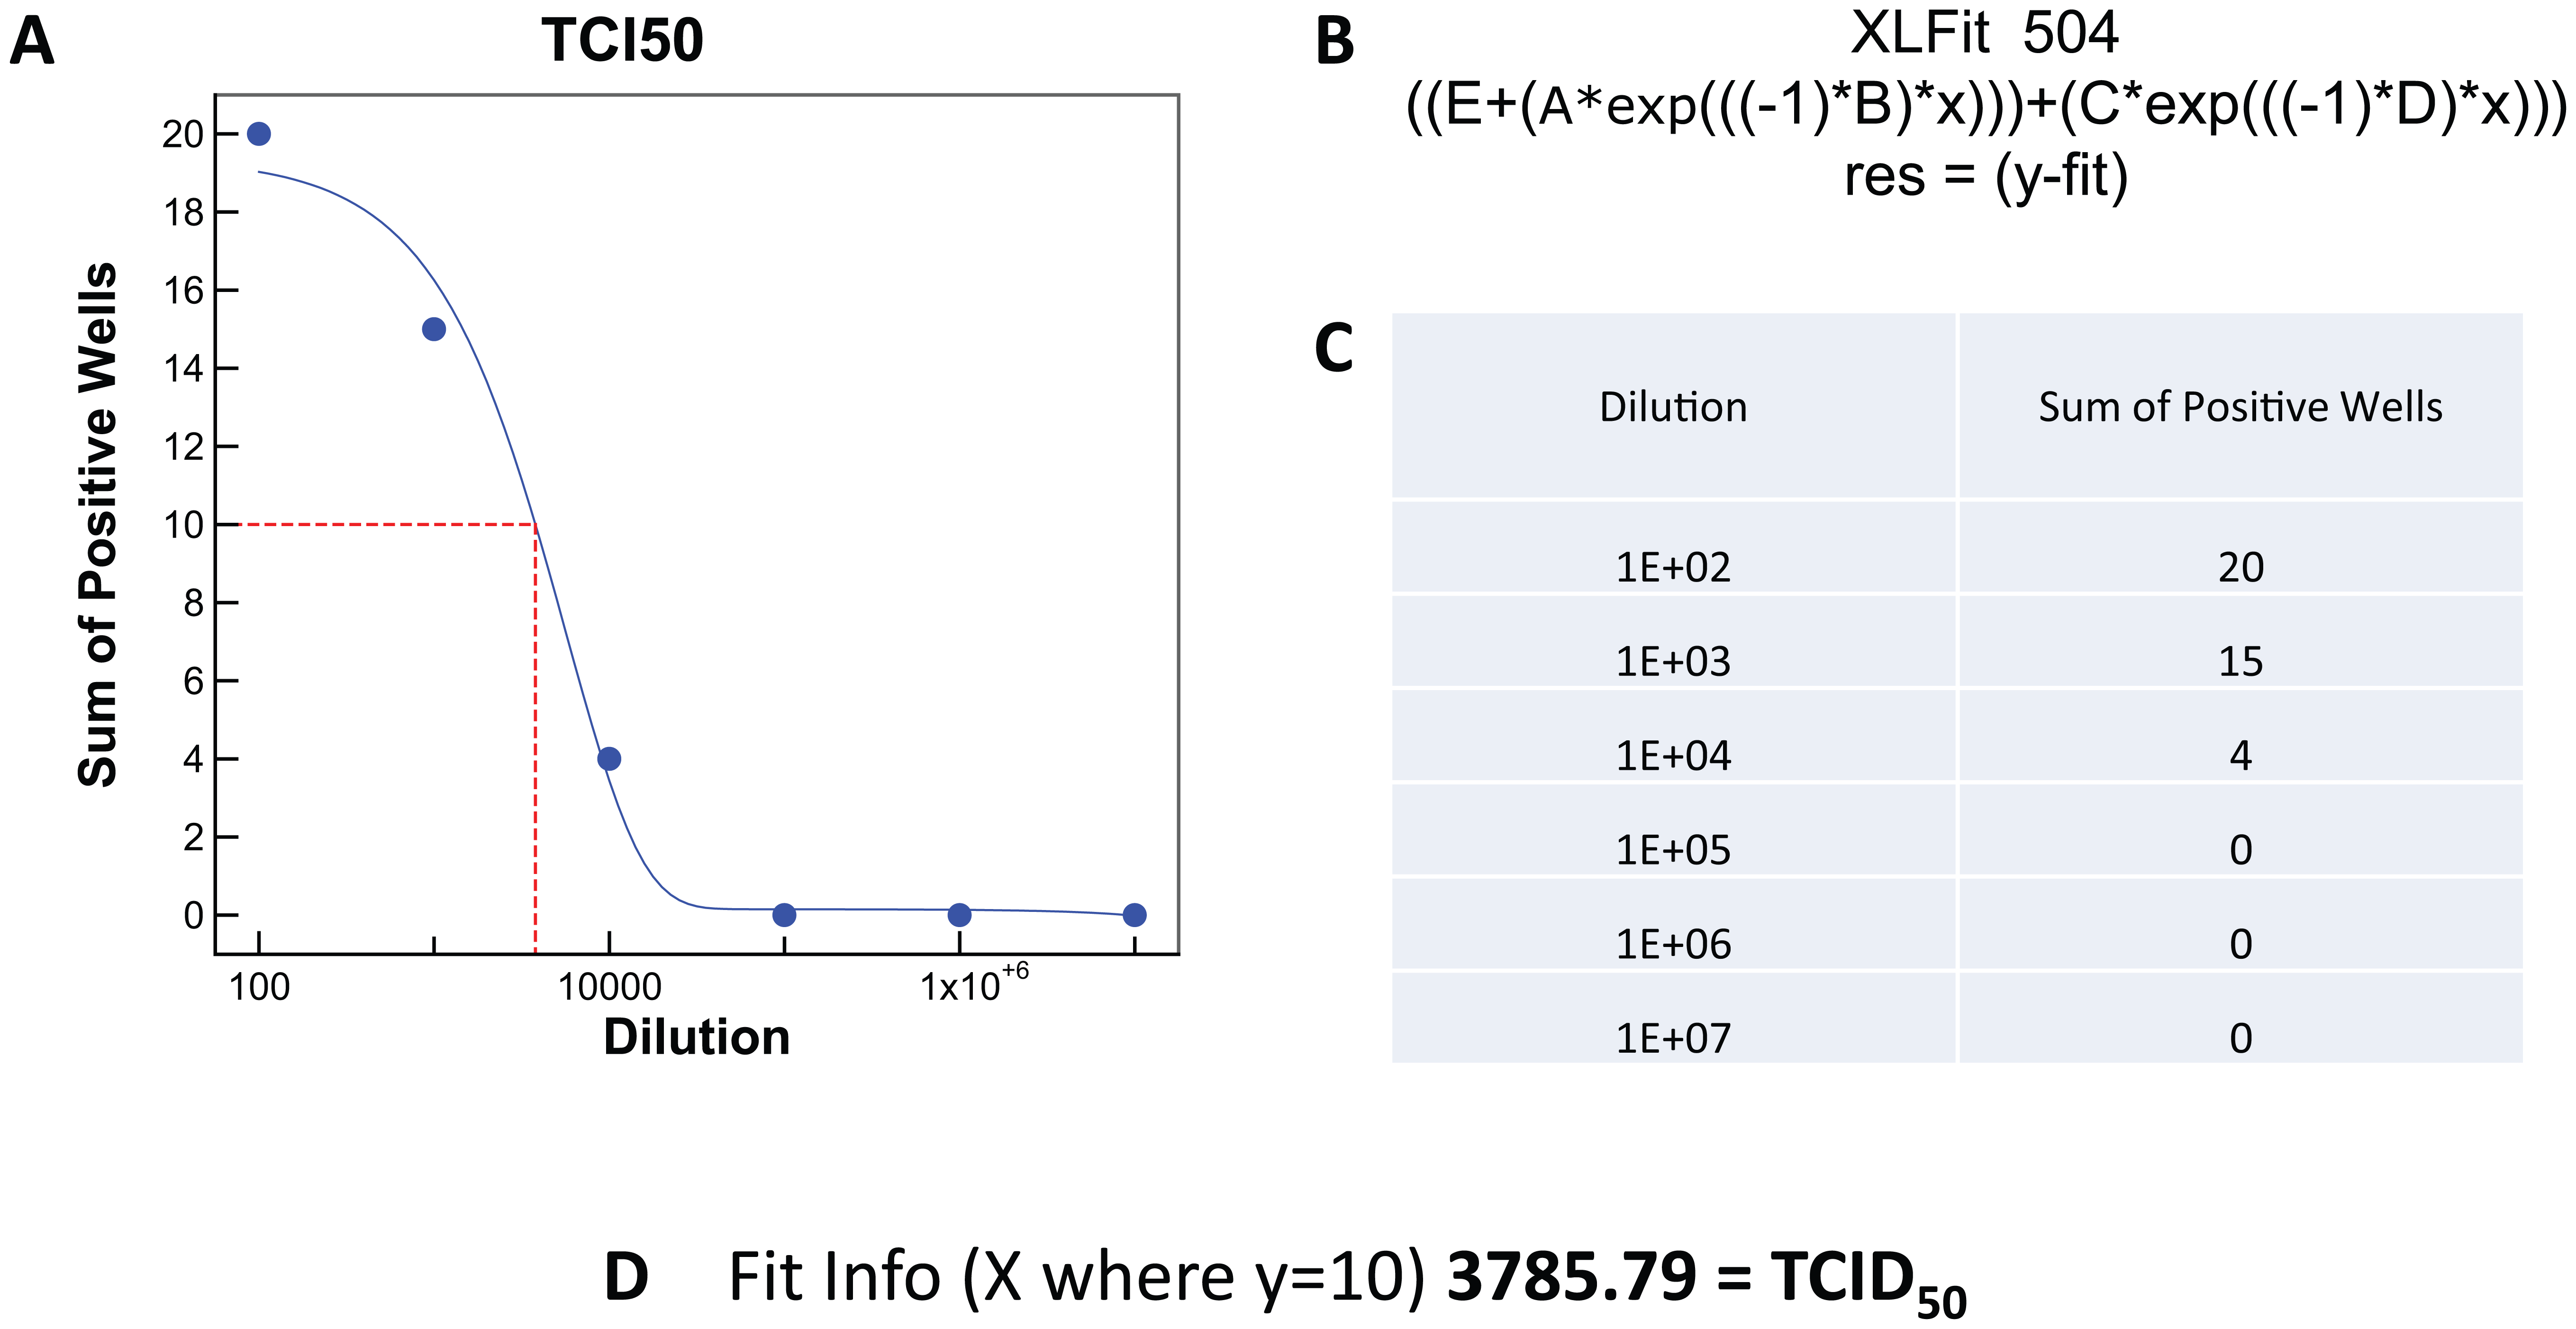
Automated analysis of TCID50 determinations. Data generated in the TCID50 assay described in
Figure 2
was analyzed using Xlfit. Dilution and number of positive wells are shown in the table (
qPCR
For quantitation of virus particles by qPCR, a primer and probe set to the M gene of influenza A was used with the H3N2 A/Udorn/72 strain of influenza virus (kindly provided by James Noah). Primers and probe sequences used 5′-AGATGAGTCTTCTAACCGAGGTCG-3′, 5′-TCGAGATCGGTGTTCTTTCC-3′, and probe (6FAM–TCAGGCCCCCTCAAAGCCGA–MGBNFQ). RNA Virus Master (Roche, Basel, Switzerland) and a LightCycler 1536 (Roche) were used for the qPCR. A PCR master mix was prepared by mixing a 20% final volume PCR buffer, 2% enzyme blend, amplification primers at 420 nM each, a hydrolysis probe at 1 µM, and water to bring the volume up to 95% final volume. The master mix (950 nL) was dispensed to the wells of the LightCycler 1536 PCR plate (Roche) with a BioRAPTR (Beckman Coulter, Fullerton, CA). Fifty nanoliters (5% of the final volume) of virus-containing supernatant was added to the PCR plate with an Echo 555. Plates were then sealed and centrifuged, and qPCR was performed. The amplification method for the one-step qPCR was reverse transcription at 50 °C for 30 min, Taq activation at 95 °C for 1 min, and amplification at 95 °C for 0 s and 60 °C for 30 s, for 45 cycles.
Assay-Ready Plates
ARPs were prepared at Southern Research by dispensing compound dissolved in DMSO directly into the plate that was to be used for the assay (Corning 3712). Thirty nanoliters of compound stock at 10 mM was dispensed to the assay plate using an Echo 555. Plates were sealed and frozen at −65 °C. Plates were then packed on dry ice and shipped to Galveston National Laboratory to conduct the assays in the BSL-4 containment laboratory.
At Galveston National Laboratory, the plates were stored frozen at or below −65 °C until needed for the assay. In a BSL-2 laboratory, plates were thawed and centrifuged prior to removal of the seals. Unsealed ARPs were transported into the BSL-4 for addition of cells and virus. Details of the process have been reported. 8 Briefly, cell controls were dispensed using line 1 of a Wellmate cassette head, which dispensed to rows A and B. Cells and virus were mixed together and dispensed using lines 2–8 to the remainder of the plate. After addition of cells and virus, plates were incubated for 3 days at 37 °C, 5% CO2, and high humidity. For the Nipah cytopathic effect (CPE)–based assay, Vero cells (ATCC CCL-81; American Type Culture Collection, Manassas, VA) were used. Cell Titer-Glo (CTG) (Promega) was used to measure cell viability as an indirect measure of virus replication. The Ebola virus used for a second pilot contained the Green Fluorescent Protein (GFP) gene as a reporter. The same assay strategy was used for the Ebola assay; only Vero E6 cells (ATCC CRL-1586) were used with the Ebola-GFP virus. Virus replication was monitored by the expression of the GFP reporter gene, and then cell viability was measured with CTG to identify toxic compounds.
Results and Discussion
The HTS Center at Southern Research has been involved with infectious disease drug discovery for more than a decade. In that time, more than 9 million compounds have been screened against 36 infectious agents, at both the BSL-2 and the BSL-3 level.9–17 Many assays were adapted to the automation platform and screened successfully. But there were assays that could only achieve semi-high throughput due to the technical limitations of conventional liquid handling. ADE technology was used to address those limitations and allowed the screens presented here to be run successfully. A process as simple as preparation of ARPs was used to facilitate collaboration between Southern Research (which had the compound libraries, the Echo liquid handlers, and the IT infrastructure to process the data) and the University Texas Medical Branch (which had the BSL-4 facilities, technical expertise, and virus stocks) for screening in the BSL-4 containment laboratory. The use of aqueous transfer capabilities to miniaturize qPCR to the 1536-well format is of value in making qPCR cost and throughput compatible with HTS processes. But of greater interest is the use of aqueous transfer capability to transfer bacteria and viruses in order to automate and miniaturize assays that have historically been done manually or in a low-throughput format. Transfer of infectious agents brings up some obvious questions concerning safety and generation of aerosols. According to the manufacturer, ADE transfer, as engineered in the Echo liquid handlers, is designed to not produce aerosols (personal communication). To empirically test for aerosol generation, the very sensitive technique of qPCR was used. An Echo 555 was used to transfer template into qPCR plates in a pattern that leaves no-template wells adjacent to the well into which template was added. None of the no-template wells of a 1536 qPCR plate produced a positive result. 18 qPCR was also used in a genotyping laboratory to evaluate potential cross-contamination by use of ADE to transfer the template. None was observed. 19 These results indicate that little or no aerosol was created during the ADE transfer. As an extra level of safety, the Echo liquid handlers are housed in BIOPROtect II biosafety cabinets (Baker, Sanford, ME). The original purpose was to ensure sterility of the assay plates during compound addition, but they also serve to contain any aerosol that may be generated during the transfer of infectious agents.
Bacterial Motility
One of the assays, with throughput limitations that was addressed with aqueous ADE technology, was a bacterial motility assay. Recent strategies for the development of antibiotics are to target virulence factors that affect pathogenicity without affecting the viability of the bacteria. The concept is that by targeting nonlethal virulence targets, the development of drug-resistant strains will be mitigated. 20 Motility is such a virulence factor for cholera,21,22 but there were no HTS-amenable assays available for a screening campaign. As early as 2007, the manual assay that had historically been done in 100 mm dishes or low-density multiwell plates, such as 6- or 24-well plates, and inoculated manually was adapted to the 96-well format and a small library of 960 compounds was run as proof of principle. 23 In 2010, bacteriologists at Southern Research proposed screening up to 200,000 compounds in a motility assay using Vibrio cholera. While it could be done in the 96-well format, the cost and time required could both be reduced if the assay could be further miniaturized to the 384-well format. The key technical hurdles were reducing the size of the inoculation site, delivering the same number of bacteria to each well, and having enough distance between the inoculation site and the read location to differentiate between motile and nonmotile bacteria. Inoculation size and consistency were addressed with ADE technology by using an Echo 555 to transfer the inoculum to assay plates containing soft agar and library compounds. Two 2.5 nL drops containing ~25 bacteria were used to inoculate the wells. Literature references indicated that the accuracy of droplet placement would be of sufficient precision for this purpose,6,24 although there are others that indicate that droplet placement accuracy is poor. Since accuracy of the inoculation was critical to the success of this protocol, a nonmotile strain of cholera was inoculated using the Echo 555 and incubated for 14 h. A visual inspection of the coefficient of variation (CV) plate confirmed that the colonies were in fact in the top left corner of all of the wells. Plates were read on the EnVision using the well offset read location, and values consistent with agar-only wells were observed (data not shown), indicating that the precision of the placement was sufficiently accurate for this application. To observe inhibition of motility, the travel distance was maximized by inoculating the soft agar in the corner of the well and reading turbidity in the diagonal corner, which is illustrated in Figure 1 . This provided a path length of about 3 mm for the motile bacteria, which was sufficient to identify compounds that inhibited motility by 50% or more. While the technical challenges of miniaturizing this assay were addressed with the use of ADE technology, one further challenge needed to be addressed. Dead bacteria and nonmotile bacteria look identical in the assay described above. To differentiate between the two, a second step was introduced. Following the absorbance read at 615 nm, alamarBlue was added to the plates to assess bacterial viability. This step allowed the identification of two groups of active compounds: those that inhibited motility but did not affect viability and those that had no effect on motility but were simply antimicrobial. Both types of compounds have value in drug discovery. Following the development and validation of this assay, a pilot screen of 10,000 compounds was conducted in duplicate as proof of principle that the assay was able to identify motility inhibitors and antimicrobial compounds. The motility screen and inhibitors identified in the pilot screen, which were characterized in additional assays, have been reported. 25 Following the successful pilot screen, 150,000 compounds were screened using this assay. Figure 4 compares the heat map from the motility read (ABS 615 nm) with the heat map from the alamarBlue viability read. This shows that both antimicrobial compounds, which are tetracycline-like (well O19), and antimotility compounds, which are phenamil-like (well K04), can be identified by the screen. Z′ values 26 were based on the bacterial cell control in columns 1 and 2 and the tetracycline control in A23-L24 for both the motility screen (ABS 615 nm), which averaged 0.8 ± 0.1, and the alamarBlue viability read, which averaged 0.8 ± 0.1. Phenamil was also included as a motility inhibitor in wells M23-P24. Historically, the performance of phenamil was highly variable, as can be seen in Figure 5 , and it was not used to calculate screening statistics. Campaign historical controls for both motility and toxicity are shown in Figure 5 . From the single-dose screen, 638 compounds were identified as having either antimotility or antimicrobial activity based on a 50% inhibition cutoff. These were further evaluated in dose response in the motility assay and for toxicity testing in THP-1 eukaryotic cells. Of these, 78 compounds were identified as motility inhibitors with little or no cellular toxicity.
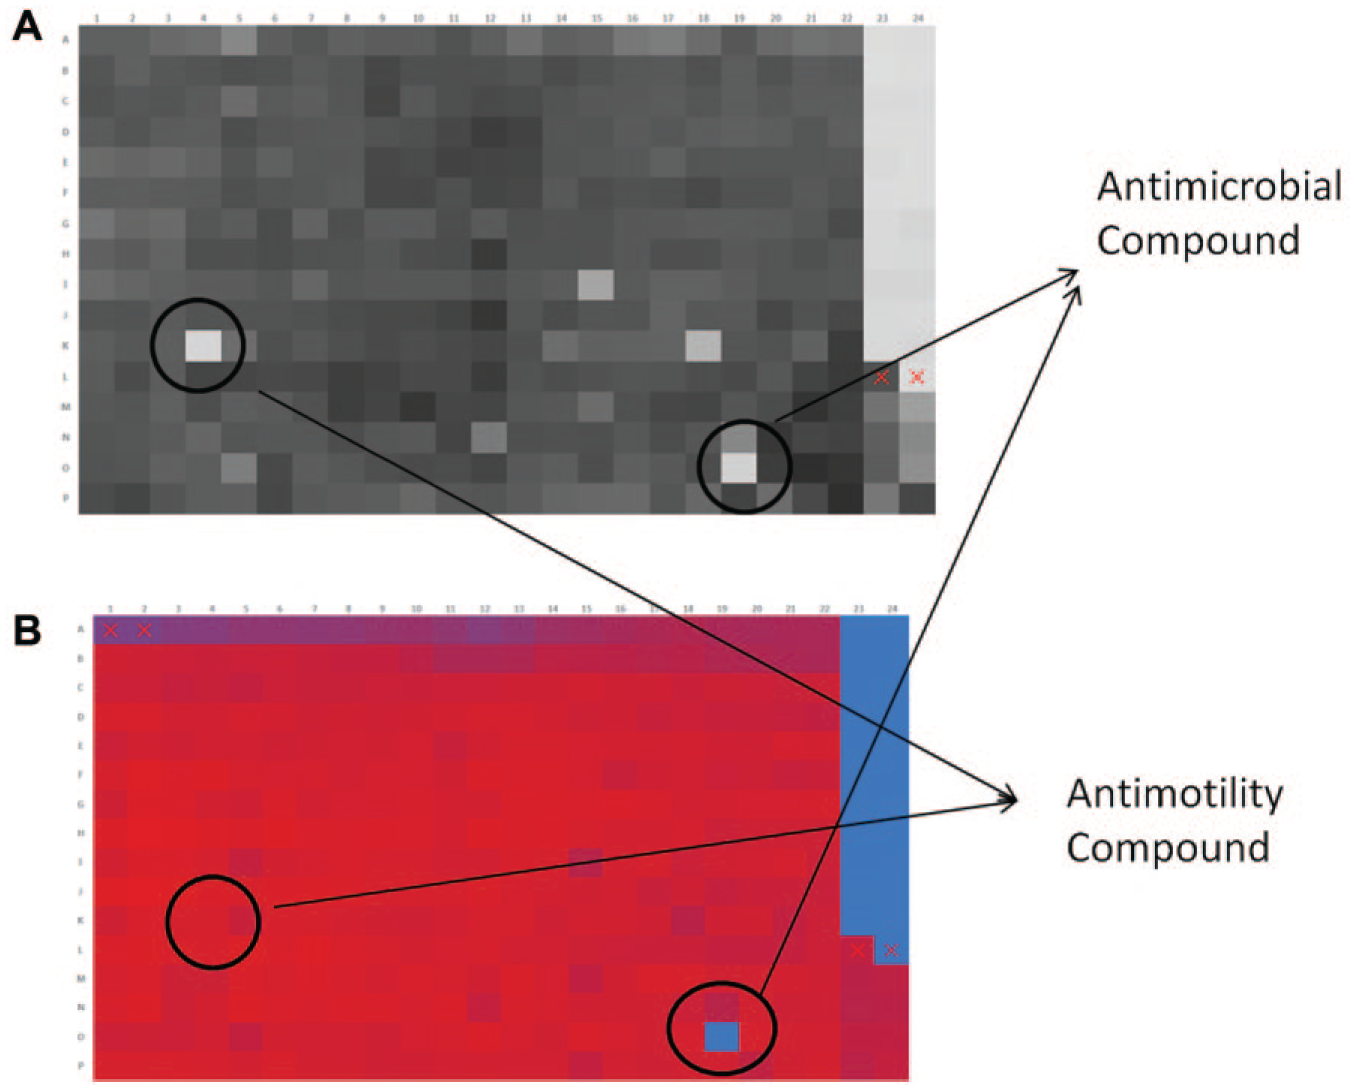
Heat maps of the motility absorbance read at 615 nm (
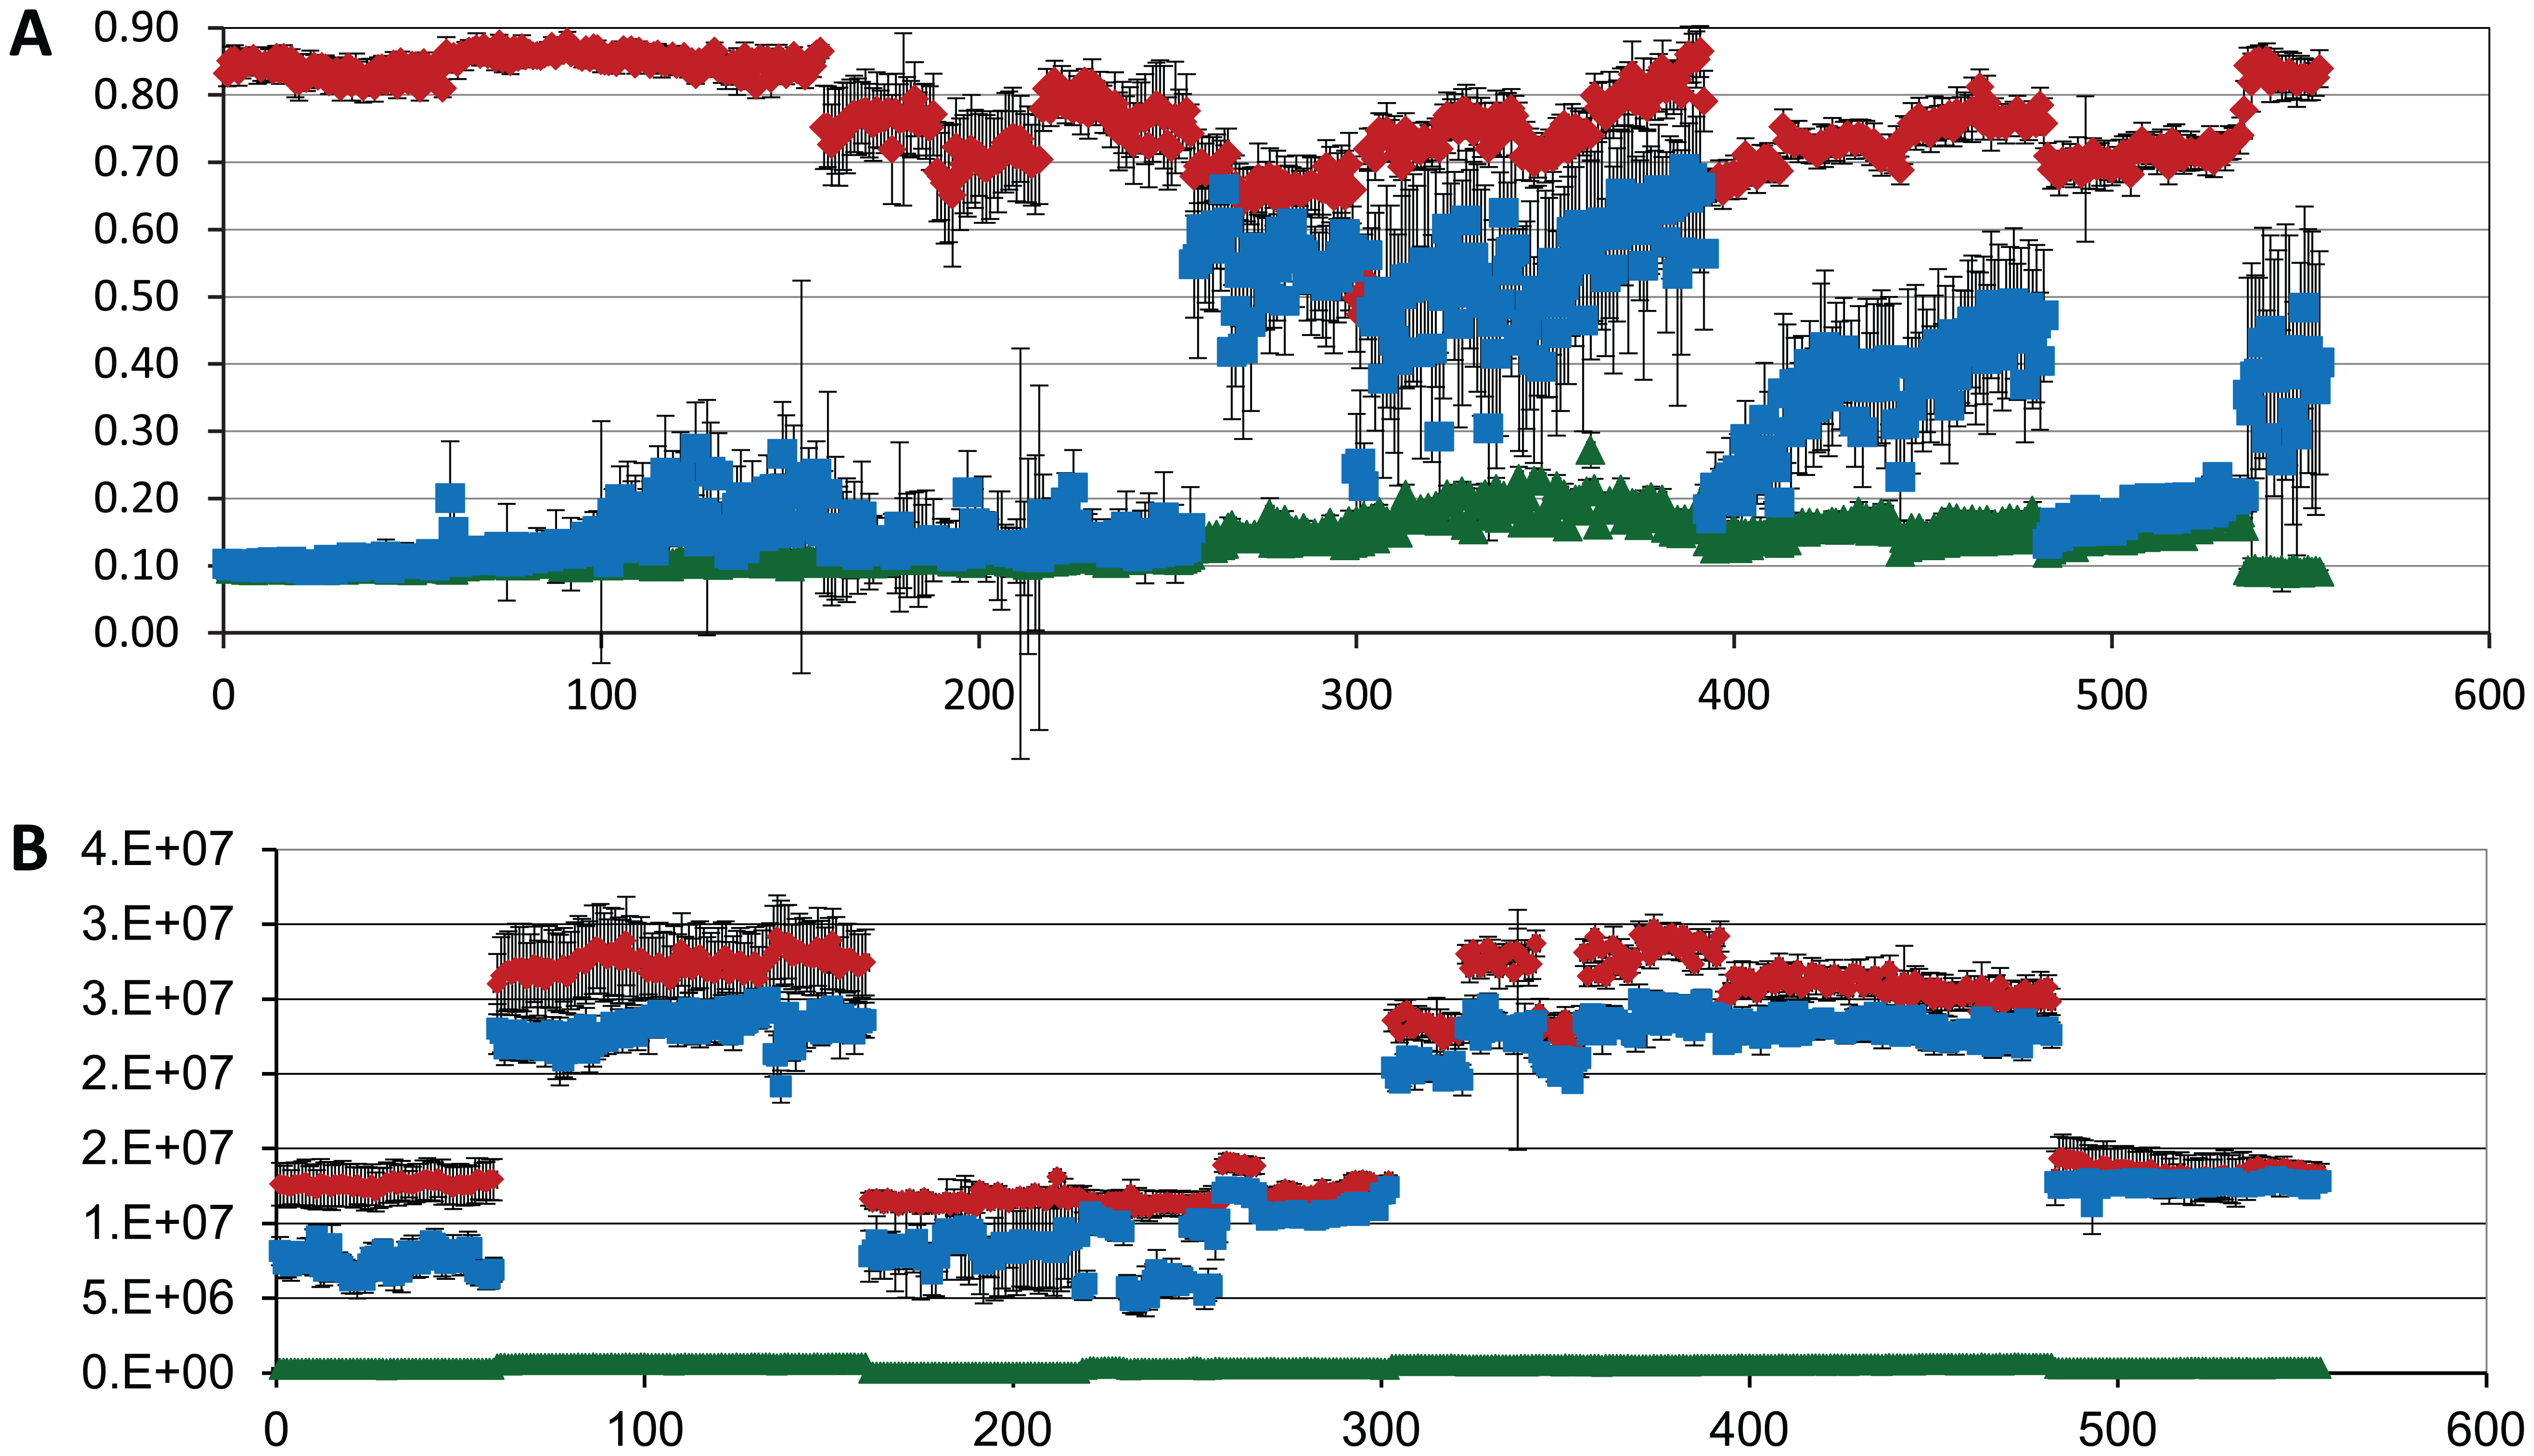
Historical controls for an HTS screening campaign to identify motility inhibitors of V. cholerae. A 555-plate HTS campaign was conducted in the 384-well format, both for the motility endpoint using absorbance (
Virus Quantitation
The HTS Center also screens antiviral assays, and the low-volume aqueous transfer capabilities of ADE have been leveraged to produce high-throughput assays that were technically difficult or impossible before. For virologists, a critical process is determination of viral titer. This is most frequently determined by using a plaque assay. While the plaque assay is a reliable way to determine virus titer, it is not high throughput. Briefly, the process involves plating cells in low-density plates, usually 6- or 24-well plates, to produce a monolayer. Virus-containing media is serial diluted, usually across 6, 8, or 10 logs, depending on the virus. An aliquot of each dilution is adsorbed onto the monolayer of cells. After a short incubation of an hour, the inoculum is removed and the monolayer of cells is overlaid with media containing agarose to prevent widespread dispersion of progeny virus from initially infected cells. These plates are incubated for several days and then stained to visualize live cells and the plaques, which are clear areas created by the virus-induced death of infected cells. Each plaque is the result of a single virus infecting a cell, followed by the infection of adjacent cells as the virus replicates. Plaques are counted manually, and the titer of the original virus-containing material is determined by the dilution and number of plaques that fall into an optimal number for accurate counts. Two higher-throughput methods are available to quantitate the amount of virus in a sample: TCID50 and qPCR. While these are higher throughput than a plaque assay, they had not been adapted to high-throughput format.
TCID50
TCID50 also employs a dilution scheme, but instead of setting up a plaque assay, the strategy is to dilute the virus to less than one virus particle per volume dispensed to a well of a microtiter plate. Different dilutions of the virus stock are dispensed to multiple wells of the microtiter plate containing cells. Plates are incubated for several days, and then virus replication is assessed using an appropriate readout. For viruses that produce CPE, any of the available cell viability endpoints, such as CTG or alamarBlue, can be used. If a virus is engineered to contain a reporter gene, then that is used for the readout. Wells that received no virus will have values similar to those of the cell control, and wells that did receive a virus will have a virus-specific readout, such as reduction in host cell viability due to the cell death caused by the virus or increased signal from a reporter gene. At one dilution, some of the replicate wells will receive a virus particle and some will not. The TCID50 of virus is then calculated as the dilution at which 50% of the replicate wells would be positive. The HTS Center has used the ADE aqueous transfer capabilities to dispense virus either from the undiluted stock or from manual dilutions of the virus stock. From a single sample, the Echo can dispense across 3 logs by dispensing different volumes, for example, 2.5, 25, and 250 nL. This reduces the number of manual dilutions that need to be prepared, and dispensing to any number of replicate wells for the TCID50 plate is quickly and easily accomplished with a transfer file on the Echo 555. While this process is more automatable than the plaque assay, it is still not high throughput or efficient since a broad range of dilutions (accomplished with both conventional dilution and dispensing of a range of volumes) need to be tested and numerous replicates at each dilution need to be evaluated for an accurate titer determination. The TCID50 limiting dilution technique was used to titer an influenza virus that had been engineered to contain the NanoLuc reporter gene. Figure 2A illustrates how the assay plate was set up for a TCID50 titration with 20 replicate wells for six virus dilutions over a 6-log range. Figure 2B is a heat map of the actual virus titration using the layout from Figure 2A .
Figure 3 illustrates the strategy for calculating the TCID50 using the data generated from the assay illustrated in Figure 2 . Virus dilution is plotted on the X axis, and number of virus positive wells are plotted on the Y axis. Formula 504 from XLfit is used to plot the curve {XLfit 504 = ((E + (A*exp(((–1)*B)*x))) + (C*exp(((–1)*D)*x)))}. The TCID50 is calculated from the curve fit as the concentration where 50% of the tested wells would be virus positive. In this example, the number of wells tested at each dilution was 20, so the TCID50 was calculated from the point at which the curve reached 10 positive wells. Accuracy of the TCID50 value is improved by testing 10 or more wells at each concentration, which is facilitated with the use of ADE to dispense virus to the test wells.
qPCR
PCR has been used for influenza identification, 27 but it can also be used as another way to quantitate the number of virus particles in a sample by using qPCR. The advantages are that it does not require evaluation of a large number of dilutions per wells and it is easily automated. The recent launch of the first 1536-well-format qPCR instrument, the LightCycler 1536, also has the potential to make it high throughput. A disadvantage is that it does not differentiate between infectious and noninfectious virus particles. Nonetheless, it does offer a rapid high-throughput way to evaluate the process of viral replication, assembly, and release. For development of this assay, we wanted to test if virus particles in supernatant from infected cells could serve as the source of the vRNA for qPCR without any sample processing. ADE aqueous transfer capabilities were used to transfer virus-containing media directly into qPCR plates containing the master mix, and then the plates were then sealed, centrifuged, and cycled. Because of the high accuracy and precision of the ADE transfer at very small volumes, total reaction volumes of 0.5 to 1 µL in the 1536-well format were possible, making high-throughput qPCR a reality. The fact that the virus packages and exports the viral nucleic acid into the supernatant could eliminate much of the sample preparation, and if the detergent in the PCR master mix is sufficient to disrupt the virus and allow PCR to proceed, then sample preparation would not be necessary. Evaluation of virus production by qPCR would be of great value for researchers working with viruses that are not amenable to plaque assays or TCID50 evaluation of titer.
To test the feasibility of this process, dilutions of the high-titer influenza H3N2 Udorn strain were serial diluted in assay media to simulate the range of virus titers that would occur in an antiviral screen and to determine the limit of detection of the assay. Figure 6A shows the fluorescence intensity versus cycle plot, which is output from the LightCycler 1536, and Cp values for the various dilutions are shown in the table in Figure 6B . Note that at the 1/625 dilution, not all wells produced a Cp value, indicating that less than one virus particle per 50 nL of virus inoculum was dispensed to each well of the PCR plate. The next dilution was below the level of sensitivity for this assay, with no positive wells reported.
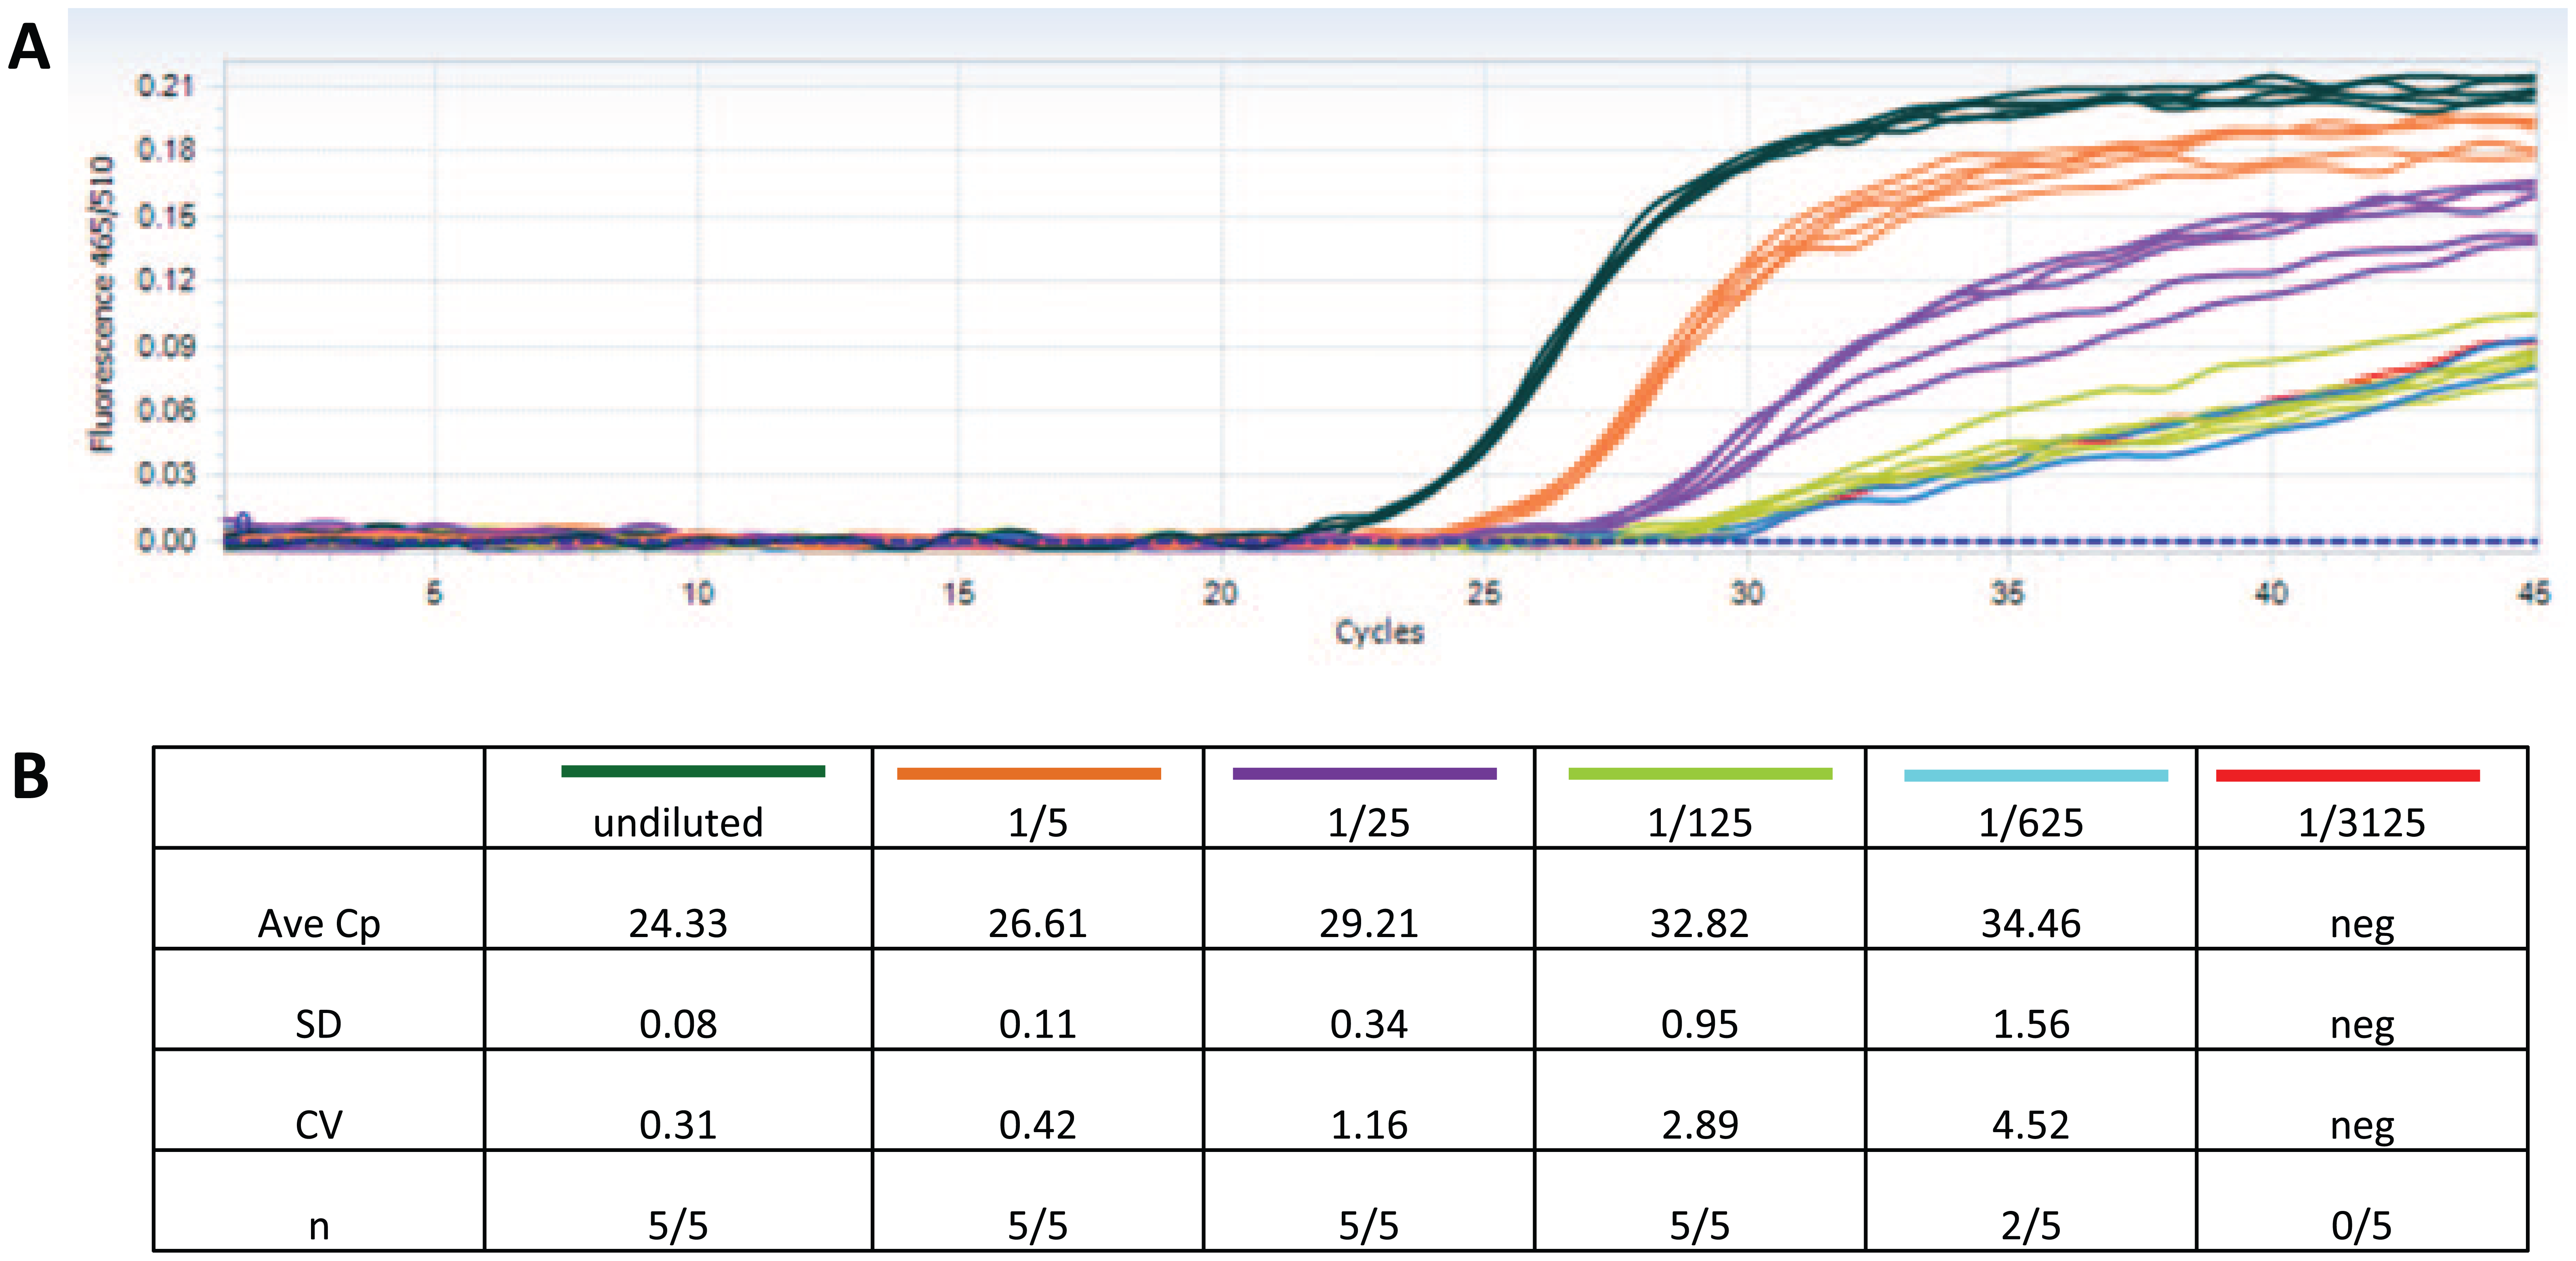
qPCR results from the LightCycler 1536. (
Assay-Ready Plates Enable Collaboration
In addition to these new assay capabilities enabled by ADE, the original transfer of compounds in DMSO enables not only miniaturization of assays and improved precision of low-volume transfers, but also, through the production of ARPs, the collaboration and coordination of screening campaigns between sites that are not in physical proximity or that have unique capabilities. As an example, in 2013 the HTS Center at Southern Research and the Galveston National Laboratory entered into a collaboration to determine if HTS could be done within a BSL-4 laboratory with virulent BSL-4-level pathogens. Both organizations had some of the required capabilities, but neither had all of the capabilities to undertake this project alone. Southern Research had the compound libraries, the Echo 555 liquid handler to make ARPs, HTS experience screening pathogens up to the BSL-3 level of biocontainment, and the IT infrastructure to manage the data. Galveston National Laboratory had the BSL-4 facility, the pathogens, the expertise to work with these pathogens, and the equipment necessary to conduct a high-throughput screen within the BSL-4. This work resulted in the development of a process to conduct HTS assays with reasonable throughput in the BSL-4 containment environment. The first proof-of-principle pilot screen was a 10,000-compound screen using Nipah virus. 8 Based on this pilot screen, it is projected that a single researcher can handle up to 24,384-well plates per run. For a 3-day assay like Nipah, two runs per week can be scheduled without overlap of setup and screening processes. This works out to a throughput of more than 13,000 compounds a week. It is projected, based on our experience with BSL-3 screening, that two operators could double that throughput. While these screening numbers fall short of the throughput achieved at the BSL-2 or BSL-3 level, it is a significant increase over published screens conducted with BSL-4 containment pathogens.28,29
The process started by adapting existing low-throughput assays that were done historically at Galveston National Laboratory to a more high-throughput format. Control and Z′ values for the Nipah pilot are shown in Figure 7 . Z′ values for the Nipah screen averaged 0.72 ± 0.07. From the pilot screen, 120 compounds were selected for additional evaluation in dose response format using both the antiviral and a cell-based toxicity assay. Concentrations ranged from 50 µM to 100 nM. Following the dose response screen, 26 compounds were resupplied from the manufacturer and rescreened in the dose response and toxicity assays. Thirteen of these compounds showed activity in a dose-dependent manor in the antiviral assay, with minimal toxicity in the cell toxicity assay.
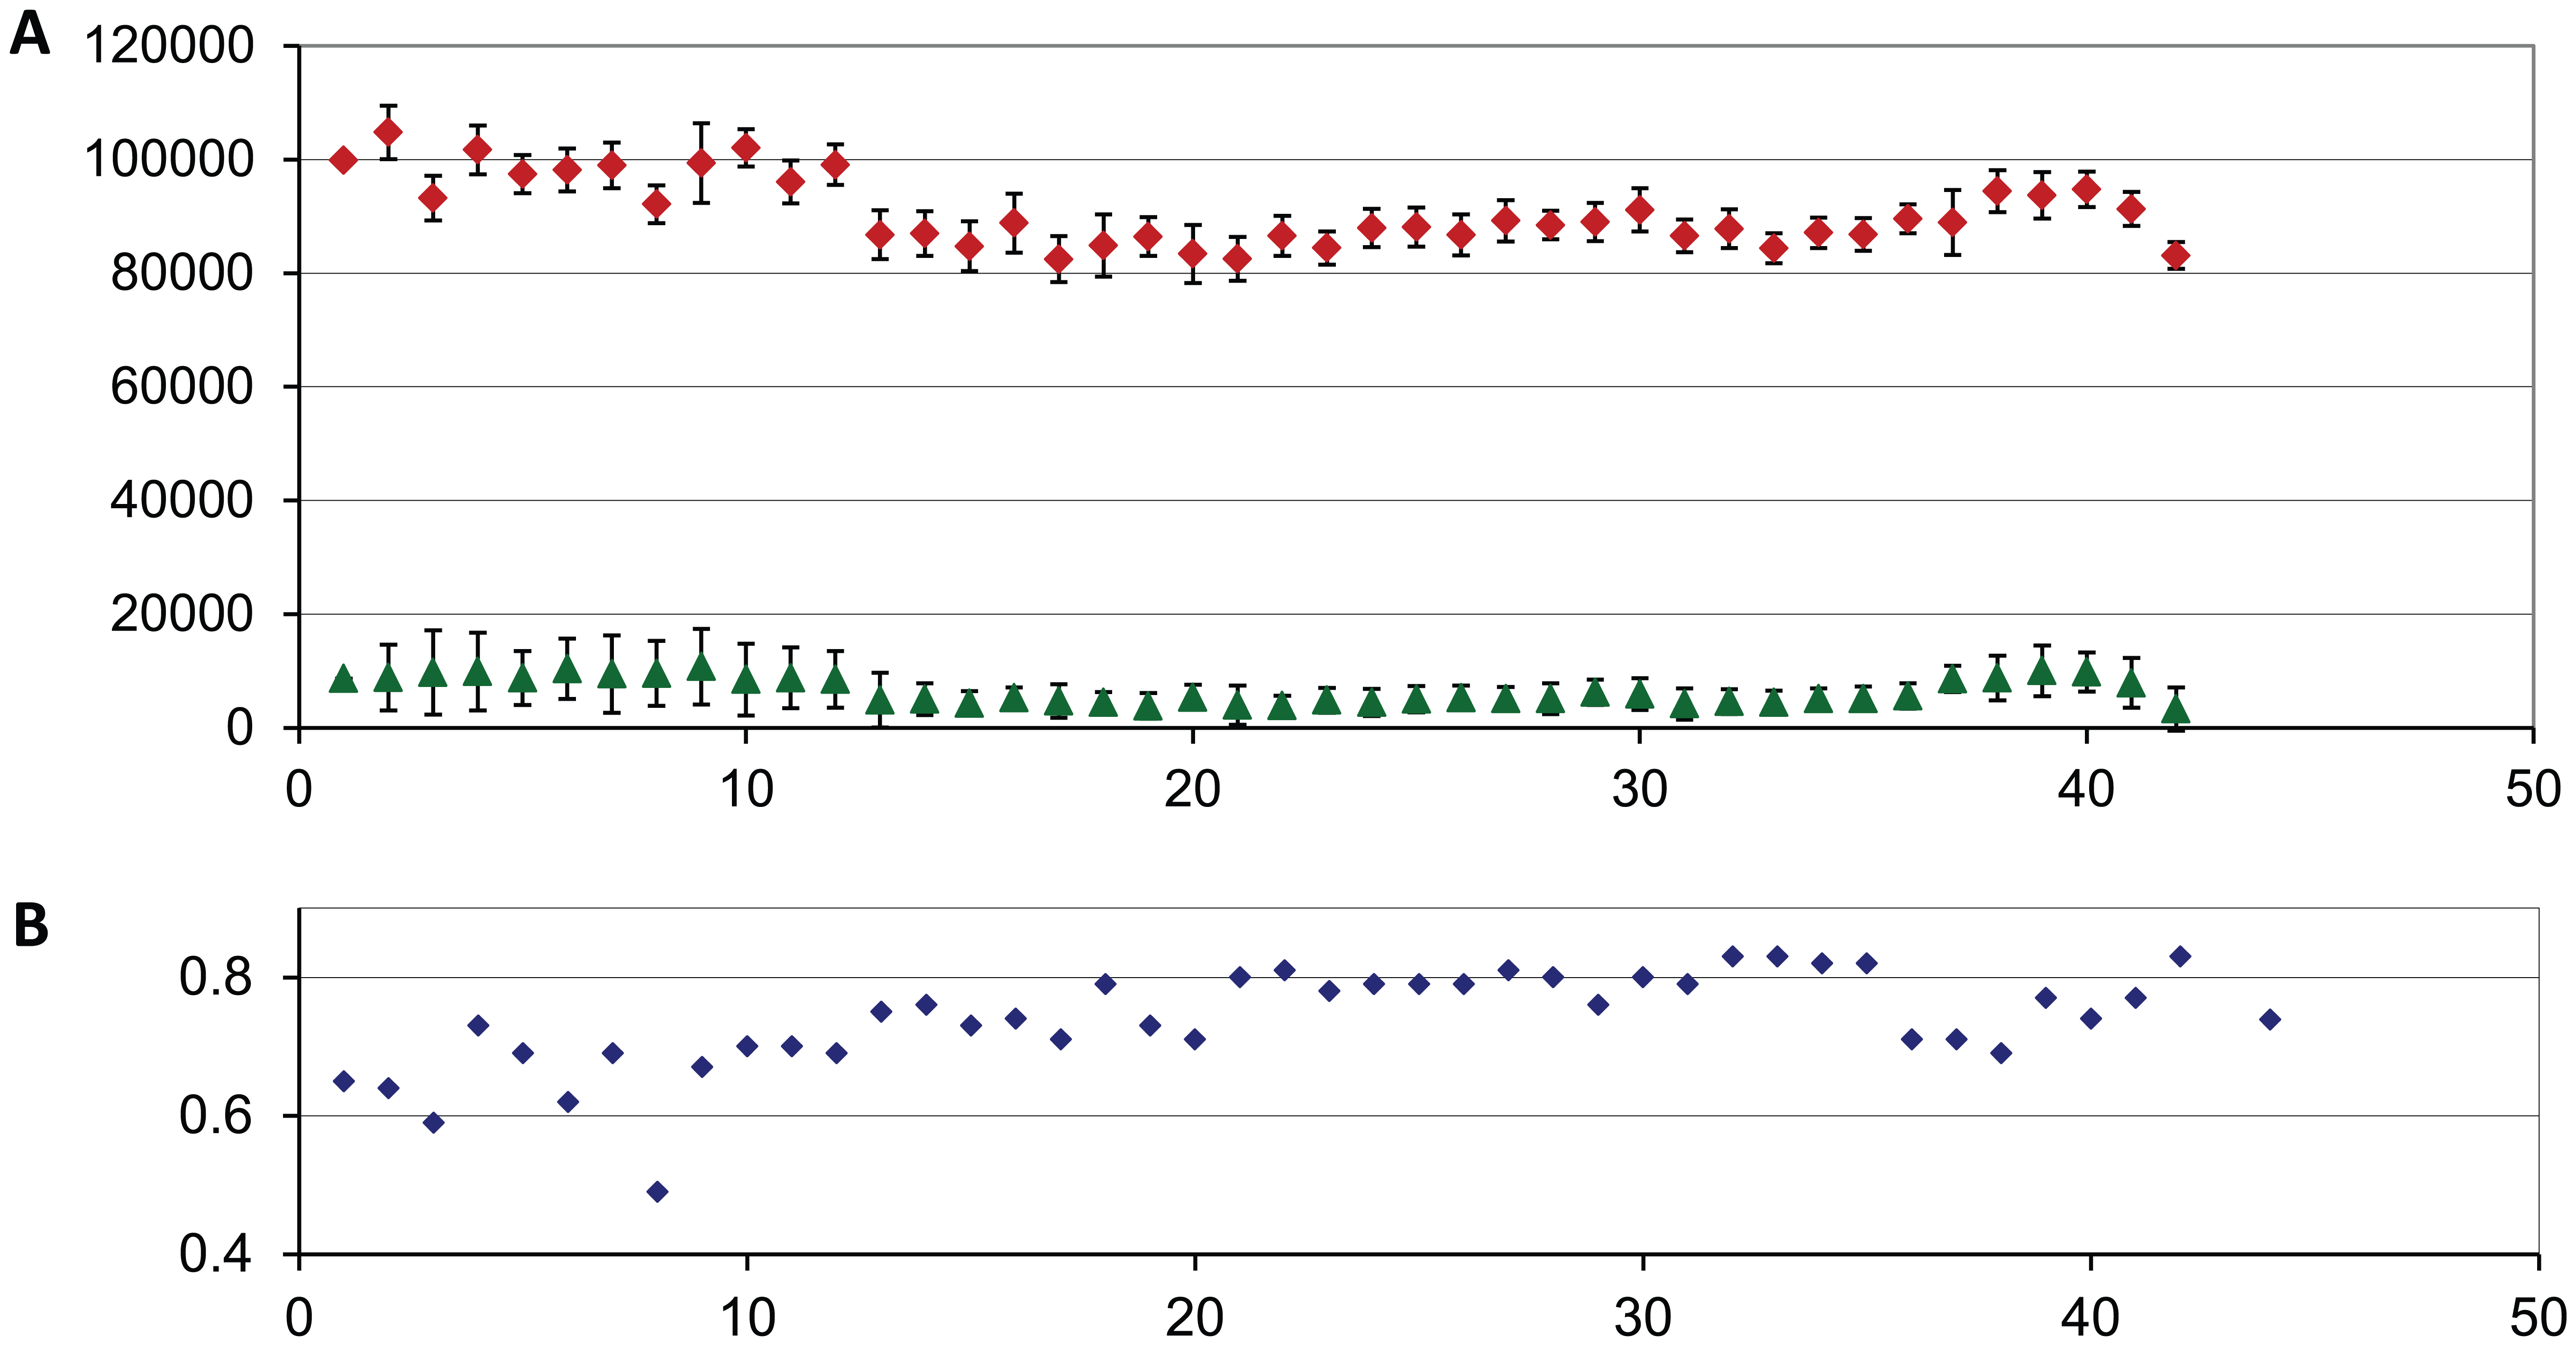
Historical controls for the Nipah virus pilot screen. Median virus and cell control values are plotted for each plate run in the pilot screen. (
Following the success of the Nipah pilot screen, a second assay, using Ebola-GFP, was adapted to the HTS process and a 10,000-compound pilot screen was also done on this assay with similar results and throughput. For the Ebola pilot screen, control and Z′ values are shown in Figure 8 . Z′ values averaged 0.74 ± 0.11. Since the Ebola assay was done using a virus engineered to express GFP, antiviral compounds and toxic compounds would both reduce the GFP signal, resulting in false positives derived from the toxic compounds. To reduce the number of false positive hits in the screen, the plates were first read to quantitate the amount of GFP produced. This was followed by a cell viability read of the same plate with CTG. This was possible because the GFP signal was optimal at 72 h and reduction in cell viability due to virus infection did not become significant for several more days. While not optimal, it did allow the identification and exclusion of overtly toxic compounds. Two hundred and eighty compounds were selected for evaluation by dose response, in both the GFP antiviral and cell toxicity assays. One hundred and thirty-nine compounds produced reduction of GFP signal in the dose response, but many of these were also toxic. In the end, 58 compounds reduced viral replication as measured by the GFP signal and produced minimal toxicity in the cell viability assay, which was measured using CTG. The 26 compounds identified in the Nipah pilot screen were also run in the Ebola and toxicity assays. Surprisingly, four of these compounds also showed activity in the Ebola assay with minimal cellular toxicity.
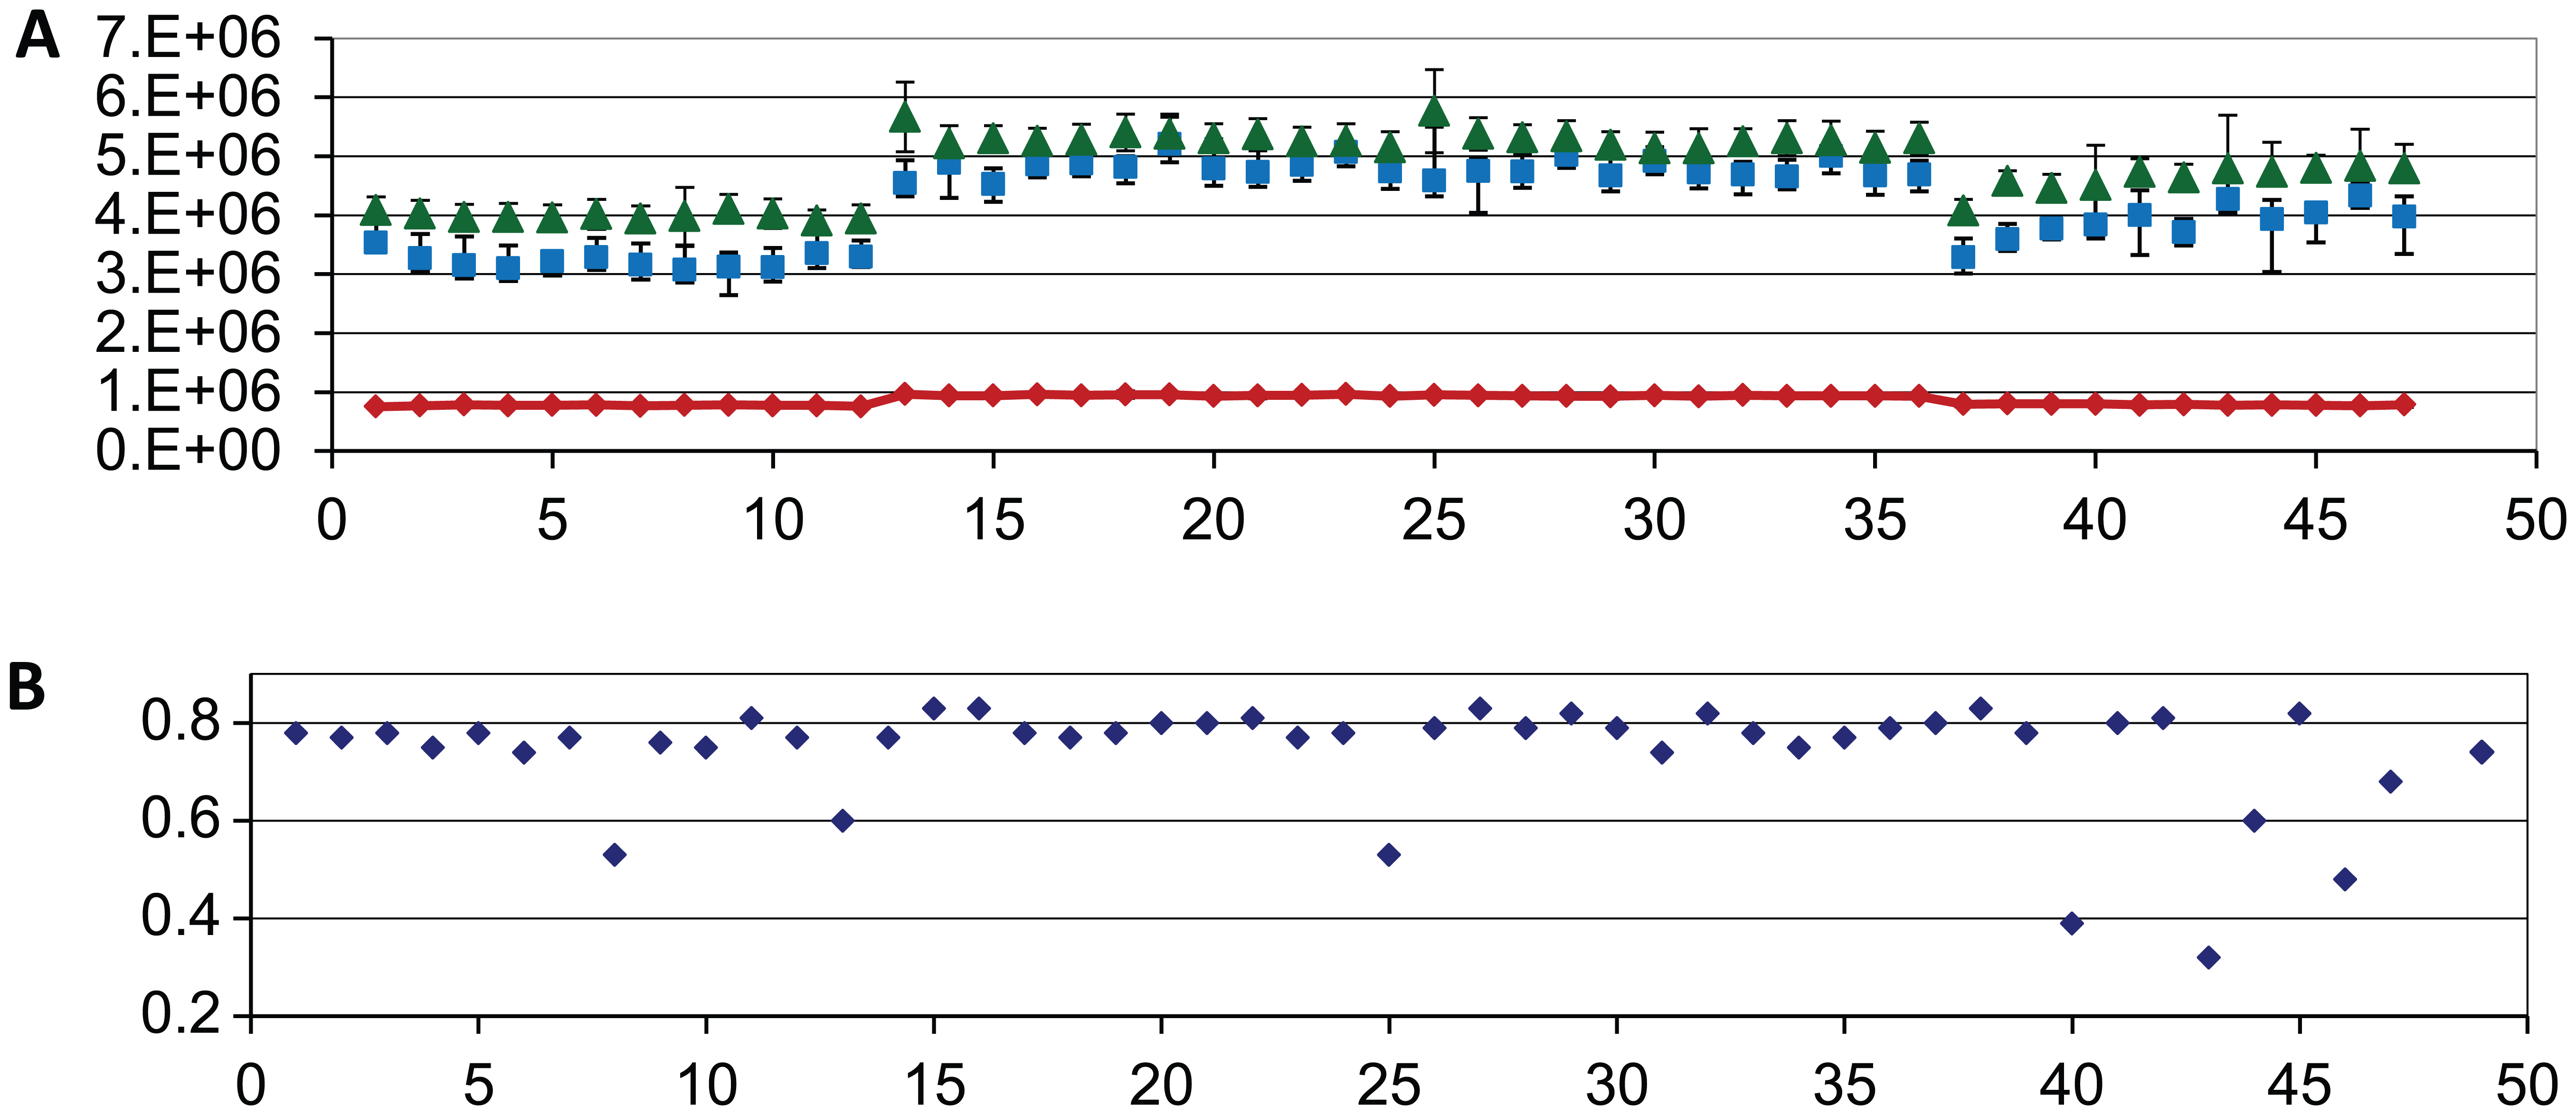
Historical controls for the Ebola-GFP virus pilot screen. Median virus and cell control values are plotted for each plate run in the pilot screen. (
As the ADE technology has been adopted and the capability expanded beyond compounds solubilized in DMSO, many innovative uses have been developed in many different areas of research, some of which are highlighted in this special edition. In the infectious disease arena, a number of unusual applications have been reviewed. The versatility of the technology has enabled a wide range of assays to be conducted with infectious agents in the HTS Center at Southern Research that would have been difficult or impossible to do otherwise.
Footnotes
Acknowledgements
Technical assistance was provided by Sara McKellip, Melinda Sosa, and Nichole Tower of the Southern Research HTS Center and Bersabeh Tigabu at UTMB.
Declaration of Conflicting Interests
The authors declared no potential conflicts of interest with respect to the research, authorship, and/or publication of this article.
Funding
The authors disclosed receipt of the following financial support for the research, authorship, and/or publication of this article: Funding was provided by the Southern Research Strategic Investment Program; the Alabama Drug Discovery Alliance; NIH-NIAID awards N01 AI 15449 “Microbiological Drug Screening,” N01-AI-30047 and HHSN2722011000009C “In Vitro Antiviral Screening,” and U19Al109664 “Therapeutics Targeting Filoviral Interferon-Antagonist and Replication Function”; the NIH Roadmap Initiative U54 HG003917 and U54 HG005034; and Antiviral Drug Discovery and Development Center 1U19AI109680.