
Abstract
Improvements needed for automated crystallography include crystal detection and crystal harvesting. A technique that uses acoustic droplet ejection to harvest crystals was previously reported. Here a method is described for using the same acoustic instrument to detect protein crystals and to monitor crystal growth. Acoustic pulses were used to monitor the progress of crystallization trials and to detect the presence and location of protein crystals. Crystals were detected, and crystallization was monitored in aqueous solutions and in lipidic cubic phase. Using a commercially available acoustic instrument, crystals measuring ~150 µm or larger were readily detected. Simple laboratory techniques were used to increase the sensitivity to 50 µm by suspending the crystals away from the plastic surface of the crystallization plate. This increased the sensitivity by separating the strong signal generated by the plate bottom that can mask the signal from small protein crystals. It is possible to further boost the acoustic reflection from small crystals by reducing the wavelength of the incident sound pulse, but our current instrumentation does not allow this option. In the future, commercially available sound-emitting transducers with a characteristic frequency near 300 MHz should detect and monitor the growth of individual 3 µm crystals.
Keywords
Introduction
Two remaining bottlenecks that limit the rate of structure determination are the identification of crystallization conditions and harvesting of the protein crystals. We previously demonstrated that protein crystals can be harvested by using acoustic droplet ejection (ADE) to propel small droplets containing crystals out of the mother liquor, through a short air column, and onto a micromesh 1 or onto a crystal transporting conveyor belt that is linked to the x-ray diffractometer. 2 Crystals can be harvested from custom-designed growth plates or from conventional growth plates. 3 ADE can also be used to prepare crystallization trays, 4 to improve the quality of protein crystals through micro-seeding, 5 and for high-throughput screening of protein crystals. 6 All of these methods use a common technology platform. Here, we demonstrate that the same equipment can also be used to detect protein crystals and to monitor the progress of crystallization by generating sound pulses (or “pings”) and listening for the reflected sound waves.
With existing instrumentation (transducer frequency of 11.5 MHz), the sensitivity for detecting protein crystals using sonar is modest compared with other techniques. The current minimum detectable crystal size is 50 µm, compared with 0.1 µm for SONICC detection 7 (note that SONICC is an optical crystal detection technique that makes no use of sound waves). The published object detection limit for the transducer used in this study is 25 µm (compared with the 50 µm that we observed). It is possible that the softness of biological samples causes loss of sensitivity. High-frequency transducers are available with a characteristic wavelength 15 times smaller than our equipment, 8 which implies a detection limit of 3 µm using current technology—still significantly less sensitive than alternative methods. However, sonar detection does not require an optically accessible path for light and offers the benefit of measuring the crystal location with high precision in all three dimensions, which could facilitate automated in situ data collection. Conventional visualization methods cannot accurately determine the z-coordinate.9,10 In contrast, sonar determines the z-coordinate of the crystal by measuring the scattered signal time with great accuracy (so that the z position is better measured than the x and y positions). This crystal-centering information could be passed directly to the diffractometer control software for unattended data collection (automated crystal centering is also possible using image recognition or using x-ray grid scanning).11,12 In addition, acoustic detection is potentially fast because hundreds of sonar pulses can be processed each second. For example, if a 1 mm crystallization shelf is scanned using a 10 × 10 grid (100 sonar pulses, <1 s), the location of each crystal will be known to an accuracy of ±100 µm.
If the location of the crystal is not needed, both the detection speed and the crystal size sensitivity can be greatly improved by indirectly deducing crystal formation from a decrease in the amplitude of the surface reflection (a decrease in the amplitude is a proxy measure of the aggregate attenuation caused by all of the crystals in the well). This increases the detection speed because a single pulse is used to monitor the amplitude of the surface reflection, compared with many pulses needed to scan each region in the well. Sensitivity is increased because the combined scattering from all of the crystals in the well is greater than the contribution from any one crystal and because all forms of scattering decrease the surface reflection (in contrast, only reflected, or backscattered, sound energy contributes to directly detect a single crystal). Hence, the surface reflection can be used to monitor the progress of crystallization and to determine when crystal growth is complete.
Methods
For this project, we used a liquid-handling instrument called the Echo 550 (Labcyte Inc., Sunnyvale, CA) that uses focused sound pulses to transfer momentum to a liquid or suspended solid in a source plate, causing a 2.5 nL droplet to be ejected out of the source plate, through a short air column, and onto a desired location on a destination plate. The instrument also uses lower energy (or subejection) sound pulses to measure the state of the liquid within each source well to adjust the focus and ejection pulse for that specific well. Up to 500 sound pulses can be generated each second by a transducer located inside the Echo 550 and focused at the fluid surface to eject droplets. In addition to the kinetic energy that is transferred to the droplet, some of the energy in each pulse is scattered by the materials through which the sound wave propagates, and some is reflected when the pulse transits through the interface between materials with different acoustic impedance. 13
These experiments used a repeated application of the sonar pulses (or “pings”) that are used for setting the focus rather than the droplet ejection pulses (or “tone bursts”). Our goal was to probe the contents of crystallization experiments in aqueous media and in lipidic cubic phase (LCP; Fig. 1 ). The energy that is reflected from each object inside of the crystallization plate is detected by the transducer (a component of the Echo 550). This generates a continuous sonar scan that probes a column as it propagates into the crystallization region and further probes a wider area as it propagates back to the detector. Hence, each transducer ping produces two sources of data about the state of the crystallization experiment. First, the stream of reflections caused by material inside of the crystallization experiment contains detailed information about the location, size, and composition of the materials that are found in a ~300 µm diameter cylindrical column directly above the transducer (corresponding to the focal region of the acoustic beam). Second, the strength of the reflection that is caused by the liquid–air interface is a proxy measure for the aggregate scattering from all of the material in the sample. If one assumes that over the course of the crystallization experiment, the fluid–air interface does not significantly change, any observed reduction in the surface reflection implies scattering (or absorption) from the material in the sample. We tested the limits of acoustic crystal detection using lysozyme crystals that were grown in a liquid crystallization matrix by batch, in a liquid crystallization matrix resting on an agarose pedestal, 1 and in an LCP crystallization matrix. 14 Lysozyme crystals were grown by various methods (separately described) by dissolving 120 mg/mL protein in 0.1 M sodium acetate pH 4.6 and using 6% sodium chloride plus 15% glycerol precipitant.
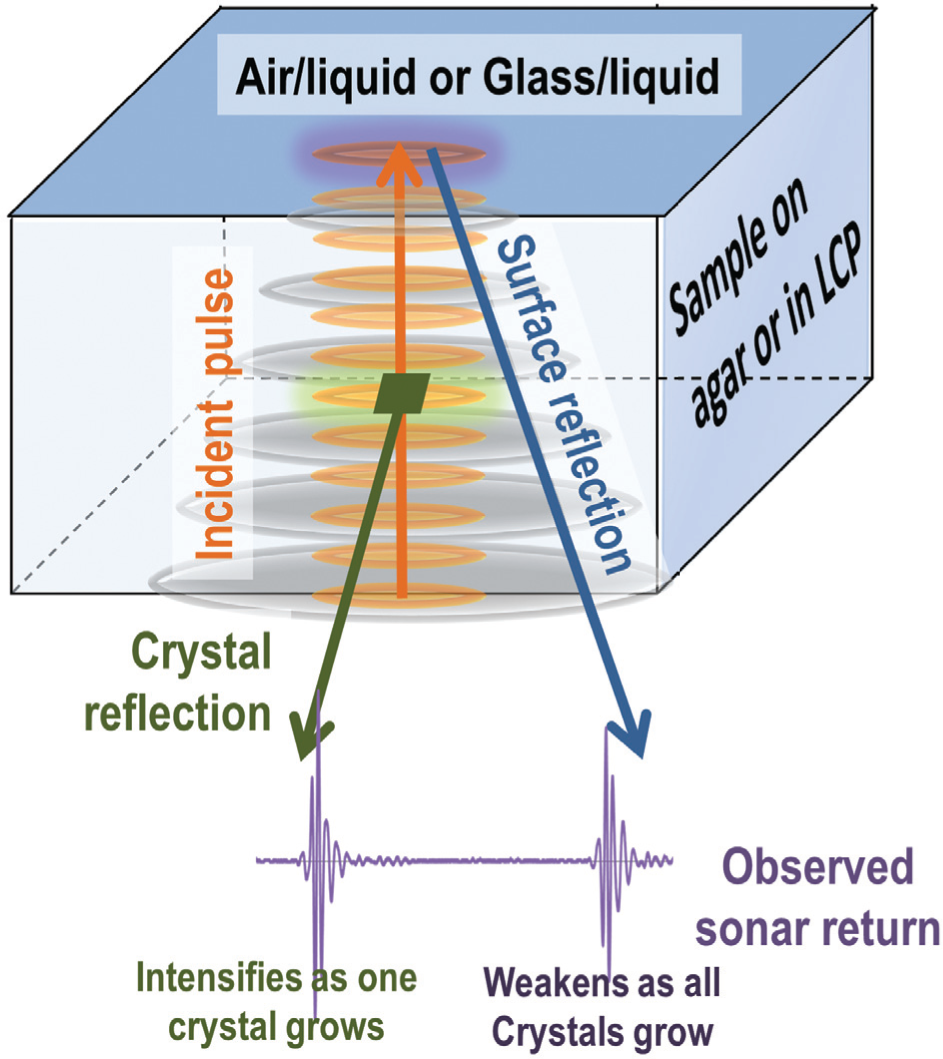
Acoustic monitoring produces two complementary sources of data about the state of the crystallization experiment. As the incident acoustic “ping” propagates through the sample, some energy may be reflected from crystals larger than ~30 µm (this “crystal reflection” is shown in green). The amplitude of this reflection is related to the size of the crystal, the pulse location yields the X-Y coordinate of the crystal, and the time lag determines the Z coordinate of the crystal. When the sound pulse reaches the surface, all remaining energy is reflected. This surface reflection (shown in blue) travels back to the detector in a broadening cone. The surface reflection is scattered by all solid-state materials in the sample (including small crystals), so that the attenuation of the surface reflection is a proxy measure for the aggregate burden of solid material in the sample. Note that lysozyme crystals were grown and acoustically probed both on top of an agar surface and embedded in the lipidic cubic phase.
Detecting Crystals in an Aqueous Crystallization Matrix
One well in an acoustically compatible 384-well polypropylene micro-plate (Labcyte Inc., P-05525, “PolyPro” hereafter) was modified by adding a concave agarose pedestal (described in Cuttitta et al., 2015 3 ). Briefly, precipitant solution (6% sodium chloride, 15% glycerol, 0.1 M sodium acetate pH 4.6) was combined with 0.6% w/v agarose (Catalog No. A6877, Sigma-Aldrich, St. Louis, MO) and heated to 100 °C until the solution was clear. One well in the PolyPro plate was overfilled with 70 µL of this precipitant-agarose mixture (cooled to 70 °C to make it tacky). The precipitant-agarose adhered to the walls of the well, so that a bowl-shaped surface was crafted by removing excess agarose (40 µL were aspirated out of the well from the center using a custom tool). 3 Lysozyme powder was dissolved at 120 mg/mL in 0.1 M sodium acetate pH 4.6, and 20 µL was layered on top of the agarose pedestal. The PolyPro plate was positioned inside of an Echo 550 liquid-handling instrument and the Echo WellPing (Labcyte Inc) software utility was used to periodically generate an acoustic pulse (or “ping”) vertically through the center of the crystallization well. The ping propagates through a region that is approximately cylindrical (radius ~150 µm), and any objects inside of this region can reflect sound waves back toward the instrument (the curvature of the agarose surface is negligible on this scale, so that each ping probes crystals lying on a flat agarose surface). The Echo 550 records the sound waves that are reflected back from each object. Initially, only two such reflections were observed: one from the plastic bottom of the PolyPro plate, and one from the surface of the mother liquor. We monitored each successive ping until an additional reflected sound wave was observed approximately midway between the plate bottom and the surface of the mother liquor. The PolyPro plate was then removed from the instrument, and the size of the crystal that gave rise to the reflected sound wave was recorded using a Leica microscope (only one crystal was observed in the vicinity of the cylindrical region).
Testing the Effect of Orientation on Crystal Reflection
We used lysozyme crystals, colored with methylene blue, to test the effect of orientation on the sound waves that a crystal reflects back towards the instrument. Lysozyme crystals were separately grown by hanging drop method using the same precipitant, buffer, and protein concentrations as described earlier, with the crystal soaked in 0.01% methylene blue. A single 200 µm × 100 µm × 100 µm crystal was selected and manually positioned with the long axis flat against an agarose pedestal that was prepared as described earlier. The crystal was pinged using the Echo WellPing software. The crystal orientation was then changed such that the long crystal axis was normal to the agarose pedestal, and it was again pinged.
Detecting Crystals in an LCP Crystallization Matrix
To characterize the sensitivity of acoustic crystal detection in LCP, we grew colored lysozyme crystals as described earlier and transferred them into a conventional LCP sandwich.
14
However, the glass composition of the LCP coverslips generated very strong reflected sound waves, and the narrow spacing between the top and bottom cover slips meant that these reflections were in close proximity to the crystal reflections. Consequently, the sound waves reflected from the crystal were difficult to resolve (supplemental
Continuously Monitoring Sonar Reflections as Crystals Grow
A single well in a PolyPro plate was prepared as described earlier. After the lysozyme-containing protein solution was deposited on the agarose pedestal, the plate was inserted into the Echo 550 instrument, and the Echo WellPing software was used for periodic acoustic monitoring. We then allowed crystals to grow overnight while being continuously monitored by the acoustic system. The experiment was halted when the amplitude of both the crystal and surface reflection stopped changing. The plate was then removed and examined with a Leica microscope. This experiment was repeated several times, including one occasion when a single large crystal grew directly in the path of the sound pulse, and one occasion when there were no crystals directly in the path of the sound pulse. In one case, a crystal that was directly in the path of the continuous sound pulse stream during its growth was harvested and cryo-cooled along with a control crystal that was not pinged. A similar control experiment was performed using all of the same components (including protein) but only 2% sodium chloride, which is insufficient to cause crystallization of lysozyme. Finally, a blank was performed using no salts or protein (i.e. pure water).
Results
The sensitivity of acoustic methods for detecting individual crystals was modest. We were able to detect 50 µm crystals in aqueous media and 200 µm crystals in LCP. The sensitivity was much improved when we monitored the strength of the surface reflection as a proxy estimate for the aggregate scattering from all crystals in the crystallization well.
Acoustic Monitoring Can Detect Crystals as Small as 50 µm
Figure 2 illustrates the amplitude of the reflected waves as a function of the height above the bottom of the crystallization plate (inverted axes; the dependent variable is the amplitude of the reflected wave, and this is plotted on the x axis so that the height above the plate bottom can be plotted in the familiar y direction). The first observed reflection from the growing crystal exceeded the noise level when the crystal was 50 µm × 50 µm × 25 µm in size (as illustrated in the figure). Subsequent to this scan, the crystal was allowed to continue growing larger, hence yielding a large and unambiguous reflection, in order to confirm the accuracy of the detection.
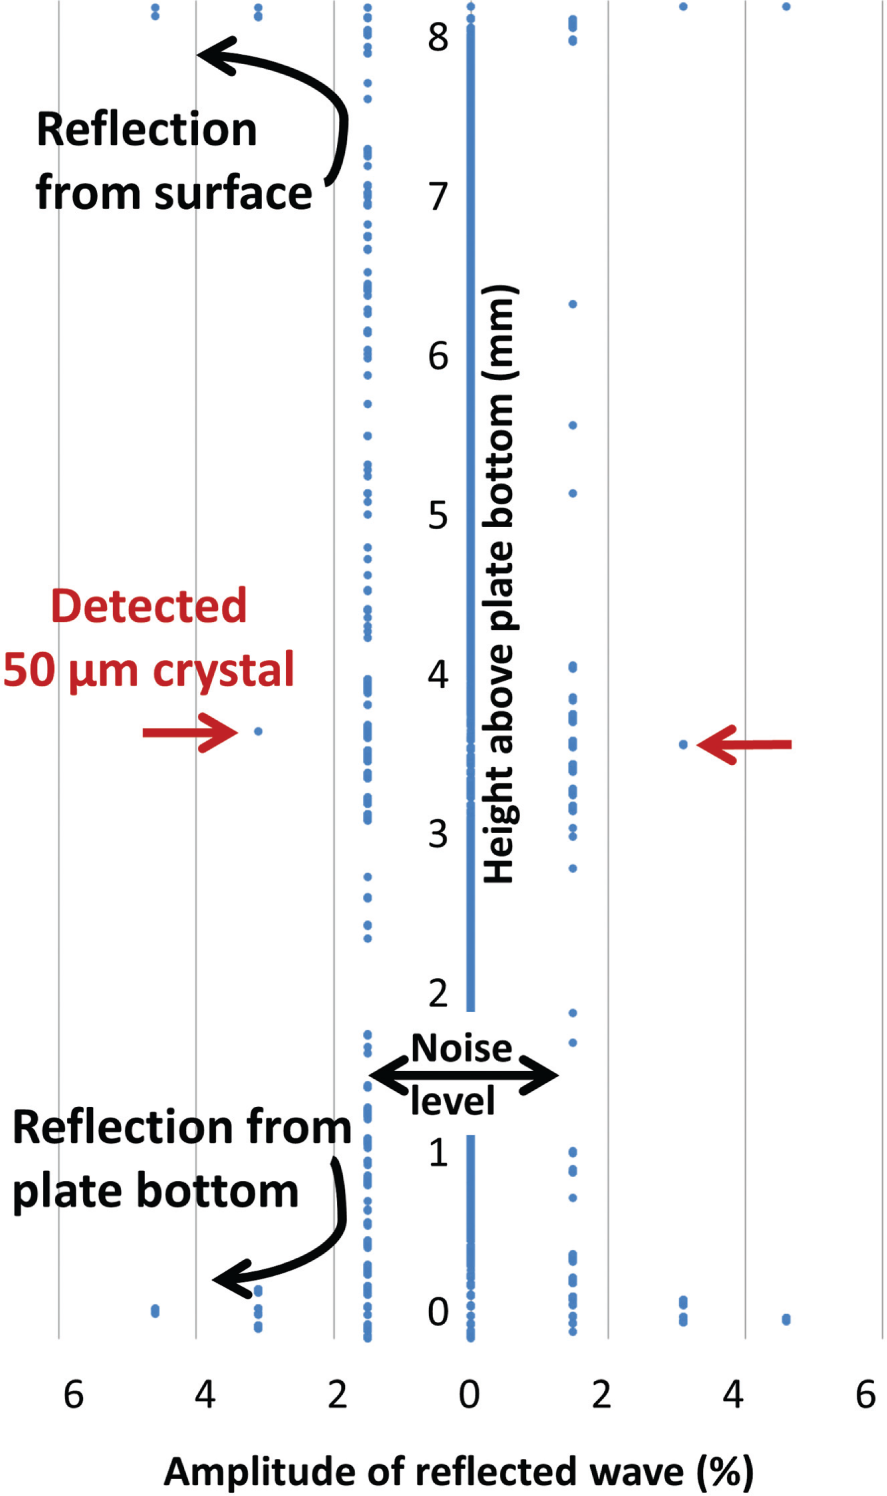
Acoustic detection of 50 µm crystals suspended on an agarose pedestal. As the sound pulse propagates upwards through the crystallization well (y axis, shown in mm), it generates a detectable reflection (x axis, amplitude of the reflection is shown as a percentage of the amplitude of the reflection from the plate bottom). The acoustic reflection from a 50 µm crystal that is suspended on an agarose pedestal is visible above the noise level. In contrast, the acoustic reflection from a 150 µm crystal resting against the bottom of the crystallization plate was barely resolved from the reflection of the plate bottom itself (data not shown). Note that the ~1.55% step size for data reported by the instrument is calibrated to correspond to its measurement precision.
Orientation of Protein Crystals Affects the Sonar Return
Figure 3 illustrates the amplitude of the reflected wave from a single lysozyme crystal (shown in inset) that was pinged first when lying flat against the agarose pedestal and again when standing perpendicular to the agarose pedestal. The acoustic reflection is significantly stronger for the crystal in the flat orientation, indicating that a large surface area magnifies the reflecting power of the crystal.
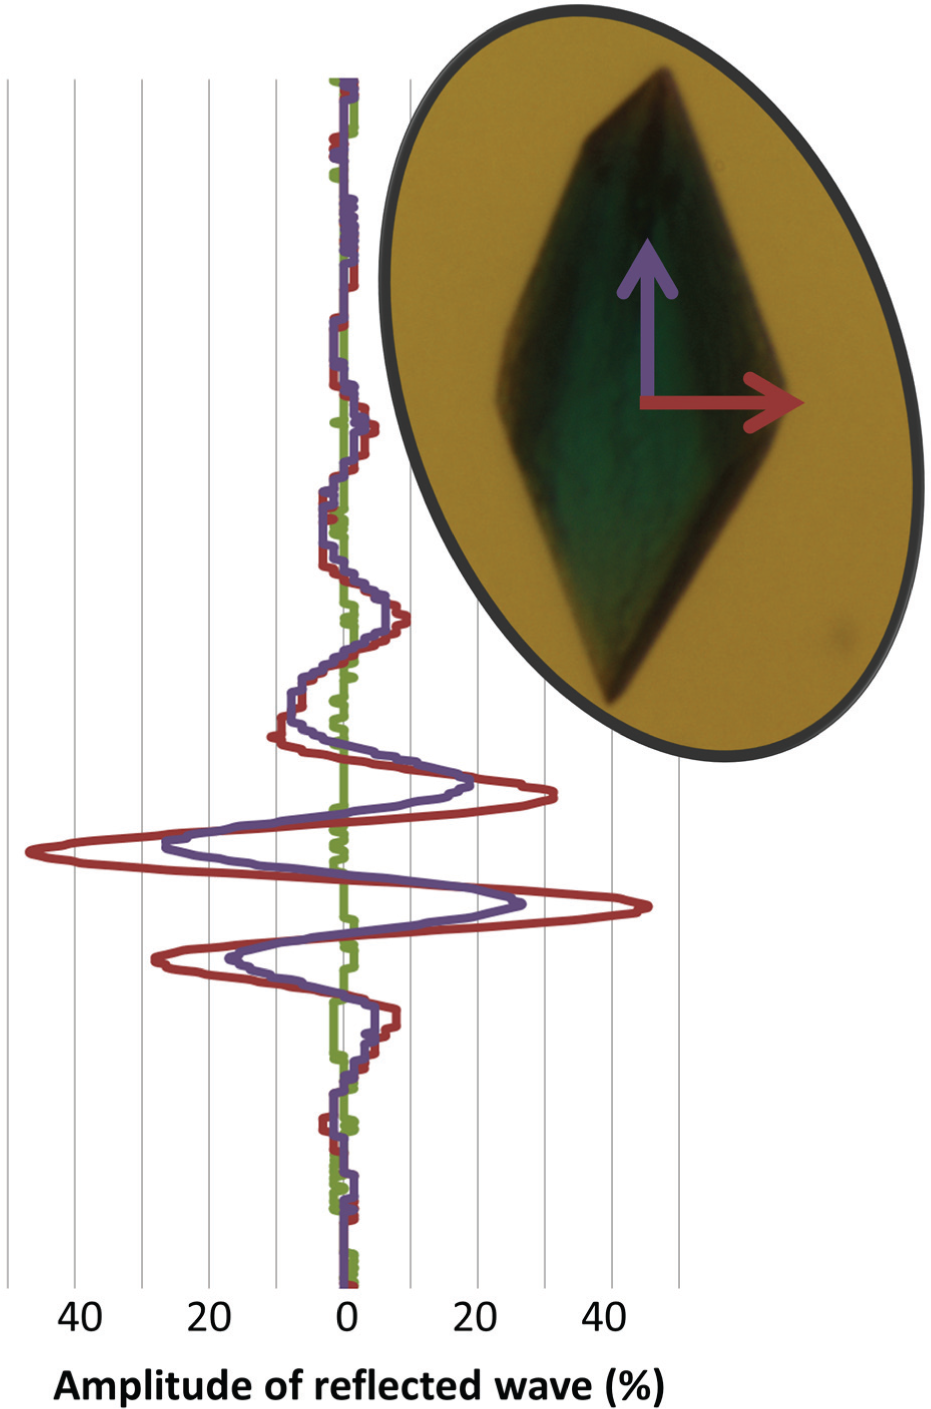
Acoustic detection of a single 200 µm lysozyme crystal (inset) with its long axis perpendicular to the sound pulse (magenta) and parallel to the sound pulse (purple). The crystal was grown separately (so that methylene blue colorant could be added) and manually transferred to the agarose pedestal. The direction of propagation of each sound wave is indicated on the crystal picture (inset). The amplitude of the reflection increases as a function of the surface area of the reflecting object; hence, the perpendicular crystal orientation (“lying flat” on the agarose) yields a higher amplitude response. We did not observe separate reflections from the top and bottom of the crystal. The amplitudes of the reflections from the crystal are shown as a percentage of the amplitude of the reflection from the plate bottom. As a control, the amplitude from the same region of the agarose pedestal is shown before any crystal was deposited on it (green).
Acoustic Monitoring Can Detect Crystals as Small as 200 µm in LCP
Figure 4
illustrates the amplitude of the reflected wave from a single lysozyme crystal (shown in inset) that was pinged inside of a custom LCP sandwich. The custom modification was necessary for two reasons. First, the conventional LCP cover slips contribute noise to the detection ping. Second, the conventional LCP separators are too thin for the reflection caused by the crystal sample to be fully resolved from the reflections caused by the two cover slips (
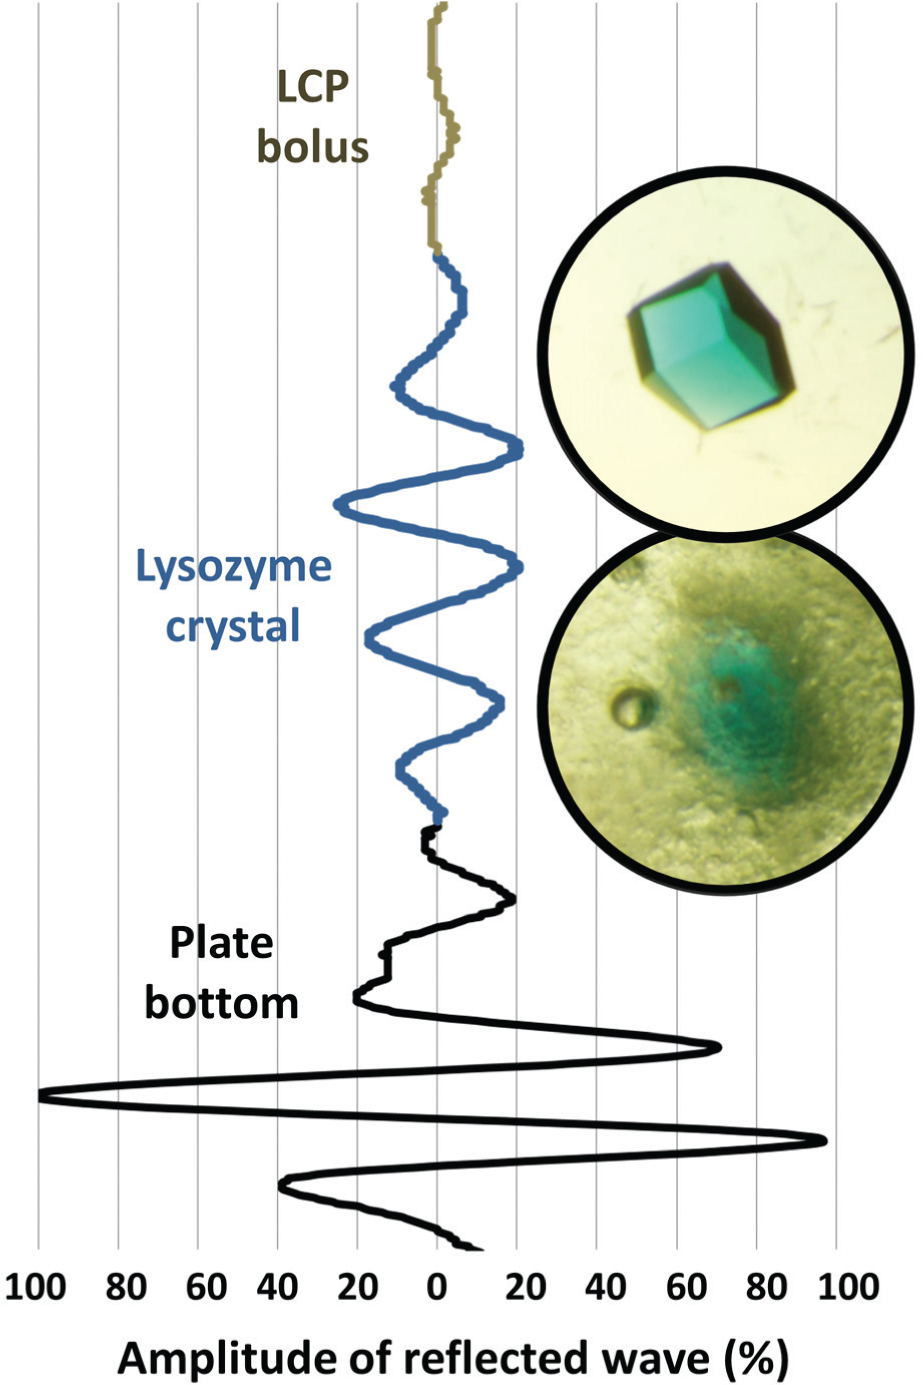
Acoustic detection of a single 200 µm lysozyme crystal suspended in a lipidic cubic phase (LCP) matrix. A 200 µm lysozyme crystal was separately grown and colored with methylene blue (top inset). The crystal was manually inserted into an LCP bolus (bottom inset). The amplitudes of the reflections from the plate bottom (black), from the lysozyme crystal (blue), and from defects in the LCP bolus (gray) are shown as a percentage of the amplitude of the plate bottom. LCP contains embedded spheres of mother liquor that greatly amplify the background noise, making detection of very small crystals difficult. Crystals that were grown directly in the LCP matrix yielded similar acoustic reflection data (see
Growth of a Single Crystal Monitored Using the Crystal Reflection
A single well in a PolyPro plate was used to grow lysozyme crystals, including one large crystal that grew directly in the path of the sonar pulse. The amplitude of the reflection from this large crystal was recorded as a function of time. In Figure 5 , the amplitude of the crystal reflection is plotted on the y axis, the height above the plate is plotted on the z axis (over a range of 500 µm), and the time is plotted on the x axis (for a total of 25 h). The amplitude of the crystal reflection is color coded so that the location of the crystal can be determined by finding the highest peak. Although only 25 h of data are shown in Figure 5 , we continued to monitor the crystal as it grew for several additional days. To verify that the sonar detection process did not degrade the quality of the crystals, we compared diffraction data obtained at CHESS F1 from the two harvested crystals (one control and one that was continuously pinged) and found no significant differences (data not shown).
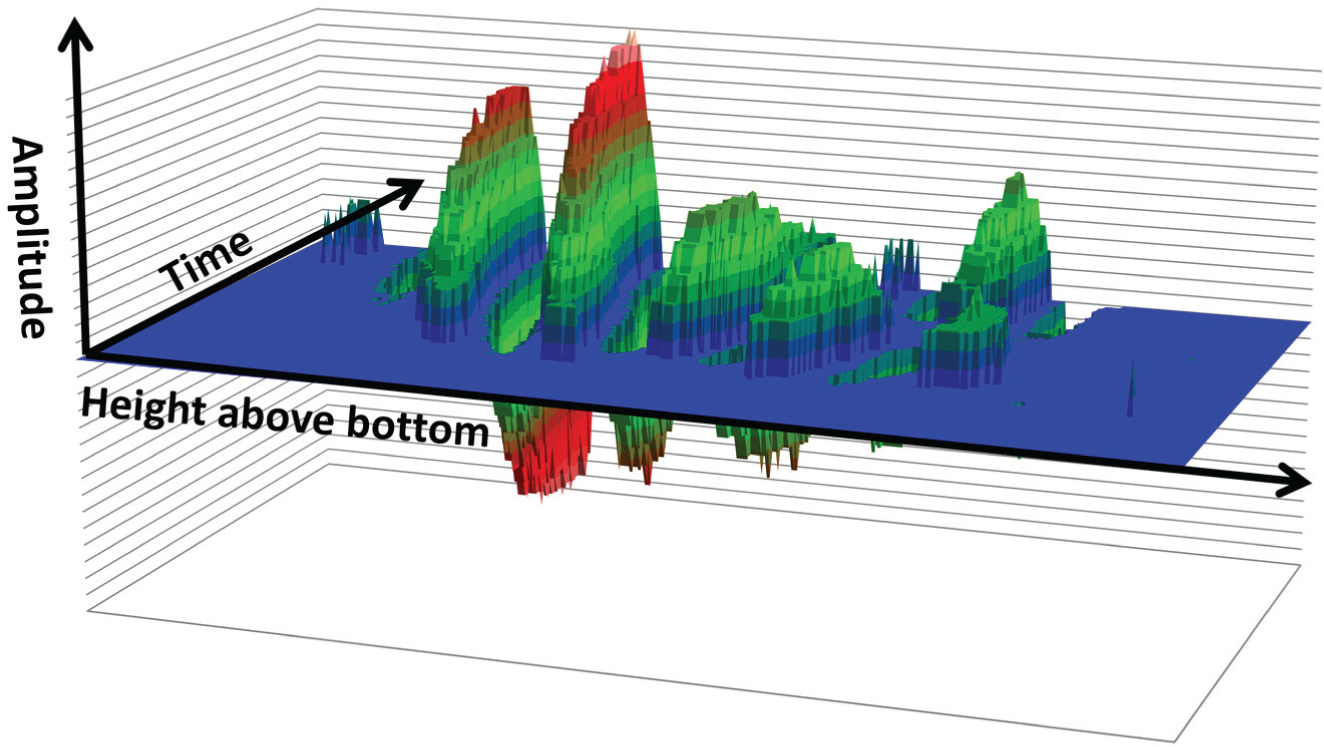
Continuous monitoring of a single large lysozyme crystal grown over time on an agarose pedestal. The amplitude of the reflection from a single growing lysozyme crystal (y axis) increases as the crystal grows over time (z axis, total 25 h). The x axis is the height above the plate bottom. Note that the claimed crystal detection limit (50 µm) is given by the y axis step size, which is also approximately equal to the noise level (as shown in Fig. 2 ). For clarity, all data points that are within the noise level of zero have been set to zero. We define one acoustic reflection as all of the peaks and troughs in a single group of waves.
Growth of All Crystals Monitored Using the Surface Reflection
Transducers are frequently used for object detection, for example in quality assurance applications. For this reason, we began our investigation of transducer applications in crystallography by examining the capability to detect, characterize, and monitor a single protein crystal. To conclude our experiments, we examined the utility of monitoring the amplitude of the surface reflection as a proxy measure of the aggregate scattering from all crystals in the crystallization experiment. The principal advantage of doing this is that a single crystal must grow to a considerable size before it is capable of individually reflecting incoming sound waves to a detectable level. In contrast, even very small crystals may scatter sound waves, thus attenuating the strength of the surface reflection. In addition, the surface reflection is reduced by scattering at all angles (except forward), whereas only the back-scattered component contributes to direct measurement of the crystal echo.
Figure 6
plots the amplitude of the reflection from the surface of the mother liquor in a lysozyme crystallization well as a function of time (circular data points). After the measurement was complete, we visually determined that no crystal grew directly in the sonar path (consequently, changes in the surface reflection must be caused by aggregate scattering from all crystals in the well). There are three clear regimes. At first, there are no protein crystals, and the amplitude of the surface reflection is constant. A least-squares fit to this part of the data (red line) shows an unchanging trend for the amplitude. This is followed by a growth phase when the amplitude of the surface reflection gradually decreases (yellow line). Finally, when crystal growth is complete, the amplitude of the surface reflection is again stable (green line). No crystals were observed in the control experiment that was performed with 2% sodium chloride, and the amplitude of the surface reflection remained close to its starting value (
Fig. 6
, triangular data points). The amplitude of the surface reflection for the protein-free and salt-free blank remained within the noise level of its starting value (see
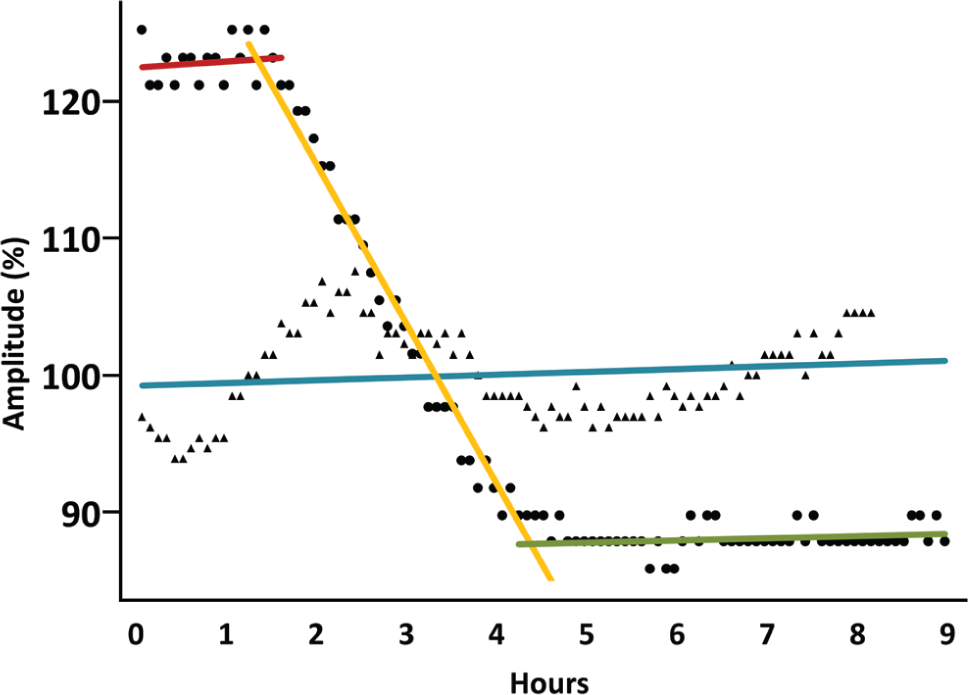
Continuous monitoring of all lysozyme crystals growing over time on a high-salt agarose pedestal (circles, using 6% sodium chloride) and of an identical control specimen with insufficient salt to induce crystallization (triangles, using 2% sodium chloride). Amplitudes have been normalized to have an average value of one. The amplitude of the surface reflection from the liquid/air interface (y axis) is plotted as a function of time (x axis, hours). The aggregate scattering from all objects inside of the sample attenuates the surface reflection; consequently, the amplitude of the surface reflection is a proxy measure of scattering from all crystals in the sample. The amplitude in the low-salt (control) specimen remains close to its starting value because no crystals grew (fitted by blue line). Initially, the surface reflection in the high-salt specimen has constant amplitude (fitted by red line). As crystals begin to grow, the amplitude of the surface reflection decreases (fitted by yellow line). After growth is complete, the surface reflection again has a constant amplitude (fitted by green line).
Discussion
Established crystal detection technologies can locate crystals smaller than 1 µm with high precision. The diffraction limit for a light microscope is approximately 0.2 µm, but the limited contrast between the crystal and its surroundings often makes it difficult to detect crystals smaller than 1 µm. Plate imagers can detect crystals as small as 10 µm in plates or capillaries using tryptophan fluorescence after UV illumination at 280 nm (hence, also differentiating protein crystals from salt crystals).15,16 In favorable cases, crystals as small as 0.1 µm can be detected using second-order optical imaging (SONICC). 10 Rastering with the X-ray beam can also detect micro-crystals. 12 Compared to these established techniques, the ability to use sound waves to detect 50 µm may seem modest. However, transducers with much higher frequencies than the model used in this study are readily available. Using the highest-frequency conventional transducers, it should be possible to detect crystals as small as 3 µm (assuming that the 15-fold frequency increase translates into a 15-fold sensitivity increase). Using newer technology transducers, 8 it should be possible to detect even smaller crystals. Signal averaging could be used to reduce the background noise and further increase sensitivity, albeit at the cost of increased measurement time. Acoustic crystal detection has the advantage that the crystal position is simultaneously determined in all three directions with high precision. In addition, acoustic detection also has the unique advantage that the fluid surface reflection can be used as a proxy estimate for the aggregate scattering from all crystals in the sample.
To be useful, a crystal detection technique should be able to identify crystals that are small and that are located anywhere in the crystal growth region. Acoustic waves generated by a transducer rated to 11.5 MHz detected the presence of a shower of micro-crystals but could not detect the location of any single crystal smaller than ~50 µm. It should be possible to extend this technology so that the location of 3 µm crystals can be determined to ±2 µm with a 300-MHz transducer (2 µm precision is adequate for 5 µm beam data collection), assuming that the detection limits that are published for industrial quality control (1 µm) scale to crystallographic applications in the same way as we observed for the 11.5-MHz transducer (we observed a detection limit half as good as the published limit). The problem of confounding the acoustic return from the crystal with the acoustic return from nearby interfaces (such as plastic and air) will be more difficult to solve. In this application, we used two technical solutions for this problem: growing crystals on pedestals (somewhat contrived) and inserting crystals into LCP (clearly artificial). In the absence of better technical solutions, it is possible that crystals that reside against an interface will have a significant detection penalty. Comparing the ~5 σ signal/noise sonar return in Figure 4 with the ~2 σ signal/noise sonar return from a similar-sized crystal in supplemental Figure 1 , we estimate that the crystal detection limit falls by threefold when the crystal is lying flat against an interface.
Footnotes
Author Contributions
A.S.S. designed the experiment and wrote the article. D.L.E., X.Y., A.S., Y.N.S., and A.S.S. grew crystals, obtained data, and analyzed data. R.S., H.V., and R.E. developed and provided the Echo WellPing software used to generate the sonar data. A.S.S. and R.M.S. trained and supervised student interns.
Declaration of Conflicting Interests
The authors declared no potential conflicts of interest with respect to the research, authorship, and/or publication of this article.
Funding
The authors disclosed receipt of the following financial support for the research, authorship, and/or publication of this article: Personnel for this study were recruited largely through the 2014 summer session of the Science Undergraduate Laboratory Internships Program (SULI), supported through the U.S. Department of Energy, Office of Science, Office of Workforce Development for Teachers and Scientists (WDTS). Major ongoing financial support for acoustic droplet ejection applications was through the Brookhaven National Laboratory/U.S. Department of Energy, Laboratory Directed Research and Development Grant 11-008, and from the Offices of Biological and Environmental Research and of Basic Energy Sciences of the U.S. Department of Energy, and from the National Center for Research Resources (P41RR012408) and the National Institute of General Medical Sciences (P41GM103473) of the National Institutes of Health. Data for this study were measured at the Cornell High Energy Synchrotron Source (CHESS), supported by the National Science Foundation and the National Institutes of Health/National Institute of General Medical Sciences under NSF award DMR-0936384, using the MacCHESS facility, which is supported by award GM-103485 from the National Institute of General Medical Sciences.
References
Supplementary Material
Please find the following supplemental material available below.
For Open Access articles published under a Creative Commons License, all supplemental material carries the same license as the article it is associated with.
For non-Open Access articles published, all supplemental material carries a non-exclusive license, and permission requests for re-use of supplemental material or any part of supplemental material shall be sent directly to the copyright owner as specified in the copyright notice associated with the article.