
Abstract
Autoverification is a process of using computer-based rules to verify clinical laboratory test results without manual review. But to date, there are few published articles on the use of autoverification over the course of years in a clinical laboratory. In our study, we firstly described the development and implementation of autoverification rules for enzyme-linked immunosorbent assay (ELISA) results of hepatitis B virus (HBV) serological markers in a clinical immunology laboratory. We designed the autoverification rules for HBV by using Boolean logic on five clinically used serological markers in accordance with the framework of AUTO-10A, issued by the American Clinical Laboratory Standards Institute in 2006. The rules were written into the laboratory information system (LIS) and installed in the computer, so we could use the LIS to screen the test results. If the results passed the autoverification rules, they could be sent to doctors immediately. To evaluate the autoverification rules, we applied the real-time data of 11,585 patients with the autoverification rules. The autoverification rate of the five HBV serological markers was 79.5%. Furthermore, the turnaround time (TAT) was reduced by 38% (78 minutes vs. 126 minutes). The error rate was nearly eliminated. These results show that using LIS with autoverification rules can shorten TAT, enhance efficiency, and reduce manual review errors.
Keywords
Introduction
Hepatitis B is an infectious disease caused by the hepatitis B virus (HBV). Hepatitis B involves inflammatory lesions, mainly in the liver, and it may cause multiple organ damage, liver cirrhosis, and hepatocellular carcinoma (HCC). It is estimated that there are more than 2 billion HBV-infected individuals worldwide, of which 360 million are infected chronically. A national seroepidemiological survey of hepatitis B in 2006 showed that the HBV surface antigen (HBsAg)-positive rate was nearly 7.18% among 1–59-year-olds in China,1,2 presenting a prominent challenge. Despite the rapid development of science and technology, clinical laboratories still face a shortage of human resources due to the increasing workload. Although the automation of clinical testing has improved, human intervention is still required in the postanalytical phase of tests, especially for verification. 3 Unfortunately, research concerning autoverification in the clinical laboratory is still rare. 4 The manual verification of reports not only is a time-consuming activity but also can be affected by subjective and arbitrary reasoning, which can differ depending on laboratory personnel configuration and staff education levels, despite interaction with various professional fields of medical science. 5 As a result, clinical laboratory physicians may make mistakes when verifying test reports, and the reports’ turnaround times (TATs) are severely restricted. 6 An increasing number of samples for hepatitis B serological testing are sent to the clinical laboratory, so we need to make improvements in the verification section to achieve high-quality, high-efficiency, and highly automated laboratory development goals. AUTO-10A (Autoverification of Clinical Laboratory Test Result Approved Guideline) was issued by the American Clinical Laboratory Standards Institute (CLSI) in 2006. 7 This guideline provides a basic framework to allow each laboratory to design, implement, validate, and customize specific rules for autoverification in an easier way based on the needs of the laboratory, patient, and clinicians. Autoverification is described as a means to gain efficiency, reduce cost, and increase productivity, in addition to being a means to assure detecting quality. 8 Thus, laboratory technicians can focus on a small part of the potentially problematic samples after making use of autoverification rules. 9 Currently, laboratories worldwide are exploring and implementing autoverification 9 in many fields such as clinical chemistry analysis,4,6,10,11 urine analysis,12,13 clinical hematology tests,14,15 and coagulation.11,16 Although there is a nearly 20-year history of autoverification systems and the existence of these guidelines, there is still a lack of standardization mainly in the algorithms, the criteria used, and the verification limits applied. 10 Most researchers focus on praising the advantages of autoverification, but it has remained unclear how to build autoverification rules and parameters.8,11 The chemiluminescent microparticle immunoassay (CMIA)17–19 represents the most advanced technology of detecting hepatitis B markers. 20 Furthermore, time-resolved fluoroimmunoassay (TRFIA) delivered higher sensitivity and broader antigen and antibody concentration detection ranges. 21 However, the new generation of enzyme-linked immunosorbent assays (ELISAs) is still widely used in clinical laboratories,22,23 especially in developing countries, because they can quickly analyze a large number of samples, and the price is less expensive. There was little published literature on the use of autoverification in the ELISA results of HBV serological markers for years. In this study, we designed the autoverification rules for ELISA results of five HBV serological markers by using Boolean logic in accordance with the framework of AUTO-10A, and we measured the TAT, autoverification rate, and manual review errors. We found that the use of laboratory information system (LIS) with autoverification rules can shorten TAT, enhance efficiency, and reduce manual review errors.
Materials and Methods
Testing Instruments
HAMILTON Microlab Star LET and HAMILTON FAME 16120 (Switzerland)
Abbott ARCHITECT 2000i SR (USA)
ANYTEST 2000 (SYM-BIO Lifescience Co., Ltd., Shanghai, China)
Detection Reagents and Methods
The hepatitis B reagents were provided by InTec (Xiamen) Technology Co., Ltd.
Standard serum was provided by Beijing Controls & Standards Biotechnology Co., Ltd.
Standard serum concentrations are as follows:
HBsAg (Hepatitis B Surface Antigen): 1IU/ml
HBsAb (Hepatitis B Surface Antibody): 10MIU/ml
HBeAg (Hepatitis B e Antigen): 2Ncu/ml
HBeAb (Hepatitis B e Antibody): 4Ncu/ml
HBcAb (Hepatitis B Core Antibody): 0.5IU/ml
TRFIA reagents provided by SYM-BIO (Suzhou) Lifescience Co., Ltd.
CMIA reagents provided by Abbott Laboratories.
Software: Hang Zhou (China) Venture HIS (Hospital Information System) and LIS Systems; and
SPSS statistical package, version 13.0 (SPSS Inc., Chicago, IL, USA).
Statistical Analysis
Analysis of the data was performed with the statistics software package SPSS, ver. 13.0. P < 0.05 was considered significant.
Methods
We designed autoverification rules with Boolean logic and according to the guidelines of “Design of Algorithms” in the Auto-10A document. After that, we formulated and validated the rules in the LIS with clinical samples. The details are shown in the flowchart. The flowchart shows that the processes of autoverification rules consist of instrument error flags, negative and positive controls, quality controls (QCs), gray zones, pattern rules, and delta checks ( Fig. 1 ).
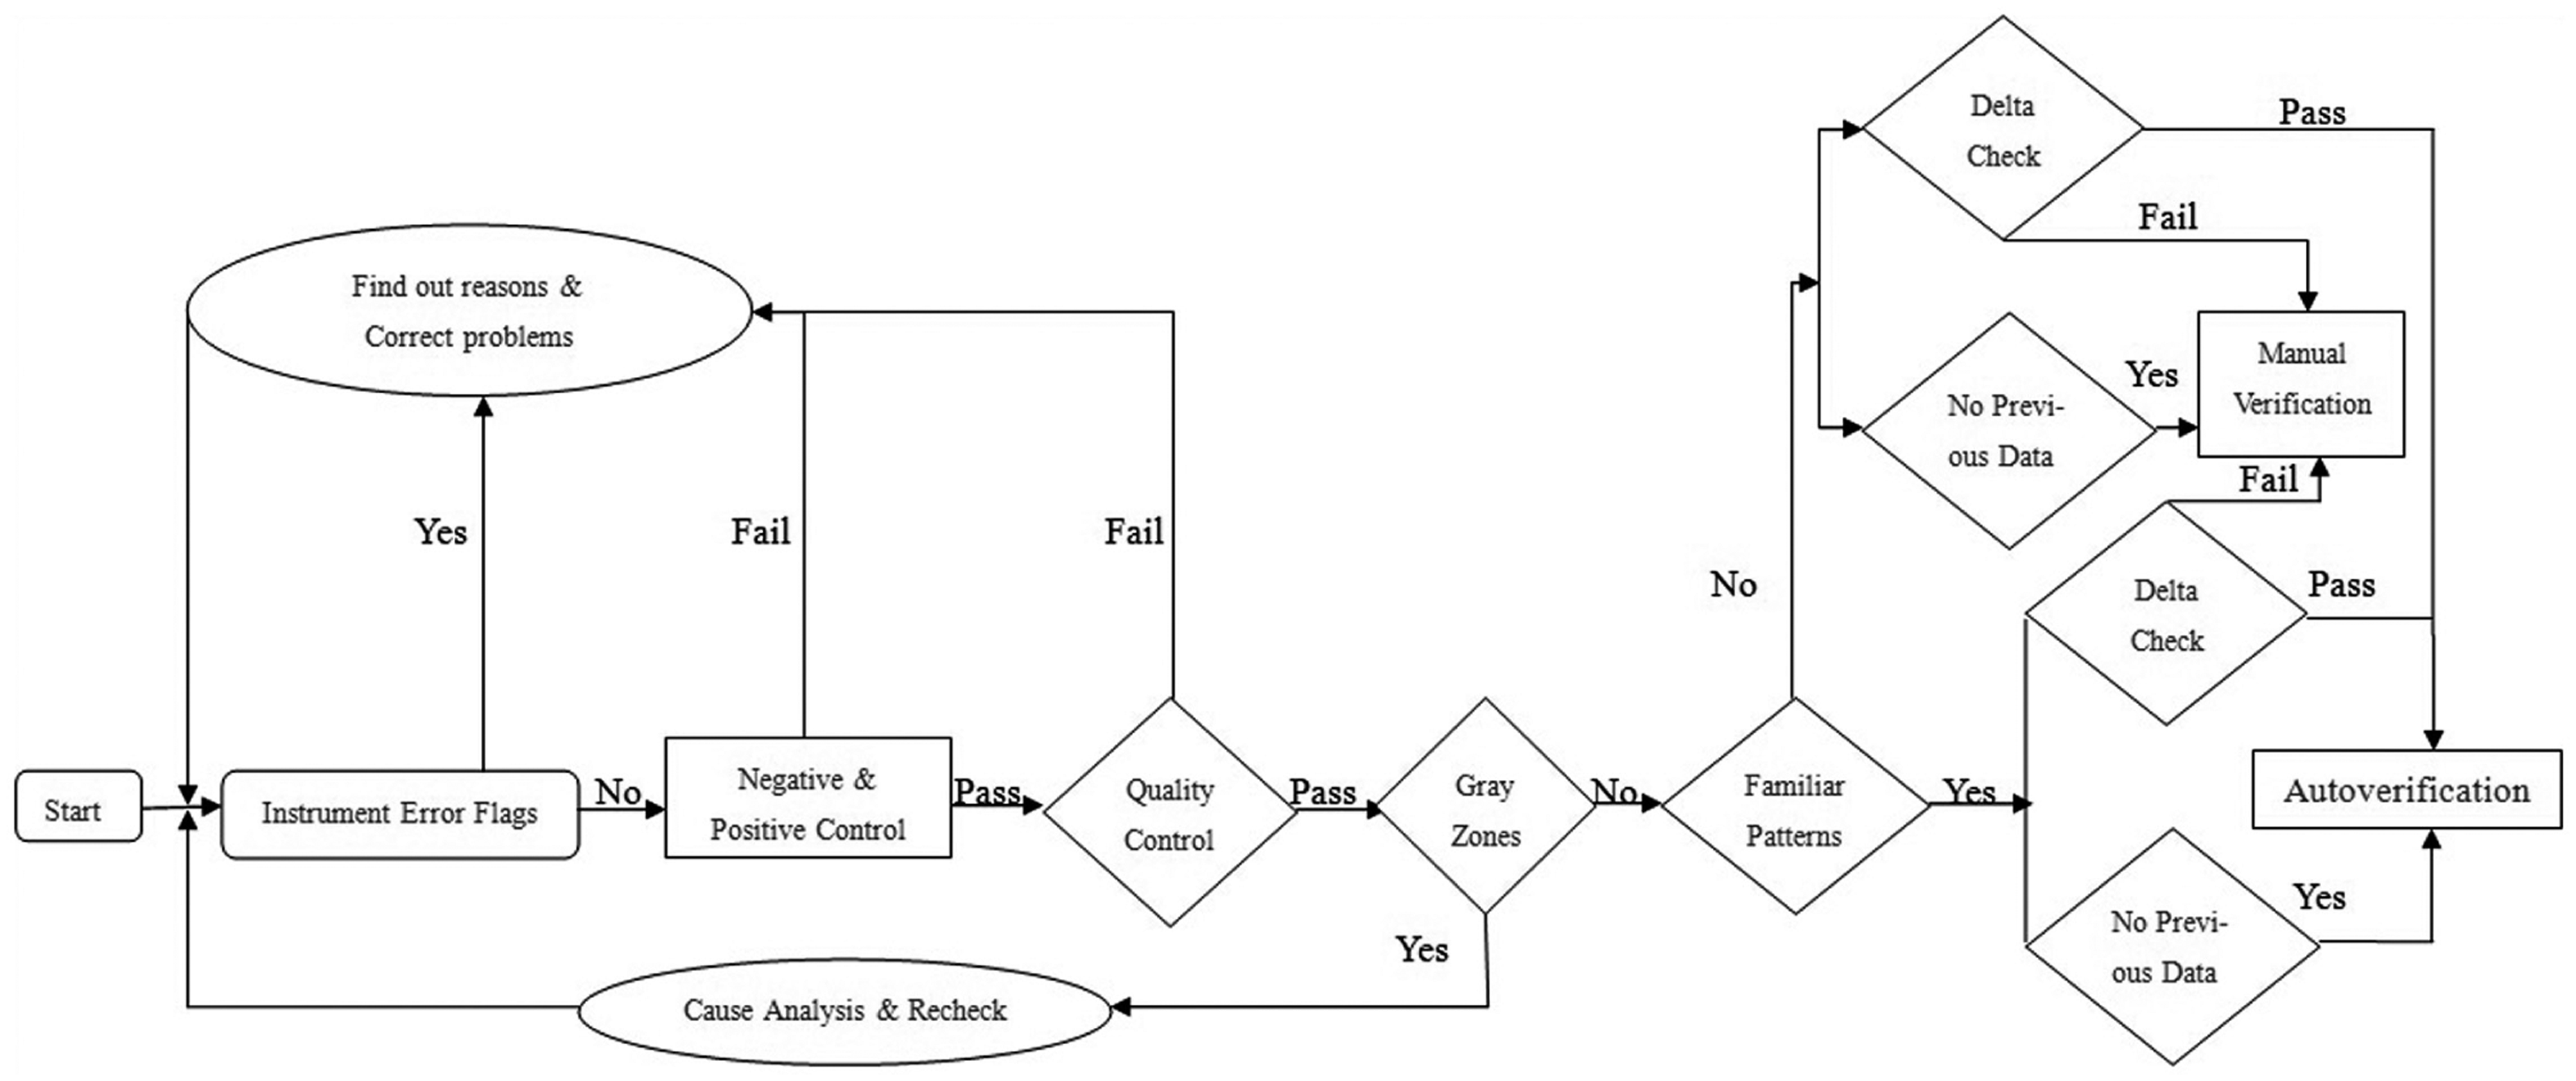
Flowchart of autoverification rules. Test results are verified based on the order shown in the flowchart. It consists of instrument error flags, negative and positive controls, quality controls, gray zones, pattern rules, and delta checks. The results that fail in one rule cannot pass the autoverification and only can be verified manually.
Instrument Error Flags
The instrument will give messages when there are problems with reagents or samples and mechanical failure. For example, reagent crystallization and sample clotting exist. Once the alarm sounds, the investigator will find out the reasons for this, correct the problems as soon as possible, then restart the process.
Negative and Positive Controls
According to the directions of the kits, the double-antibody sandwich ELISA was used in detecting HBsAg, HBsAb, and HBeAg, and the competitive ELISA used in detecting HBeAb and HBcAb. In addition, the instructions required that the optical density (OD) value of the negative control serum for the first three items must be ≤0.1, and the OD value of the positive control serum must be >0.4. However, the negative control serum OD values for HBeAb and HBcAb should never be <0.4.
Quality Control (QC)
To guarantee whether the concentrations of each batch of standard serum are to the same the specifications, we randomly selected a portion of the serum to be tested by the Abbott ARCHITECT 2000i SR and ANYTEST 2000. HBsAg and HBsAb were tested by the Abbott ARCHITECT 2000i SR. HBeAg, HBeAb, and HBcAb were detected by the ANYTEST 2000. The results of the ANYTEST 2000 were converted by an application for contrasting with the specifications. We detected 20 copies of each item. The statistical results are shown in Table 1 .
The SPSS Statistical Results of Quality Control Serum.
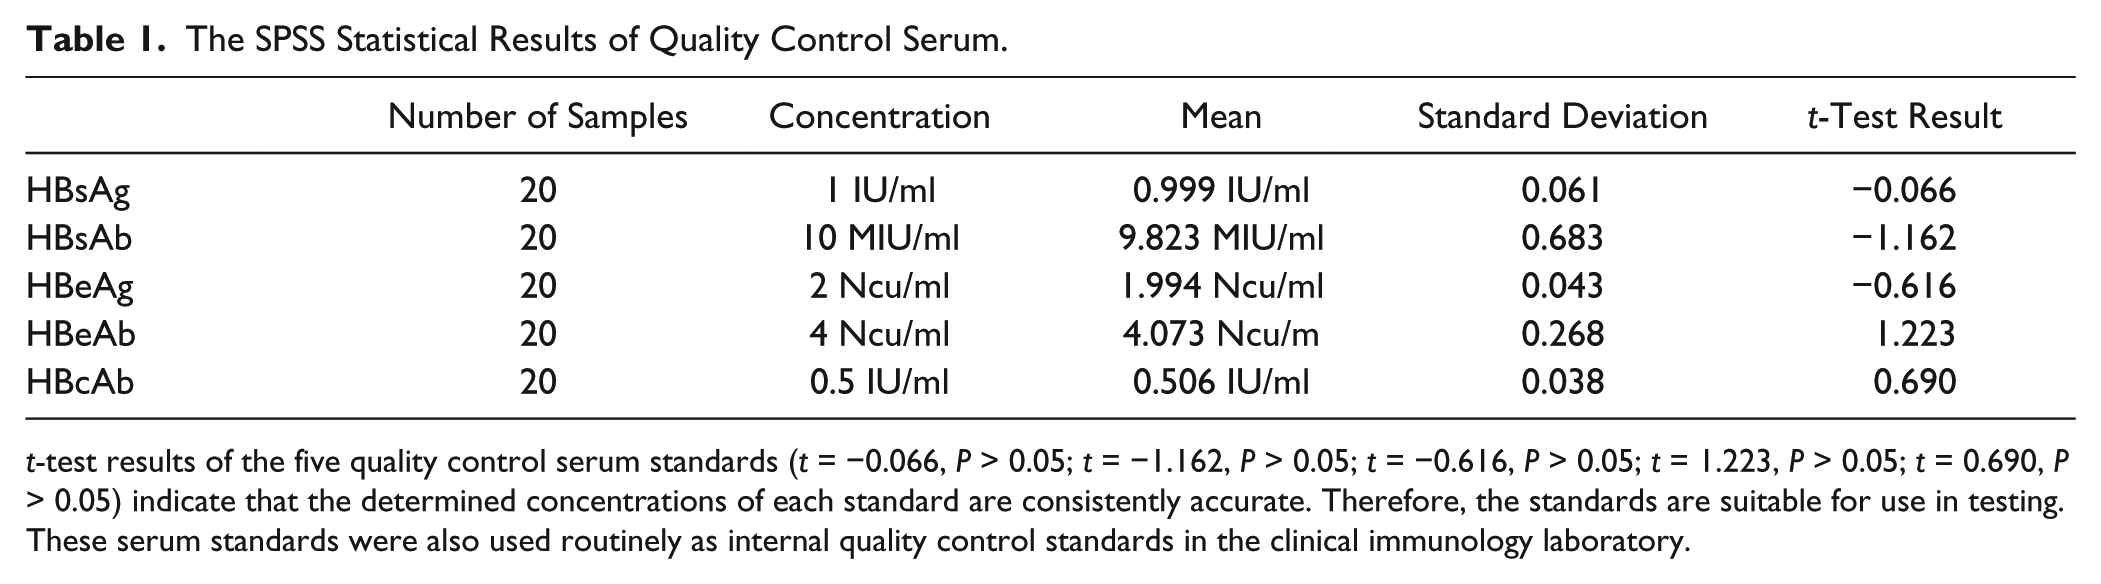
t-test results of the five quality control serum standards (t = −0.066, P > 0.05; t = −1.162, P > 0.05; t = −0.616, P > 0.05; t = 1.223, P > 0.05; t = 0.690, P > 0.05) indicate that the determined concentrations of each standard are consistently accurate. Therefore, the standards are suitable for use in testing. These serum standards were also used routinely as internal quality control standards in the clinical immunology laboratory.
We collected 20 results of standard serum from July 1 to July 20, 2014, and analyzed each by S/CO value (S: the original specimen OD value; CO: cutoff value, which was used to determine positive or negative). Our hospital is a regional general tertiary care academic medical center and university-affiliated hospital with 67 clinical departments and 1668 beds. The clinical laboratory routinely uses internal QC and external QC standards. We used the standard serum as a weak-positive QC serum in our laboratory. The entire operation process strictly followed standard operation procedure (SOP). We examined each batch of standard serum continuously for 20 days. The method we used was the two-hole method, and the average of the original S/CO values was used for statistical analysis. 24 In other words, we used the S/CO value as a statistical parameter for assessing QC in this article. Data analysis was performed using the statistics software package SPSS, version 13.0. The results are shown in Table 2 .
Daily QC Results for HBV Markers.
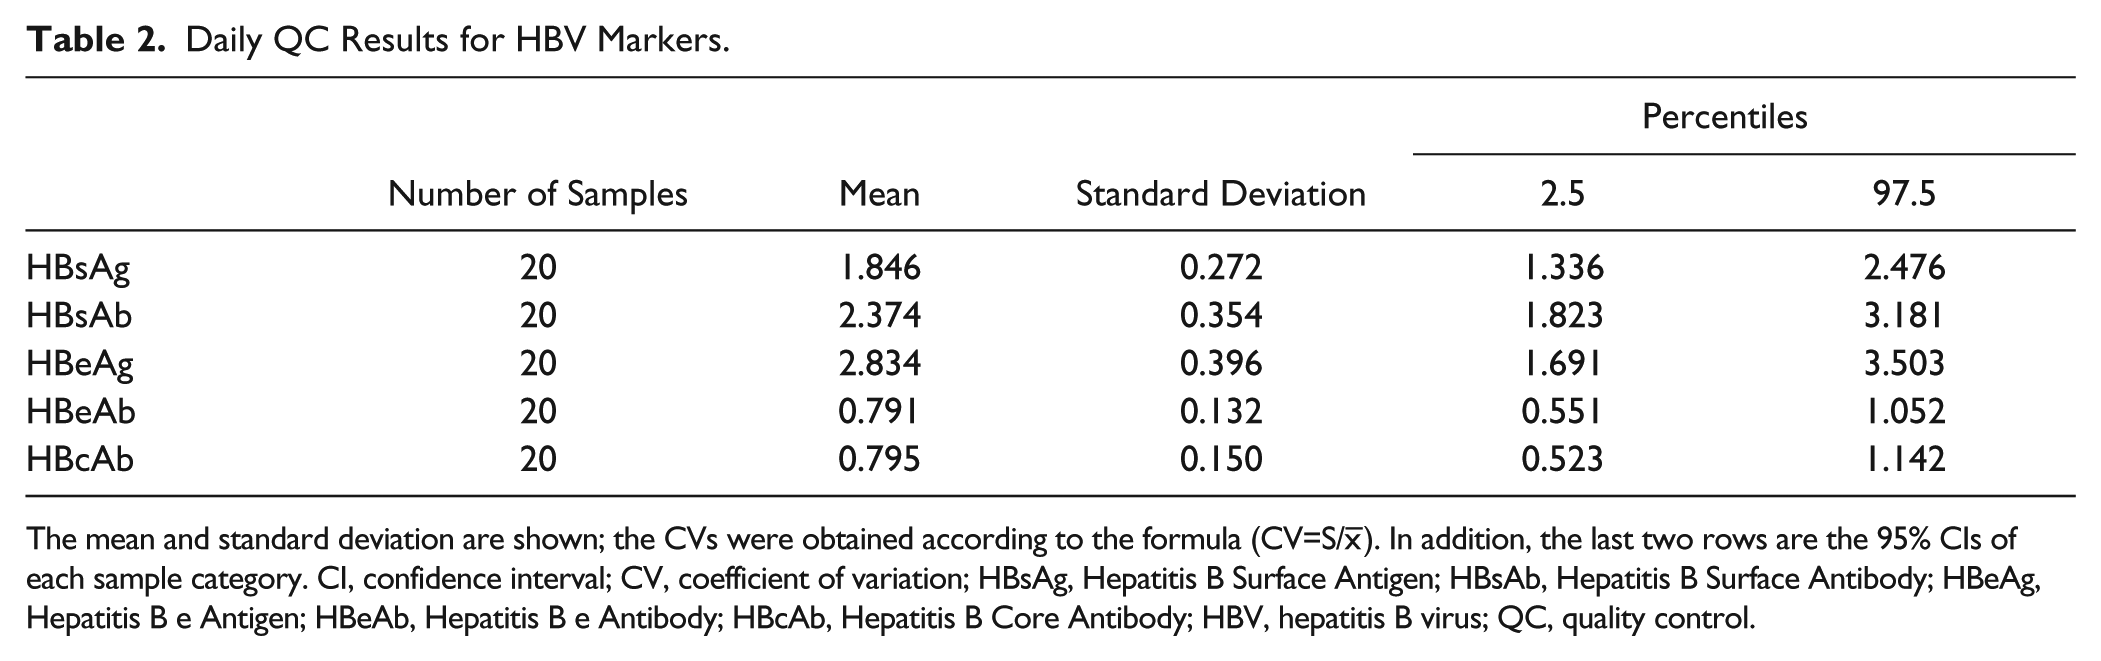
The mean and standard deviation are shown; the CVs were obtained according to the formula (CV=S/
The Levey–Jennings control chart
25
and Westgard QC multirules
26
are widely used for supervising test quality in clinical laboratories.
27
We developed six QC rules in total, which contained 12S, 13S, 22S, R4s, 41s, and 10
Gray Zones
The test results in “gray zones” meant that they were uncertain and could not be automatically verified. We rechecked the results, even by using HBV confirmation assays. We determined the gray zones by two methods.
Two Groups of Gray Zones Determined by Two Methods.
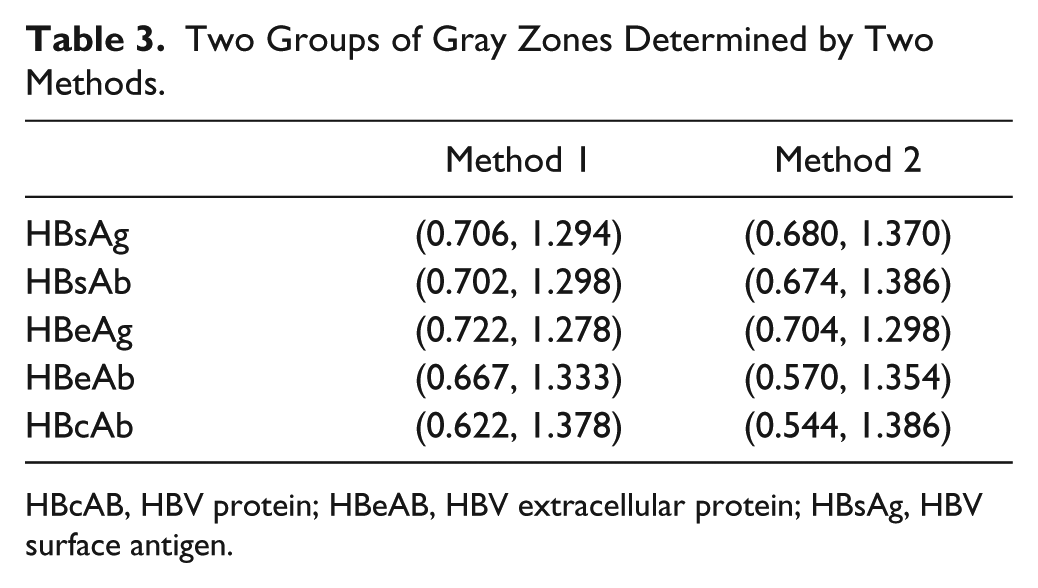
HBcAB, HBV protein; HBeAB, HBV extracellular protein; HBsAg, HBV surface antigen.
Evaluation of the Two Groups of Gray Zones
Between January 2014 and July 2014, a total of 22,926 patients (including inpatient and outpatient) underwent testing for HBV serological markers. All of the samples were tested for five HBV serological markers (HBsAg, HBeAg, HBsAb, HBeAb, and HBcAb), using ELISA kits from the same company (InTec Technology Co., Ltd., Xiamen, China). Theoretically, if the gray zones are too broad, the abnormal results that should be rejected by computer may be released, which increases the probability of error detection. If the gray zones are too narrow, normal results are also rejected by the computer, which decreases the efficiency of autoverification. Therefore, the gray zones are very important. To determine the most feasible gray zones, 22,926 preoperative patient results were collected for evaluation ( Table 4 ). According to the results in Table 2 , to achieve a reasonable automatic passing rate (the broad gray zone ranges result in a low automatic passing rate, and the narrow gray ranges result in a high automatic passing rate and accuracy), we chose the gray zones determined by the ROC curve.
Evaluation of the Two Groups of Gray Zones.
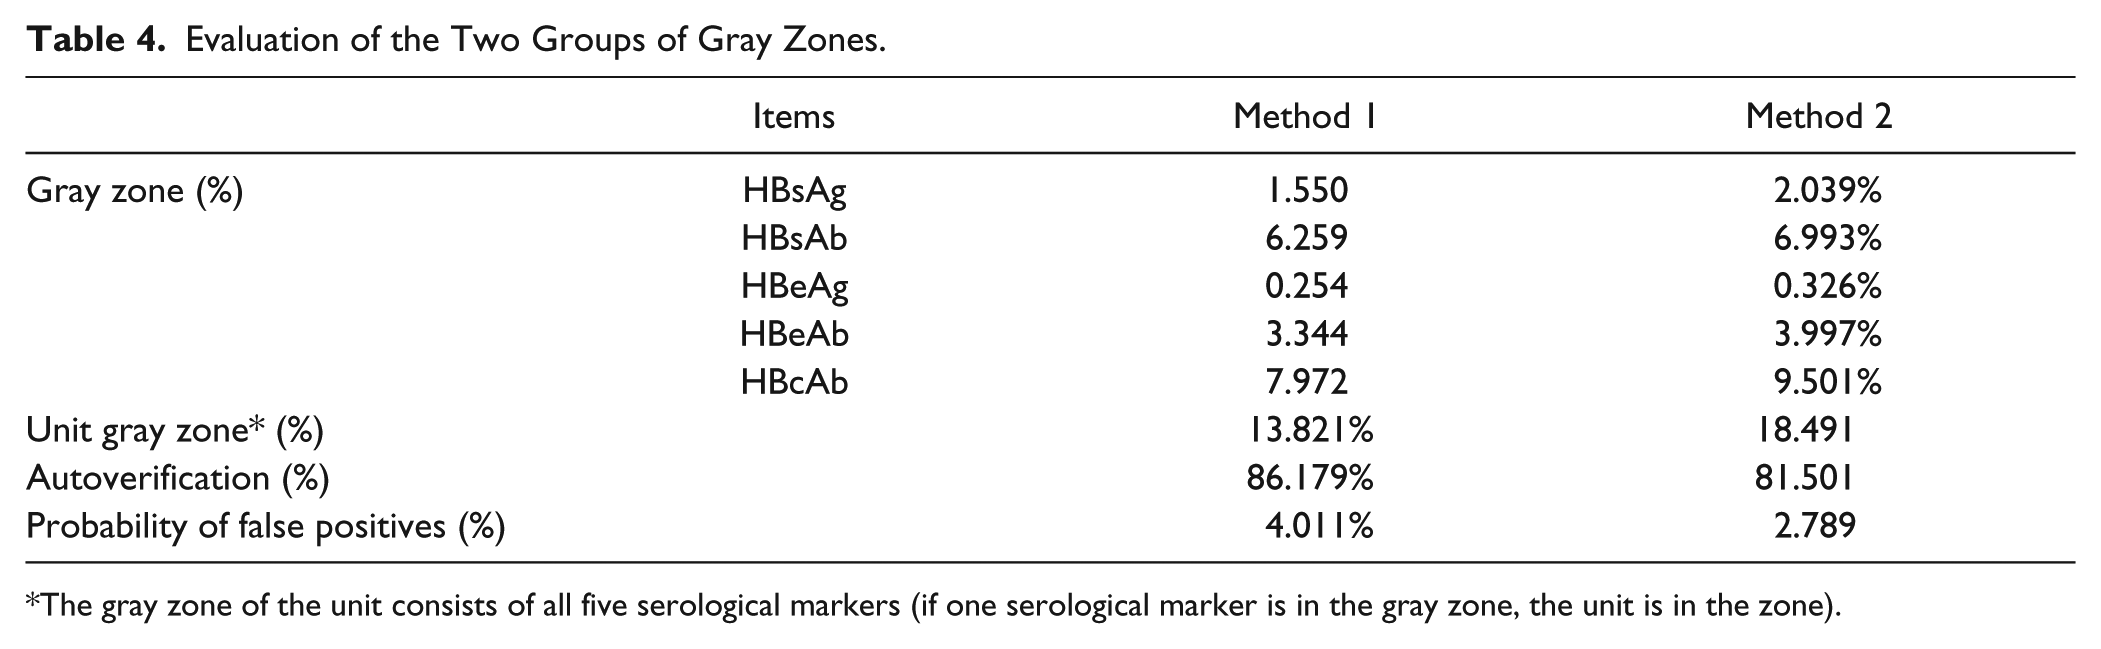
The gray zone of the unit consists of all five serological markers (if one serological marker is in the gray zone, the unit is in the zone).
Patterns of HBV Serological Markers
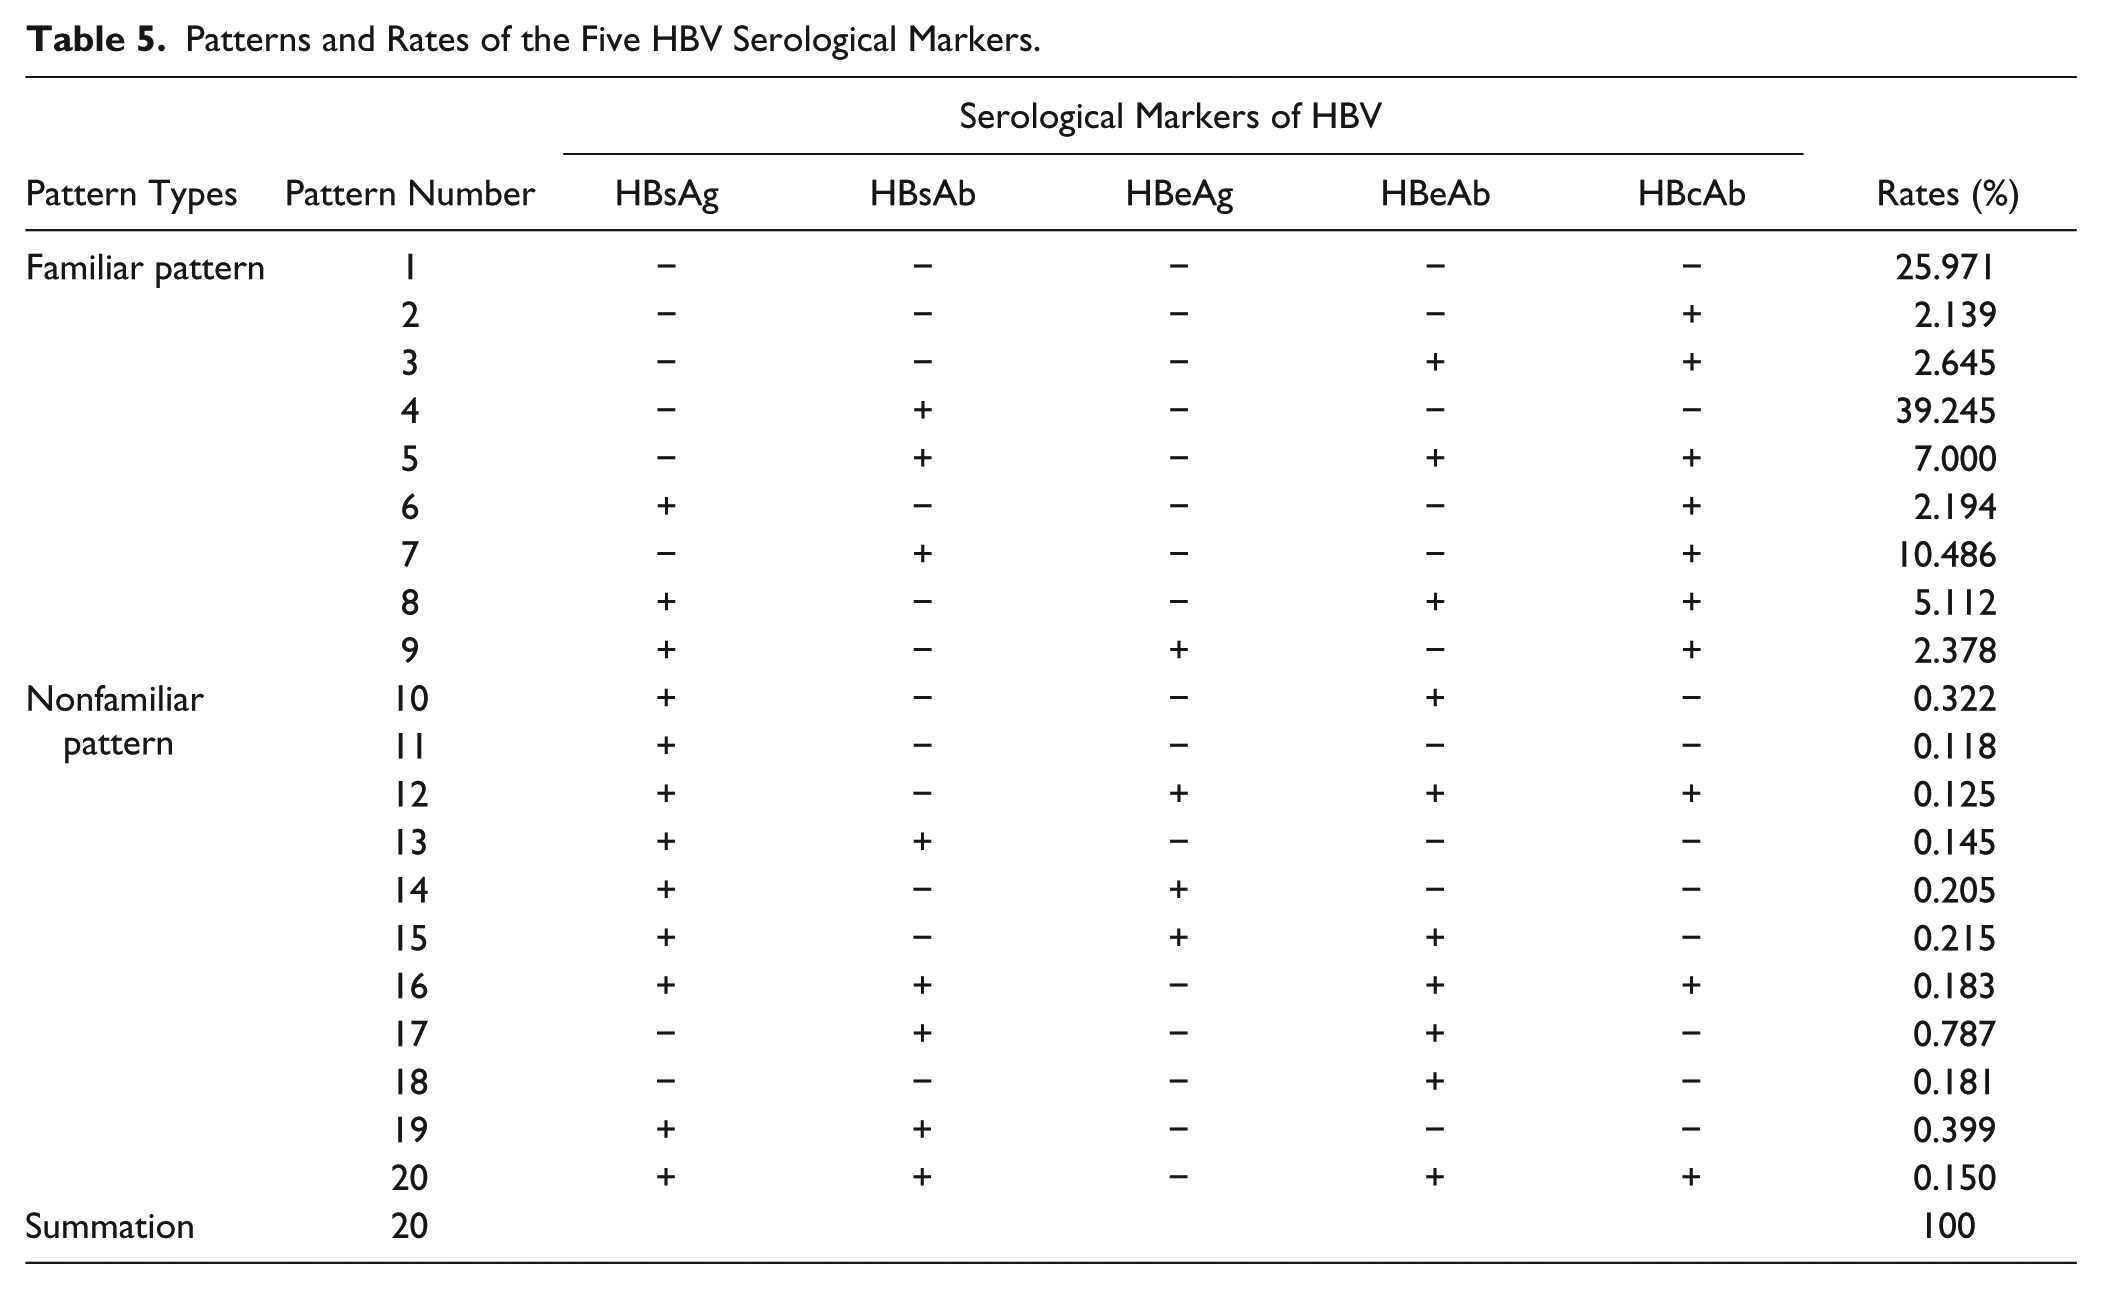
Using an S/CO value = 1.00 as the cutoff value, which was recommended by the manufacturers, in terms of HBsAg, HBsAb, and HBeAg, an S/CO≥1 means positive, and the opposite is negative. For HBeAb and HBcAb, S/CO≤1 indicates positive, and the contrary is negative. The CO for HBsAg, HBsAb, and HBeAg was 2.1 times the OD value of the average negative control, and it was 0.2 times for HBeAb and HBcAb. When the results were beyond the gray zones, then positivity and negativity were confirmed by the rule and the results were judged by mode rules. So we need to determine which are the familiar patterns or nonfamiliar patterns. On the basis of statistics in our department in the past five years, we summarized the modes and rates of five HBV serological markers ( Table 5 ).
Patterns and Rates of the Five HBV Serological Markers.
Delta Check
The delta check is for comparison of a patient’s current test results with his or her previous results to identify the differences.33–36 We could observe test result changes exceeding the expected variation, as well as changes in a patient’s state and specimen mix-up errors, by delta check algorithms.37–39 So the test results that have previous values must be analyzed using a delta check. Parameters previously used have been the cumulative incremental weighted index,40–43 delta difference, rate difference, rate percent change, and delta percent change.44,45 In this article, we determined the time interval as less than 100 days, based on discussions on hepatitis B staging 43 and window phase 46 with physicians in the Department of Infectious Diseases. In addition, we suggest that if the mode of five HBV serological markers was the same as the previous within 100 days, the result can pass the delta check.
Autoverification rules are usually accomplished through middleware in foreign countries,47–49 but in China, the most widely used software in hospitals is the LIS. The rules were written by computer language with reference to the literature; 50 results that could pass the autoverification rules were marked in green, and the failed ones in red, in the computer to achieve autoverification in the LIS. Most importantly, the results that passed all the autoverification rules could be sent to the hospital information system (HIS) directly.
Results
According to the CLSI Auto10-A Guideline, 7 autoverification rules must be validated using actual patient results before startup. To confirm whether the autoverification rules are feasible, we established the rules in the LIS and collected patients’ test results from August 1 to October 31 to use for validation. The validation was manipulated by a senior technician in the Clinical Immunology Laboratory and a physician. Results were verified in triplicate ( Table 6 ).
Passing Rates of Whole Items.
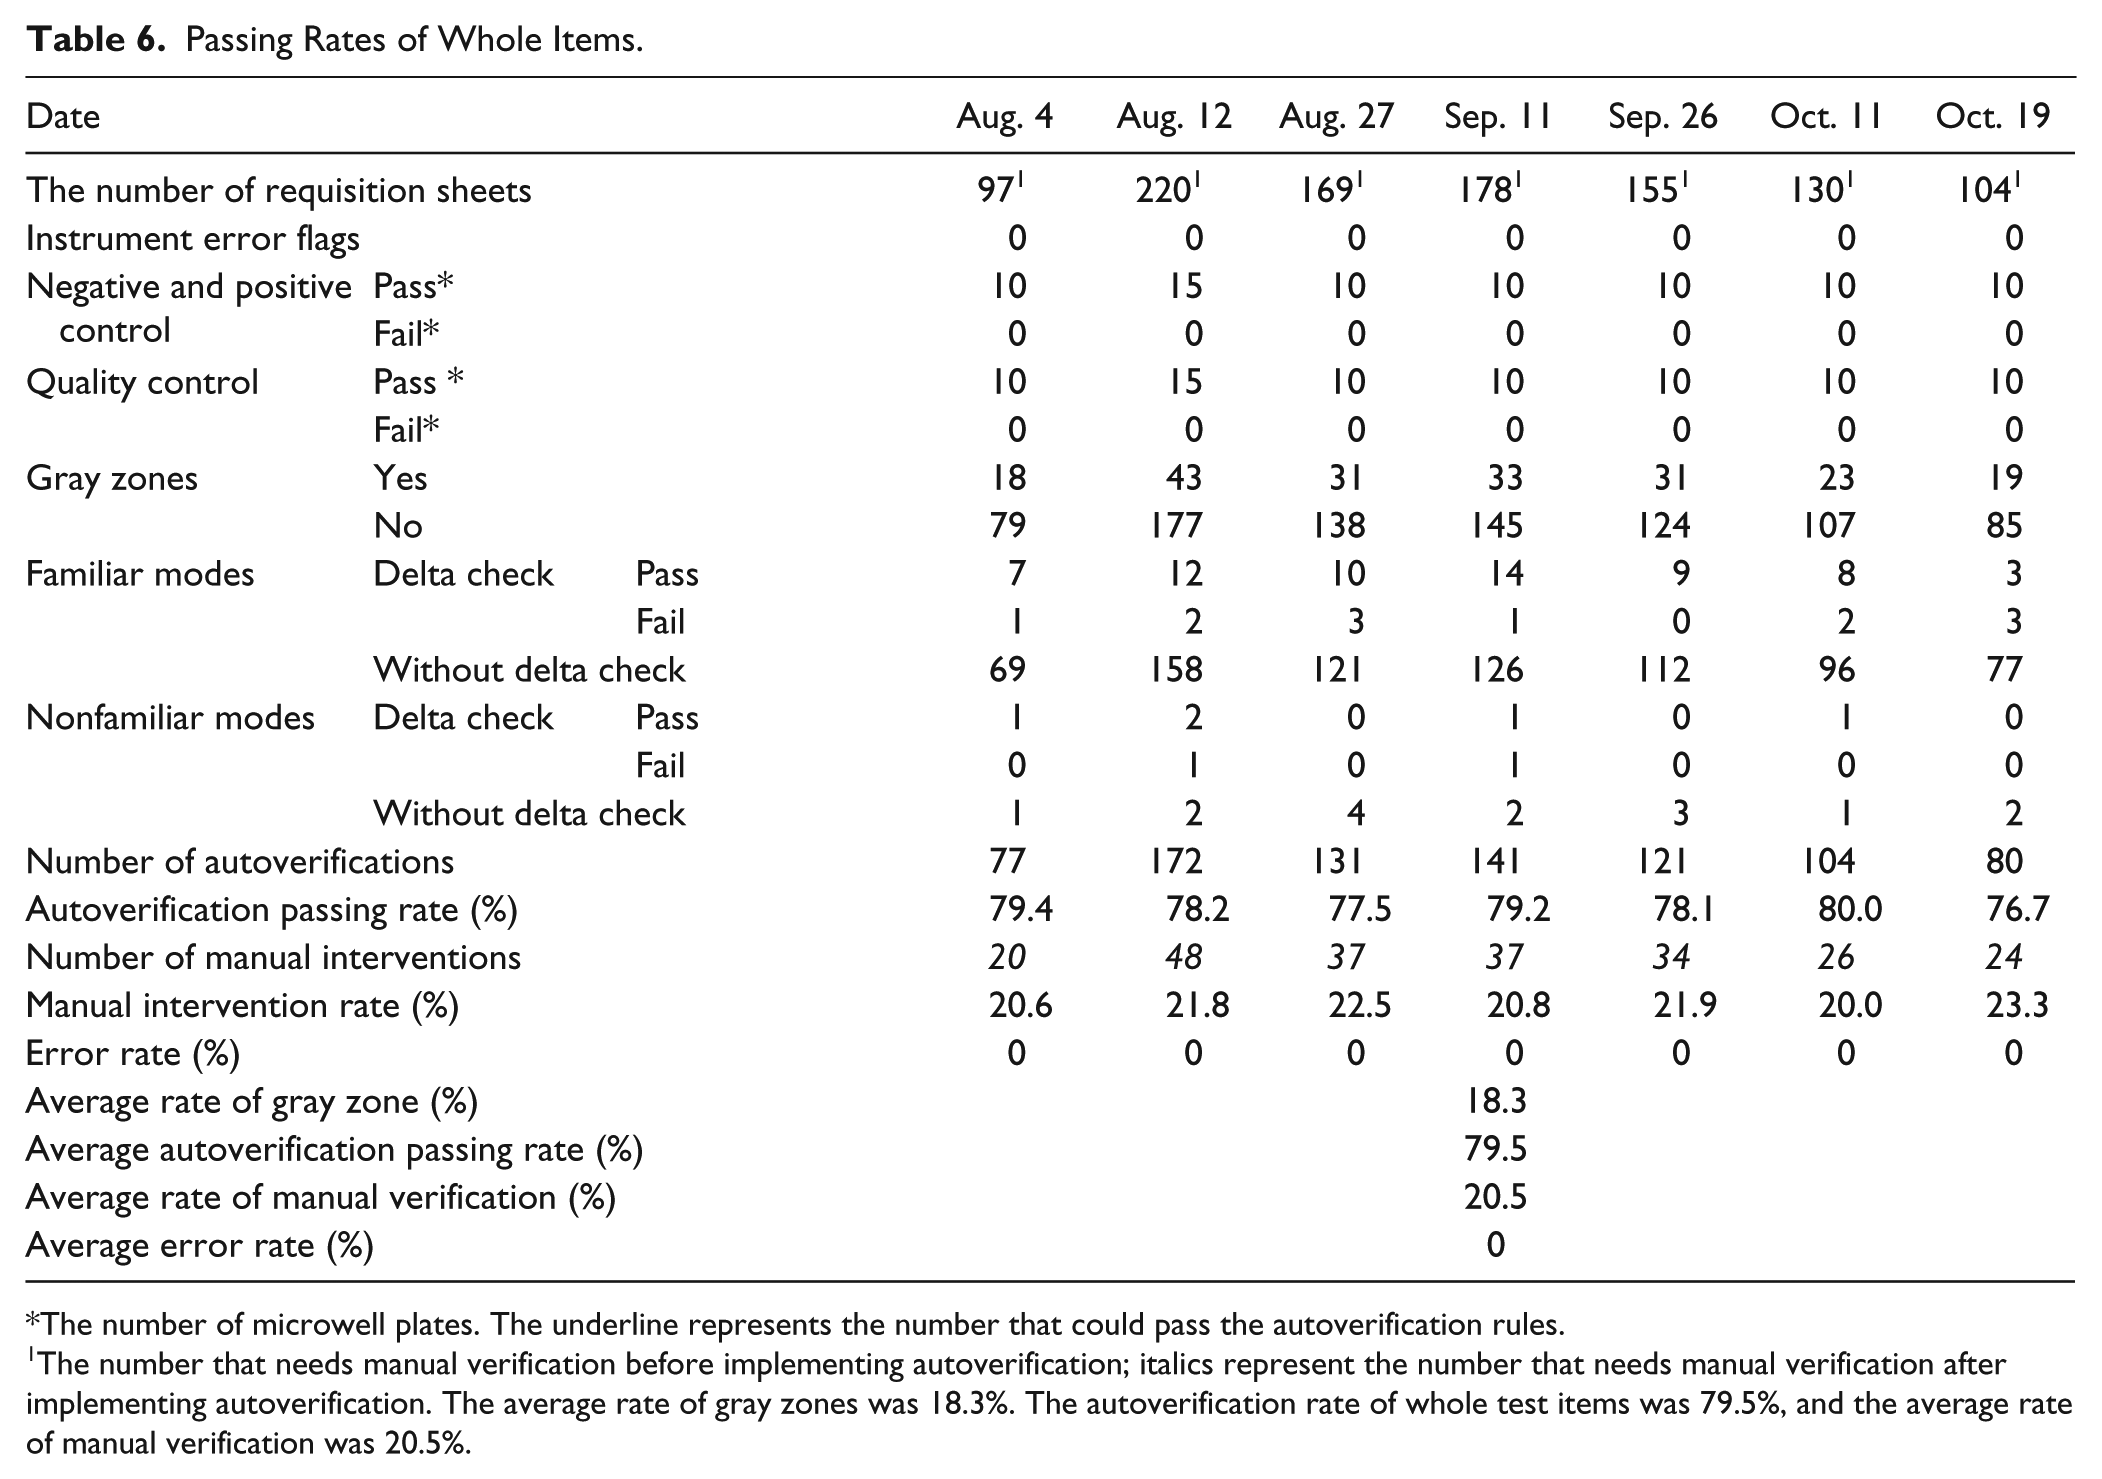
The number of microwell plates. The underline represents the number that could pass the autoverification rules.
The number that needs manual verification before implementing autoverification; italics represent the number that needs manual verification after implementing autoverification. The average rate of gray zones was 18.3%. The autoverification rate of whole test items was 79.5%, and the average rate of manual verification was 20.5%.
This study was implemented on the basis that every factor was considered, including kits, factors of specimens, instruments, standard serums, and the correlation of HBV serological markers. Instrument flags did not appear while we were validating the autoverification rules. OD values of the negative and positive controls were all in the permissible range. Above all, the quality control results were satisfactory, as judged by the Levey–Jennings quality control chart25,27 and using Westgard multirules.26,28,29 The results of validation are as follows:
The average rate of gray zones was 18.3%.
The autoverification rate of whole test items was 79.5%, and the average rate of manual verification was 20.5%.
The average error rate was nearly zero.
Evaluation of the Benefits
We used the TAT (the time the specimen was received to the time the results were released) and the probability of human review error to evaluate the advantages after implementing autoverification for the three months from August 1 to October 31. After implementing autoverification, the number of specimens in need of manual verification decreased by 79.524% (from 220 to 48, as shown in Table 6 ), and the TAT was reduced by 38.005% (from 126 minutes to 78 minutes), consistent with several publications describing the autoverification rules as a way to shorten TAT in reporting test results and thus reduce the labor burden in the laboratory. 9 However, our results suggest an added advantage of enhanced consistency of the test results compared to verifications performed by different medical technologists. All of the test results were analyzed by autoverification rules based on the same standards and treated in the same manner, thus ensuring the veracity of the reports. During the three months before implementation, an average of approximately 0–4 results showed verified human errors per day. Inversely, after implementing the autoverification rules, errors were nearly eliminated.
Discussion
In China, HBV infection poses a particularly prominent challenge, requiring testing of large numbers of specimens.1,2 In addition, all HBV test results are verified by humans. Humans will make some stupid mistakes sometimes, and it is time-consuming to contrast with the previous data. In addition, the ELISA is a semiquantitative assay to test HBV, and the gray zones are difficult to determine. So there is a real need to increase efficiency and improve workflow. In addition to the introduction of automated equipment and the development of laboratory information technology, another way to increase working efficiency is to build autoverification rules. Autoverification can greatly reduce the TAT, manual review time, and error rate.4,9,11 In this article, autoverification rules consist of instrument error flags, negative and positive controls, QC, gray zones, the patterns of five HBV serological markers, and a delta check ( Fig. 1 ). The premise for autoverification is that the QC results should be passed through QC rules. Otherwise, the process of autoverification should be suspended until the QC results are satisfied.
As an economical and feasible strategy, the combined use of gray zones in an ELISA can significantly increase the efficiency of HBV serological marker detection. To find a suitable way to calculate gray zones, we evaluated two of the groups of gray zones. According to the automatic passing rate and probability of false positives (4.0% vs. 2.8%), we chose gray zones determined by the ROC curve. According to the gray zones, the percentage of gray zone was about 18.3%. In our laboratory, we would retest specimens in the gray zone on the following day. If the result was different from previous results and out of the gray zone, we would refer to the patient’s electronic medical records (including liver function) in the HIS, and the result was sent to the HIS when it was in accordance with patient information. Otherwise, we would communicate with the clinicians and suggest rechecking for HBV or detecting HBV DNA. We also used CMIA and TRFIA to test specimens in the gray zone. In addition, we discussed with physicians in the Department of Infectious Disease the results in the gray zone and several reasons for gray zone performance, including vaccination, immunologic function, and infant and disease status. For example, the antibody titer is low when the immunologic function is suppressed, and if an infant’s immune system is premature, the antibody is low. 51 Also, cases in the gray zone may be attributable to recent vaccinations and can lead to cancellation of the test to avoid falsely labeling the patient as hepatitis B–positive.
Although nonfamiliar patterns (shown in Table 5 ) of HBV serological markers infrequently appeared 2.8% of the time, attention should be paid. Lu et al. previously reported that HBsAg and HBsAb could appear in a patient (pattern 13) when he or she was in the early stages of HBV infection or infected by a different subtype of HBV. 52 Moreover, some people may be vaccinated, but there was no detectable HBsAb in their body. 53 Furthermore, Chevirier et al. found 3.25% of HBcAb-positive samples to be positive for the presence of HBV DNA. Of these, a total of 12 subjects with a low level of HBV DNA were HBsAg-negative. Occult hepatitis B is related to high titers of HBcAb. 54 So, in pattern 2, we should notice the titer of HBcAb. At the same time, we also should pay attention to the window phase 46 because HBsAb can appear after the window phase.
During autoverification, some results did not pass the delta check. It is common to find that pattern 9 turns to pattern 8. Because the virus suffers from the body’s and drug resistance, 55 it may replicate at low levels, resulting in a gradual increase in HBeAb. 56 If the HBsAb is produced by vaccination, the HBsAb concentration will progressively decrease, so pattern 4 may evolve into pattern 1. The patterns of HBV serological markers are also related to the characteristics of HBV infection 57 and infection after a blood transfusion. 58 Furthermore, we found that HBsAb can be initially in some infants but negative afterward. Such antibodies could be maternal in origin, or the newborns could have suffered from exsanguination transfusion. In addition, some patients with hematological disease,59,60 including chronic lymphocytic leukemia (CLL), acute lymphocytic leukemia (ALL), myelofibrosis and idiopathic thrombocytopenic purpura (ITP), and cancer, 61 are also removed by the delta check, possibly due to blood transfusion changing the patterns of HBV serological markers. Moreover, some HBcAb-negative individuals become positive possibly due to exposure to HBV. Importantly, these results show that a delta check falling outside the feasible range could signify a significant change in patient condition. In such cases, laboratory technicians should inform the clinicians so the patient can receive appropriate treatment.
From the statistics in Table 6 , the autoverification rate for the five HBV serological markers is 79.5%, and there were no errors for the specimens that passed autoverification ( Table 6 ). In addition, the manual intervention rate was 20.5%, and the TAT was reduced by 38.0% (78 minutes compared to previous 126 minutes). Therefore, the TAT of patient reports is dramatically reduced because the HBV reports are released immediately instead of batch by batch. Although our rules and tests are different from others, the results are consistent with all of the prior studies.4,9,11
In conclusion, we believe that our autoverification rules can be used as a blueprint for validating test results in general. Although it is still largely practiced as an efficiency tool at the laboratory instrument workstation level, autoverification is rapidly expanding to provide increased functionality for middleware, such as LIS. It is necessary that autoverification of laboratory test results be viewed as a process evolving into a much broader, more sophisticated form of decision support, which will require strategic planning to form a foundational tool set for the laboratory to accelerate the process of releasing test results, and to decrease both the TAT and the probability of human review errors. Unfortunately, despite the advantages of autoverification, there are potential negatives that can arise. Even the most thorough validation plan can miss unexpected instrument error flags or other rare events. It is also not possible to test every conceivable combination of rules. Furthermore, the current study has some limitations. One is that the data come from a small sample size, and the other is that the implementation time is too short, just three months. In the future, we will continue implementing autoverification on HBV tests and other testing items, and construct an expert system for HBV serological markers.
Footnotes
Acknowledgements
We thank Mrs. Xu, the group leader of the Clinical Immunology Laboratory, for manual verification and providing technical guidance.
Declaration of Conflicting Interests
The authors declared the following potential conflicts of interest with respect to the research, authorship, and/or publication of this article: All authors have read and approved this version of the article, and due care has been taken to ensure the integrity of the work. No part of this article has been submitted or published elsewhere, and no conflict of interest exists in the submission of this manuscript. Finally, the authors have declared that no competing interests exist.
Funding
The authors received no financial support for the research, authorship, and/or publication of this article.