
Abstract
Arterial blood gas (ABG) analysis is important for acutely ill patients and should be performed by qualified laboratorians. The existing manual verifications are tedious, time-consuming, and prone to send wrong reports. Autoverification uses computer-based rules to verify clinical laboratory test results without manual review. To date, no data are available on the use of autoverification for ABG analysis. All autoverification rules were established according to AUTO10-A. Additionally, the rules were established using retrospective patient data, and then validated by actual clinical samples in a “live” environment before go-live. The average autoverification passing rate was 75.5%. The turnaround time (TAT) was reduced by 33.3% (27 min vs 18 min). Moreover, the error rate fell to 0.05% after implementation. Statistical analysis resulted in a kappa statistic of 0.92 (p < 0.01), indicating close agreement between autoverification and senior technician verification, and the chi-square value was 22.4 (p < 0.01), indicating that the autoverification error rate was lower than the manual verification error rate. Results showed that implementing autoverification rules with intelligent guidelines for ABG analysis of patients with critical illnesses could decrease the number of samples requiring manual verification, reduce TAT, and eliminate errors, allowing laboratorians to concentrate more time on abnormal samples, patient care, and collaboration with physicians.
Introduction
Arterial blood gas (ABG) analysis is used to evaluate oxygen and carbon dioxide gas exchange and acid–base status. Critically ill patients generally have pathophysiologic changes that alter gas exchange or acid–base balance. Therefore, ABG analysis is used as an indispensable part of assessing a patient’s oxygenation status and acid–base imbalance. 1 Common indications for ABG testing have been reviewed elsewhere. 2 The most common indications include cyanosis and dyspnea due to various causes, such as an acute attack of asthma, acute pulmonary embolism, or chronic obstructive pulmonary disease (COPD). Clinical settings where analysis is indicated involve patients with acute asthma in the emergency room, postoperative treatment of patients who have had coronary artery bypass graft surgery, stable patients in the intensive care unit, and patients receiving prophylactic supplemental low-flow oxygen by nasal cannulation. 2 Test results directly influence patient management. For example, in a critical care setting, blood gas testing is often utilized primarily for management of mechanically ventilated patients to assess oxygenation and ventilation. 1 This also requires that technicians have theoretical and practical knowledge of performing ABG testing and interpreting acid–base balance results. 3 Such theoretical knowledge of technicians is variable, making ABG testing prone to send wrong reports, containing low-level errors (e.g., missing items) or logic errors; the error rate is one of the focuses of our study. In recent years, the workload has risen year by year, but staffs do not increase correspondingly. Additionally, blood gas analysis is required for emergencies and accuracy, analyzed by technicians, who are requested to mix specimens manually and check 22 items one by one in every ABG report, thereby increasing labor and mental burden in the laboratory. Therefore, developing an automated verification system for ABG analysis is required. The system would incorporate a consistency rule check on each item to reduce the probability of mistakes and save time to ease burden.
Blood gas testing is also exposed to the risks of errors caused by improper sampling; transport and storage conditions, such as visible air bubbles in the syringes; the patient’s temperature; oxygen delivery; anticoagulant concentration; and contamination of the sample from indwelling catheter or venous blood. These problems are common in various departments. Although many laboratories have their own protocol for ordering, collection, and analysis of blood gases, many preanalytical procedures remain unchanged. 1
Based on the Clinical and Laboratory Standards Institute (CLSI) document AUTO10-A (Autoverification of Clinical Laboratory Test Result Approved Guideline), 4 autoverification is a new technology with a set of rules for verification to ensure report quality and enhance laboratory efficiency. 5 Autoverification can also shorten the report turnaround time (TAT) and staff whole time equivalents (WTEs). 5 This approach has been widely implemented or studied in clinical chemistry, 6 coagulation, hematology, and urinalysis in different laboratories, 7 yet no data exist for ABG analysis. In addition, a set of guidelines for handling failed results is not mentioned in the literature.
In this study, we present a detailed description of how to construct autoverification rules with intelligent guidelines for ABG analysis. Our rules with guidelines apply to analysis of arterial, not venous, “mixed” venous or capillary blood in central laboratories. Moreover, we measure the TAT, WTE, autoverification rate, and error rate. We find that autoverification rules with intelligent guidelines for ABG analysis of patients with critical illnesses, and no severe anemia or vasoconstriction, are useful for decreasing the number of samples requiring manual verification, reducing TAT, and almost completely eliminating errors.
Materials and Methods
Clinical Samples
A total of 32,767 preoperative test results stored in the Laboratory Information System (LIS) were collected from January 2014 to December 2016 in a comprehensive teaching hospital in Shantou, China (the First Affiliated Hospital of Shantou University Medical College) with 67 clinical departments and 1668 beds. The subjects were 22,127 males and 10,640 females aged from 1 h to 105 years, mainly from the Respiratory Medicine, ICU (intensive care unit), and Neonatology Departments. Neither inclusion nor exclusion criteria were applied to stratify the entire population. Age and gender were not considered, just as in our previous study. 8 Retrospective patient data were used to develop the model, such as limit range and delta check. A distribution interval of patient data between 2.5% and 97.5% was used.
There were 1248 results, from November 19, to December 18, 2017, used for validation in a “live” environment, verifying actual patient results based on established rules without any manual intervention before go-live. Neither inclusion nor exclusion criteria were applied. All of the patients required for ABG analysis were included in this period. The baseline characteristics of the 1248 patients are shown in Table 1 .
Baseline Characteristics of the Population in a Live Environment.
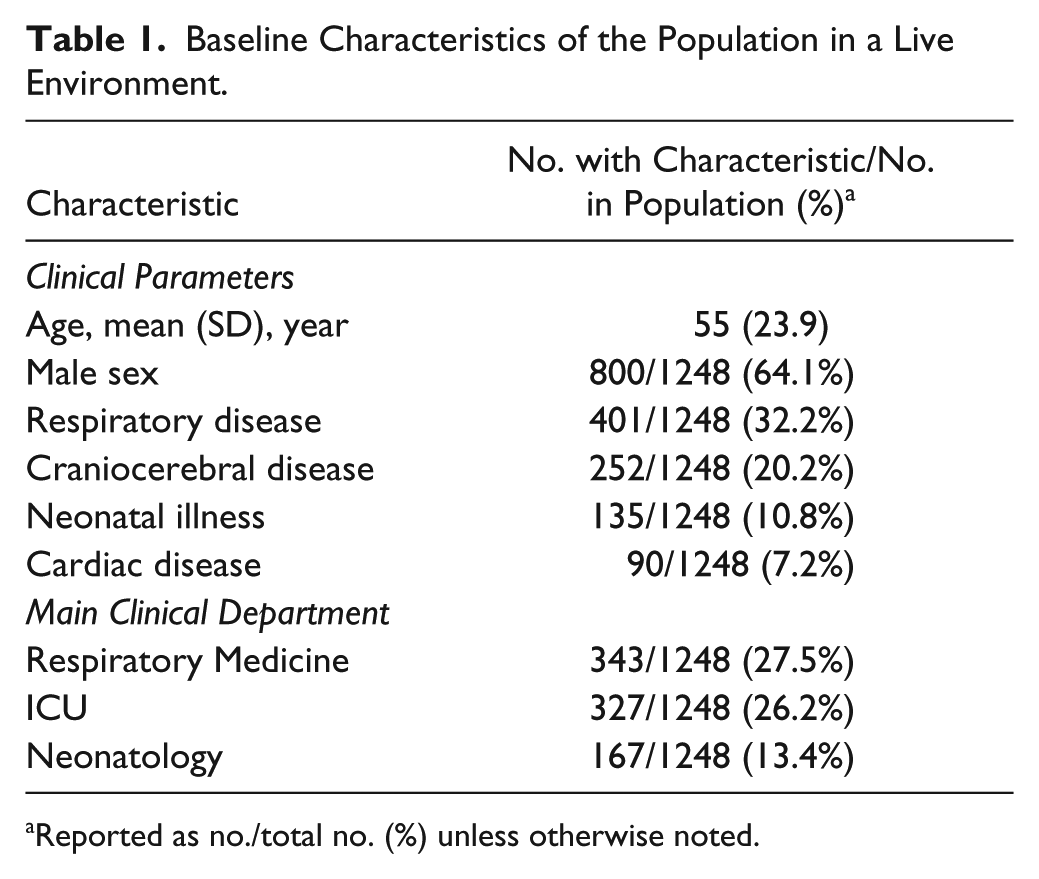
Reported as no./total no. (%) unless otherwise noted.
Special samples were collected for verification of the efficiency of the autoverification rules and the reliability of the reports. Special samples included abnormal proficiency test samples chosen from more than 50 patient samples stored in the LIS. Most of the test results were out-of-limit ranges, delta check ranges, or failed logic rules.
Testing Instruments
Stat Profile pHOx Plus L Analyzer (Nova Biomedical Corp., Waltham, MA)
The analyzer was operated by daily laboratory workers in our clinical laboratory in cooperation with medical experts from the Department of Respiratory Medicine. Our laboratory is the main department for ABG analysis. Controls were provided by Nova Biomedical Corp. 3
Software: Hang Zhou (China) Venture HIS (Hospital Information System) and LIS, and SPSS statistical package version 13.0 (SPSS Inc., Chicago, IL).
Statistical Analysis
The chi-square test was used to prove that the error rate of autoverification was lower than the error rate of manual verification. p < 0.05 was considered significant.
A kappa test9,10 was used to evaluate close agreement between autoverification and expert manual verification. The kappa coefficient represents the observed agreement. The strengths of the observed agreements were as follows: <0.20 bad, 0.20–0.40 common, 0.41–0.60 moderate, 0.61–0.80 strong, and 0.81–1.00 very strong. 10
Design of Autoverification Rules
Boolean logic was used to design our autoverification rules according to the guidelines of “Design of Algorithms” in the AUTO10-A document. Afterwards, the rules in the LIS were established and validated with historical patient data stored in the database. A flowchart for autoverification was constructed (
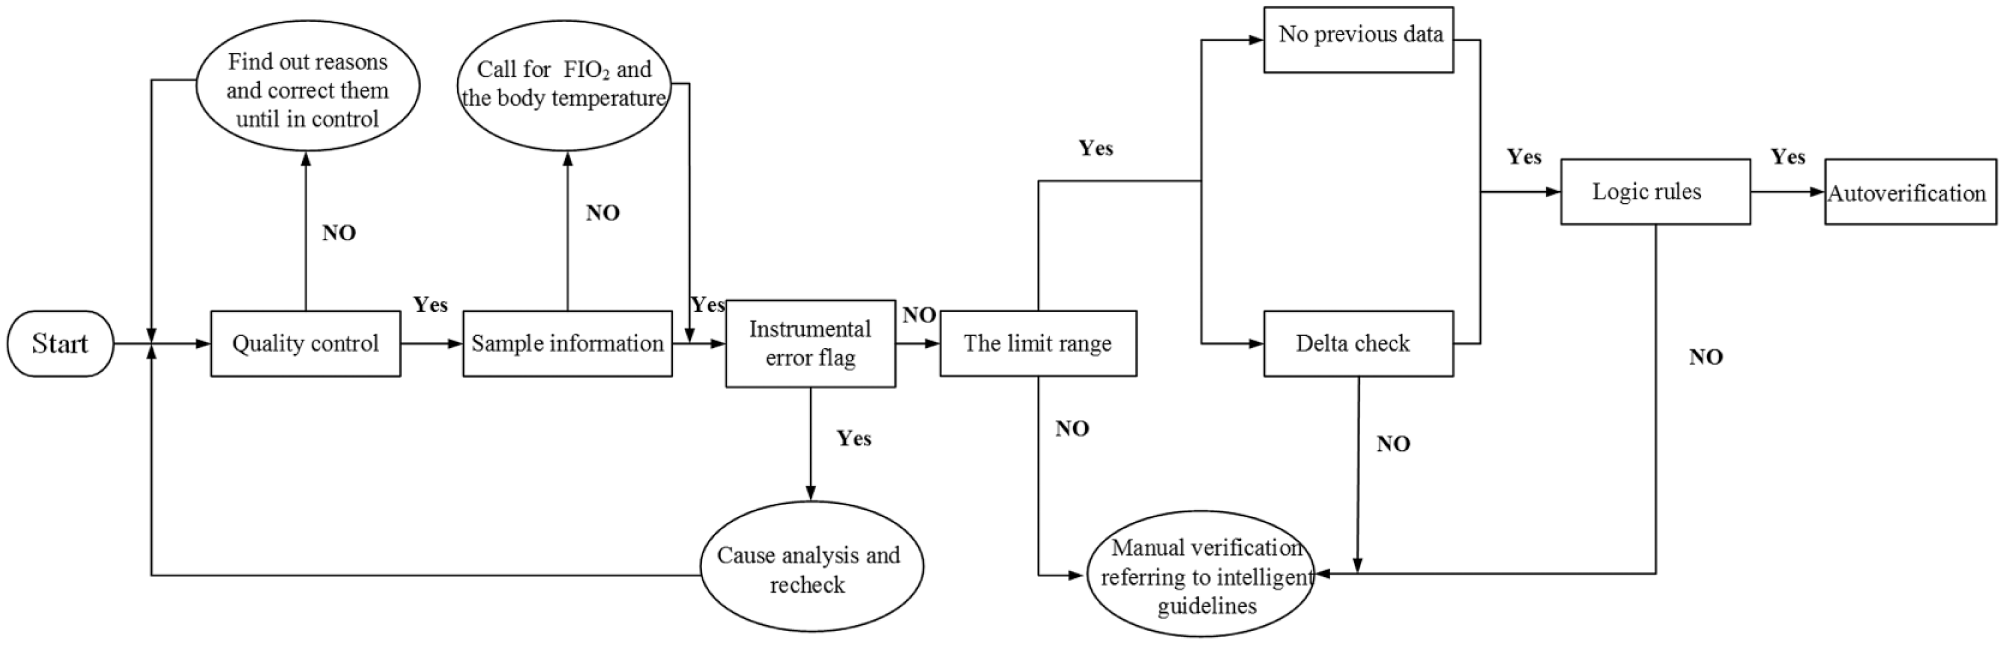
Flowchart of autoverification rules. The processes consisted of QC, sample information, instrument error flags, limit range, delta check, and logic relations. Once a rule fails, autoverificaiton is suspended.
Quality Controls
Control Levels
Level 1—acidosis: low pH (potential of hydrogen); high pCO2 (partial pressure of CO2); low pO2 (partial pressure of O2); high Na+, K+, Cl–, Ca++, Glc (glucose), and Lac (lactic acid)
Level 2—normal: normal pH, pCO2, and pO2; low SO2 (oxygen saturation);, low normal Hct (hematocrit) and Hb (hemoglobin); normal Na+, K+, Cl–, Ca++, Glc, and Lac
Level 3—alkalosis: high pH; low pCO2; high pO2, SO2; normal high Hct and Hb; low Na+, K+, Cl–, Ca++, Glc, and Lac
Quality controls were performed routinely to guarantee that the daily curve was reliable. QC monitoring was done using the Nova Stat Profile pHOx Plus L Controls. 3 The entire operation process strictly followed standard operating procedure (SOP).
Three levels of internal quality control (IQC) were set in the program. During each 8 h of testing, one level control was analyzed. All three levels were analyzed during each day of operation. QC results were transmitted to the LIS and evaluated by using Levey–Jennings control charts 11 and Westgard QC multirules12,13 for every item and level.
Sample Information
Before testing, technicians verified the details on the specimen label that matched those on the test request. For correct assessment of the patient’s condition, the additional required information, including the patient’s temperature and fraction of inspired O2 (FIO2) or description of oxygen delivery, was verified. 3 The pO2, pCO2, and pH will change as the temperature changes.3,14 FIO2 will influence the alveolar–arterial oxygen difference (AaDO2) and arterial–alveolar oxygen tension ratio (a/A).
Instrument Error Flags
The analyzer produced error codes when there were problems in performing sample analysis or mechanical failure. These errors included insufficient sample, uncalibrated channel, sample clot, slope drifting, and zero-point drifting. When warning messages showed up on the screen, the technicians determined the reasons, corrected the problems as soon as possible, and restarted the test thereafter.
Limit Range
Limit range is the rule that screens test results. Conventional reference intervals were usually not ideal for autoverification due to factors related to biological variation. 15 We discussed the limit range with laboratory professionals and physicians. Then the acceptable range for the limit check was made in combination with the critical value, life range, reference range, and the distribution interval of patient data between 5% and 95%.7,16 The limit range was defined as 47.1–149.7 mmHg for pO2, 20–70 mmHg for pCO2, and 7.27–7.50 for pH.
Delta Check
The delta check aids in quickly identifying changes in a patient’s condition. To date, several investigators have analyzed delta check methods. There are four delta check methods: the delta difference, delta percent change, rate difference, and rate percent change.17–20 In this study, we chose the rate percent change, which was calculated as the current value subtracted from the previous value and later divided by delta time. A time interval was established on day 1 based on the passing rate of autoverification and the rapid change in patient condition. In addition, we suggested that the results could pass the delta check if the rate percent changes of pH, pCO2, pO2, and HCO3– were within the set range in the day 1 time interval. The set ranges were –50% to 107% for pO2, –38.4% to 49.2% for pCO2, –2.4% to 2.7% for pH, and –28.2% to 39.0% for HCO3–.
Logic Rules
The report of ABG analysis contained 22 items in our laboratory. There were definite relationships among them. Previous studies examining clinical chemistry have set certain logic rules, such as total bilirubin (TBIL) > direct bilirubin (DBIL), whereas no studies mention ABG analysis. Therefore, we listed logic rules to perform in order to avoid potential errors. We communicated with the clinicians of the Respiratory Medicine Department and set rules as follows:
Total carbon dioxide (TCO2) > [HCO3–]. TCO2 is the sum of dissolved carbon dioxide and [HCO3–] by eq 1: TCO2 = [HCO3–] + α*pCO2, where [HCO3–] (also known as “actual bicarbonate”) is the concentration of bicarbonate in the blood.
Oxygen capacity (O2CAP) > oxygen content (O2CT). O2CAP is the maximum oxygen content of hemoglobin in the blood when oxygen is fully saturated and includes bound and unbound hemoglobin. 21 O2CT is defined as the total amount of oxygen contained in whole blood and includes oxygen bound to hemoglobin and dissolved oxygen. According to eq 3 in Table 2 , the dissolved oxygen contributes far less than the hemoglobin-carrying oxygen. Therefore, the dissolved oxygen can be ignored. The combined hemoglobin is a part of the whole hemoglobin in blood. Therefore, O2CAP > O2CT is a must. However, this logic rule was not considered in our study, because the machine has its own calculation for O2CAP and O2CT ( Table 2 ), and O2CAP was not always greater than O2CT. This is the shortcoming of this instrument for these two calculation parameters.
Alveolar oxygen partial pressure (pAO2) > partial pressure of oxygen (pO2). The pAO2 is alveolar oxygen, which refers to the partial pressure of oxygen in alveolar gas. The pO2 is defined as the partial pressure of oxygen in the gas phase in equilibrium with the blood. The pAO2 influences the pO2. As oxygen diffuses into pulmonary capillaries, the pO2 decreases below the pAO2.
When the pO2 is above 60 mmHg, the SO2 is above 90%. This finding was validated in 32,767 patients, and 96.9% of the results fit this rule.
When the PO2 is lower than 48 mmHg and the SO2 is lower than 80%, this demonstrates that the sample may be venous blood.
Base excess (BE) is usually negative when the pH is below 7.35, whereas the contrary occurs when the pH is above 7.35, except for mixed acid–base imbalance.
Formulas Used in Designing Autoverification Rules.
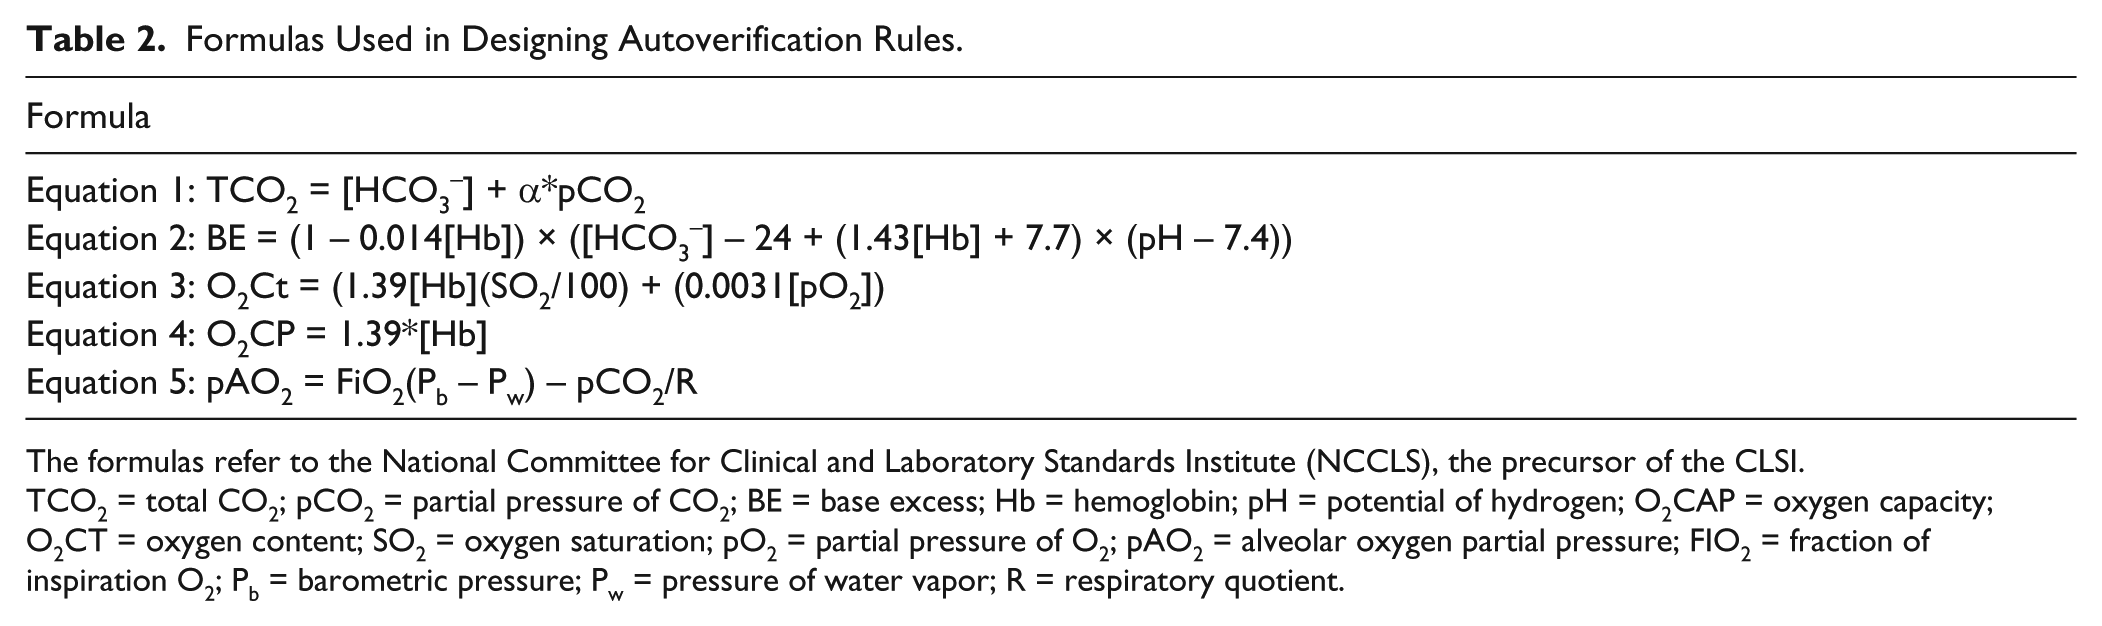
The formulas refer to the National Committee for Clinical and Laboratory Standards Institute (NCCLS), the precursor of the CLSI.
TCO2 = total CO2; pCO2 = partial pressure of CO2; BE = base excess; Hb = hemoglobin; pH = potential of hydrogen; O2CAP = oxygen capacity; O2CT = oxygen content; SO2 = oxygen saturation; pO2 = partial pressure of O2; pAO2 = alveolar oxygen partial pressure; FIO2 = fraction of inspiration O2; Pb = barometric pressure; Pw = pressure of water vapor; R = respiratory quotient.
Intelligent Guidelines
The guidelines were written in computer language with reference to the literature in the LIS. When results did not pass any one of the autoverification rules, a warning would occur. The guidelines defined a set of tags to indicate a warning. For each tag type, guidelines provided the causes of failings and how to troubleshoot different types of problems.
For the questionable results, we first determined which rules they did not pass. Then all problems, treatments, and test results were extracted. Then we held discussions with specialists to determine why and how to tackle failure modes combined with the instrument’s manual. By analyzing the tag evidence, we determined that the tags primarily fell into four categories: QC failure, instrument alarm, limit range check failure, and logical errors. Finally, we provided intelligent guidelines, a brief description of the causes and how to tackle these failings. The system as a plugin was joined to LIS to achieve automation. The details of the violated autoverification rules and their actions are given in Table 3 .
Actions Required as a Result of Violated Autoverification Rules Derived from Historical Samples and Discussion with Specialists.
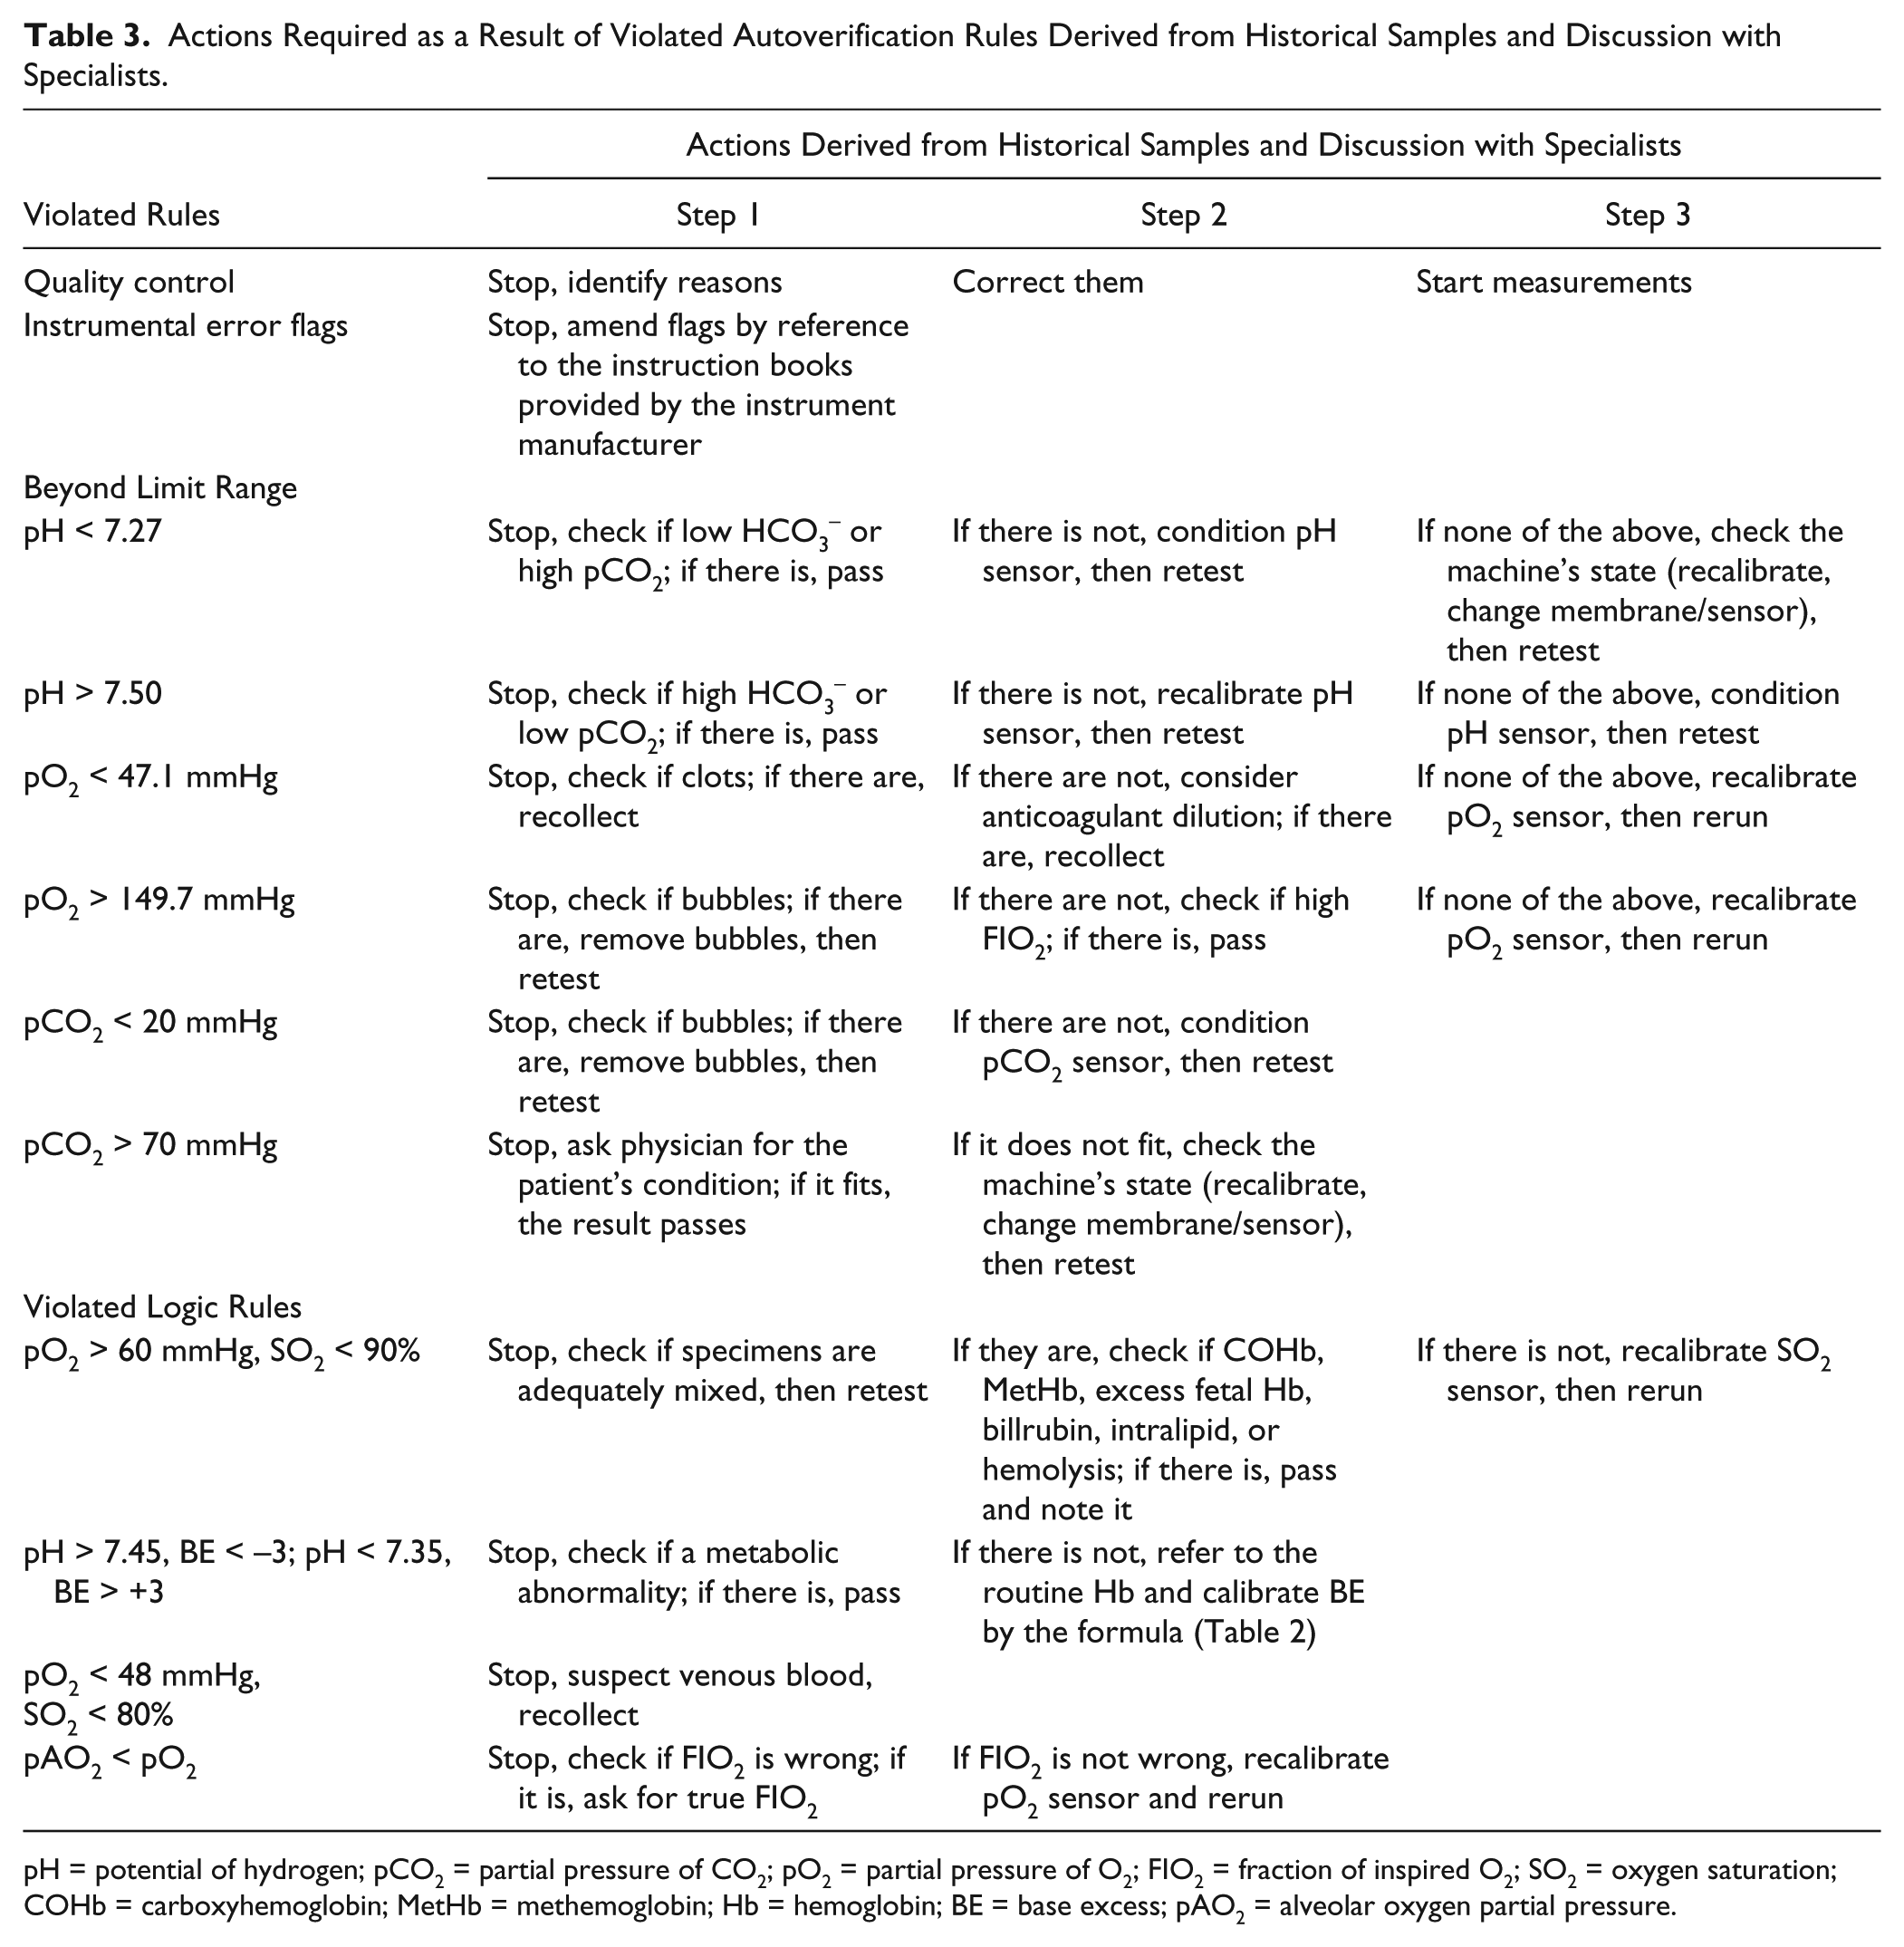
pH = potential of hydrogen; pCO2 = partial pressure of CO2; pO2 = partial pressure of O2; FIO2 = fraction of inspired O2; SO2 = oxygen saturation; COHb = carboxyhemoglobin; MetHb = methemoglobin; Hb = hemoglobin; BE = base excess; pAO2 = alveolar oxygen partial pressure.
QC was the prime of all steps. Autoverification could proceed only when the QC results were verified each day. If any QC results did not meet the QC standards, autoverification was stopped and the reasons were identified and corrected.
Logic rules were innovative and notable components in this study. One of the logic failings was that the SO2 was below 90% when the pO2 was above 60 mmHg. SO2 was measured by a reflectance photometric system in our analyzer. Adequate mixtures of the specimen should be checked first. Moreover, this rule that the SO2 was above 90% when the pO2 was above 60 mmHg was based on a normal shape and position of a patient oxygen dissociation curve. High levels of carboxyhemoglobin and methemoglobin might overestimate SO2. 3 Because blood gas analyzers assume hemoglobin to be of the adult type (default), the presence of excess fetal hemoglobin might cause the low SO2. 3 Bilirubin, intralipid, and hemolysis also interfered with the SO2% value.3,22,23 If these factors were present in the patient’s record, we admitted the result and noted factors. Additionally, another reason could be a SO2 sensor problem, so the sensor would be recalibrated. Next was the relation between pH and BE. BE is an objective index that reflects metabolic factors. BE could also be influenced by hemoglobin. The guidelines to these failings are outlined in Table 3 . A low pO2 with the low SO2 may indicate venous blood. In the formula ( Table 2 ), we know that pAO2 is influenced by FIO2 and pO2, especially FIO2. FIO2 was provided by the clinicians. If the provided FIO2 was not accurate, in particular lower than the actual FIO2, then pAO2 < pO2 might occur.
Validation Methods
Special samples, historical data, and real-time data were used to validate whether the autoverification rules with intelligent guidelines were able to meet our requirement for implementation, and the entire validation process was based on the recommendations in the CLSI AUTO10-A.
Special Sample Validation
Special samples were chosen to verify the efficiency of the autoverification rules with intelligent guidelines. The validation results demonstrated that there were no errors in the autoverification rule use.
Validation Using Historical Data
All patient ABG analysis test results from January 2014 to December 2016 were stored in the LIS, which allowed us to validate the rules by using historical data. All results had been verified and reviewed by skilled laboratory specialists. The validation was used to estimate the quality of autoverification and uncover problems with autoverification rules and electronic equipment before implementing real-time validation. The average passing rate of autoverification of historical data was 50.1%.
Validation in a Live Environment
We collected 1248 actual patient test results from November 19, to December 18, 2017, to use for real-time validation in a live environment after computerizing the rules in the LIS. The daily samples were still analyzed and verified by two technicians. In the meantime, autoverification rules with intelligent guidelines were written in another computer with the LIS. We did not send autoverification reports to the HIS in our study.
Results
The first part of autoverification consisted of a QC check, sample information check, instrumental error flags, limit ranges, delta check, and logic rules (
Preanalytical, analytical, and postanalytical elements were considered during the rules validation. In this period, instrumental flags appeared a total of 19 times. QC results passed as judged by the Levey–Jennings QC charts 11 and Westgard multirules.12,24 The results of actual patient autoverification were as follows:
The average autoverification passing rate of all test samples collected in 2017 was 75.5% (941/1248), and the average rate of manual verification was 24.5% (307/1248) ( Table 4 ).
The average rates of results exceeding the limit range, delta check, and logic rules were 18.9% (236/1248), 1.9% (24/1248), and 2.0% (25/1248), respectively ( Table 4 ).
The average error rate was nearly zero ( Table 4 ).
TAT was reduced by 33.3% (from 27 to 18 min). The WTE staffing number was reduced from three to one.
The kappa value was 0.92, indicating a close agreement between autoverification and verification by senior technicians ( Table 5 ).
Test Results for Collected Samples in 2017 with Autoverification Passing Rate and Manual Intervention Rate.
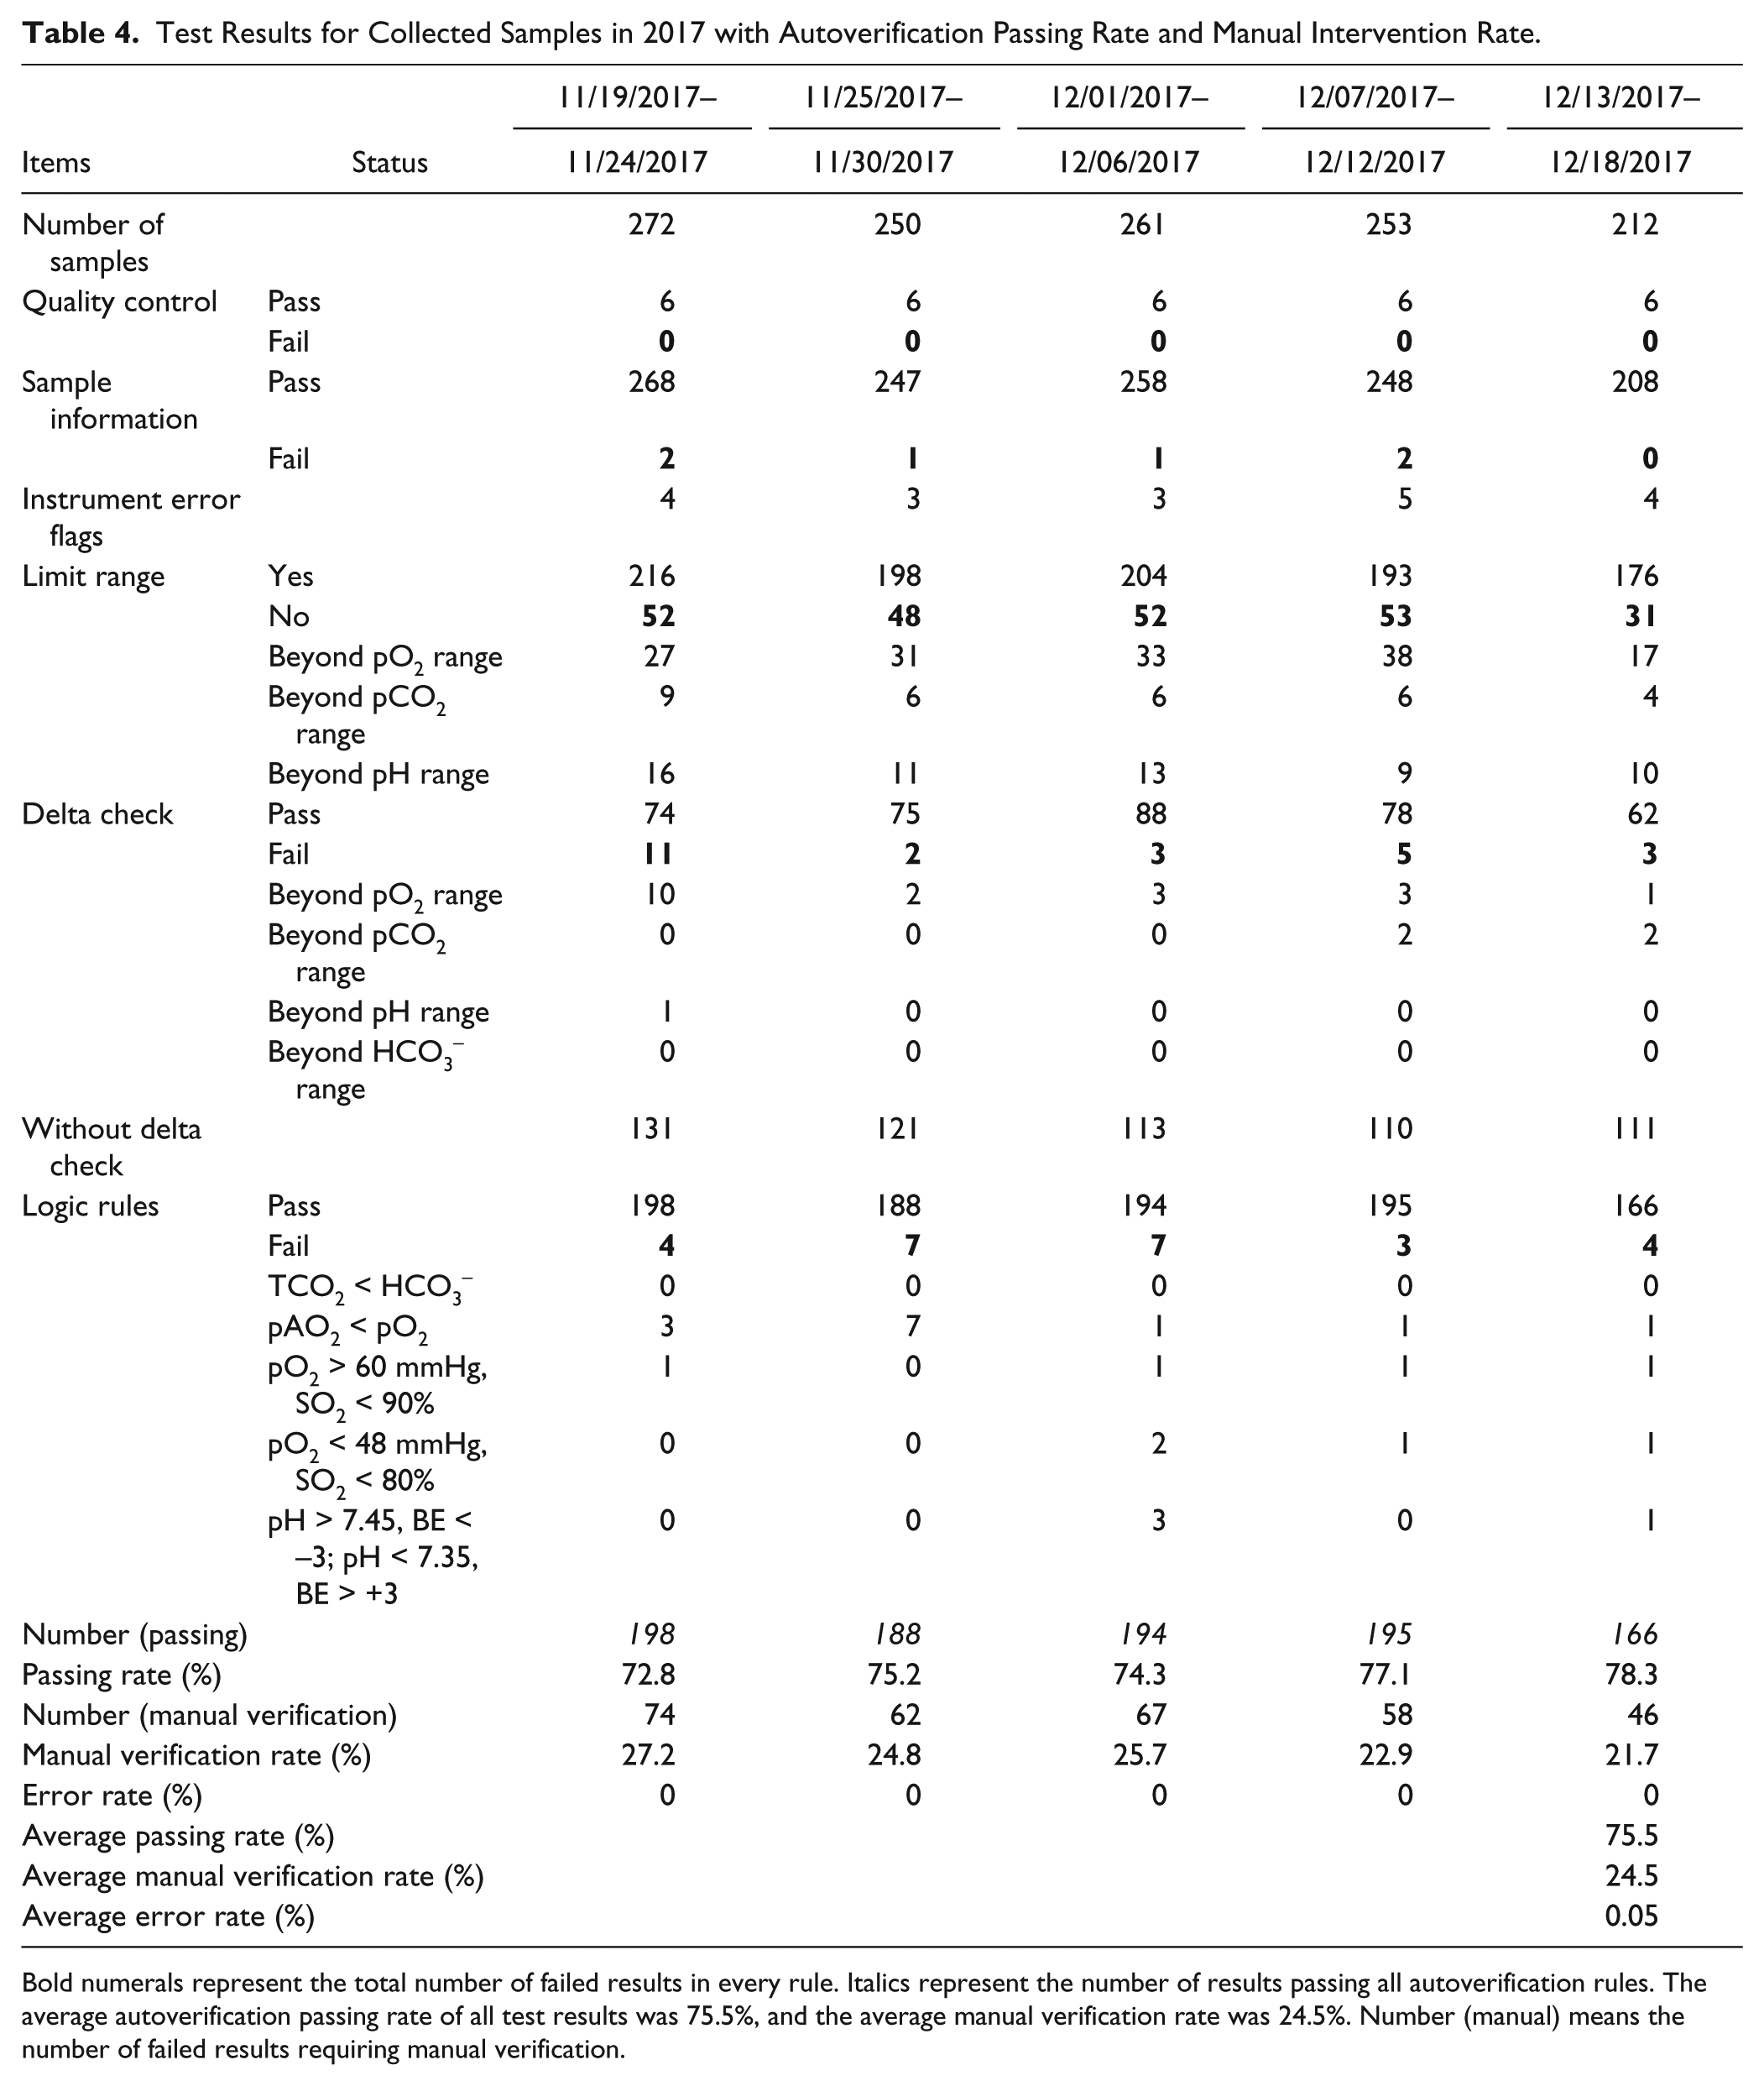
Bold numerals represent the total number of failed results in every rule. Italics represent the number of results passing all autoverification rules. The average autoverification passing rate of all test results was 75.5%, and the average manual verification rate was 24.5%. Number (manual) means the number of failed results requiring manual verification.
Degree of Agreement between the Autoverification Rules and Two Senior Technicians.
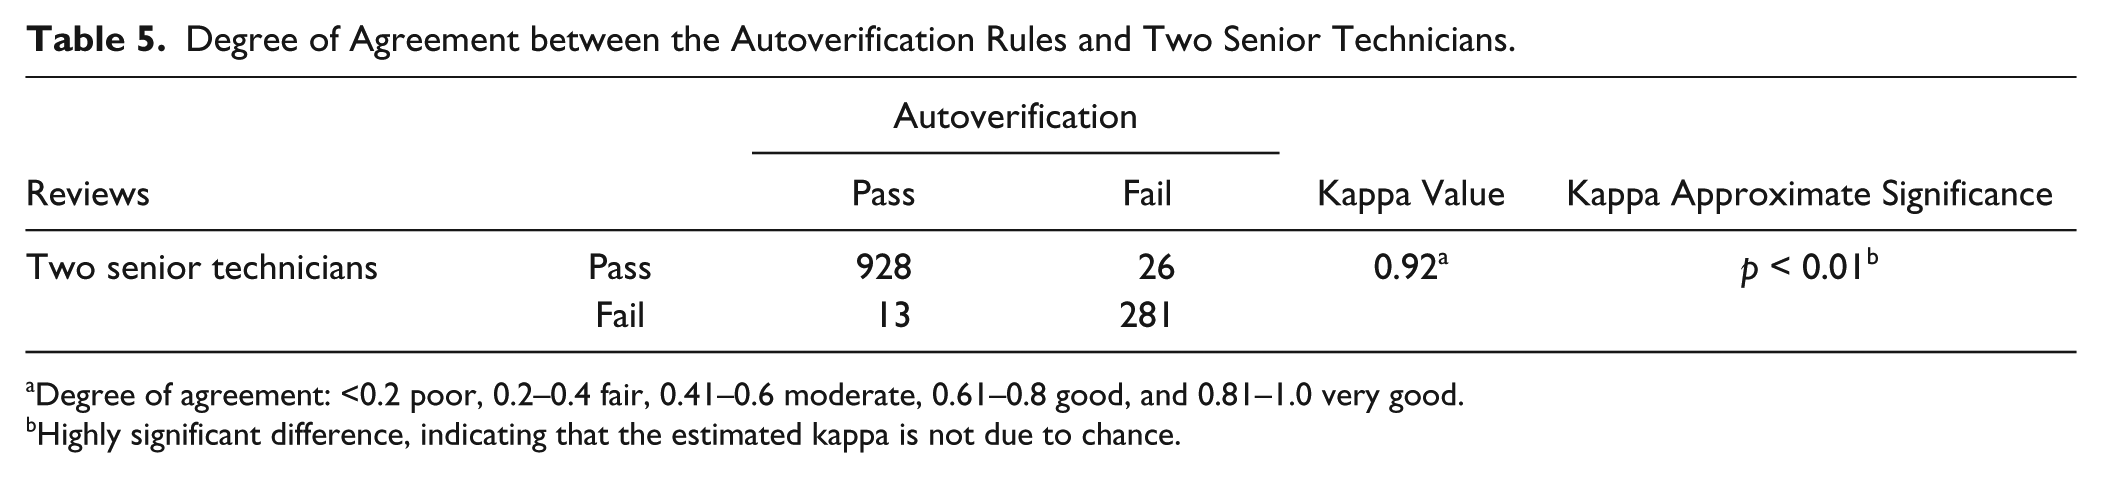
Degree of agreement: <0.2 poor, 0.2–0.4 fair, 0.41–0.6 moderate, 0.61–0.8 good, and 0.81–1.0 very good.
Highly significant difference, indicating that the estimated kappa is not due to chance.
Evaluation of the Benefits
We used TAT, manual verification rate, and the error rate from November 19, to December 18, 2017, to evaluate the advantage of implementing autoverification rules with intelligent guidelines for a month. The TAT was measured from samples performed for verification, and the time interval was from the time of sample receipt by the laboratory staff to the time of result verification in the LIS. After implementing autoverification rules with intelligent guidelines, the number of manual verification was cut by 75.5%, thereby reducing labor and mental burdens, and the TAT fell by 51.8% (from 27 to 13 min), showing that autoverification can greatly enhance efficiency in the laboratory. Moreover, with intelligent guidelines, most problems were treated in a timely manner.
In our study, the error in manual verification and the error in antoverification were the same, meaning that they sent reports containing low-level errors (e.g., missing items) or logic errors. Before implementation, the error rate of manual verification was 2.0%. By contrast, after implementing the rules with guidelines, the error rate was 0.05%, nearly completely eliminated. Comparing autoverification versus manual verification, the chi-square test gave a chi-square value of 22.4, and the asymptotic significance was below 0.01, indicating that the error rate of autoverification was significantly lower than the error rate of manual verification ( Table 6 ).
Chi-Square Test of the Error Rate (%) between Before and After Implementing Autoverification Rules with Guidelines.
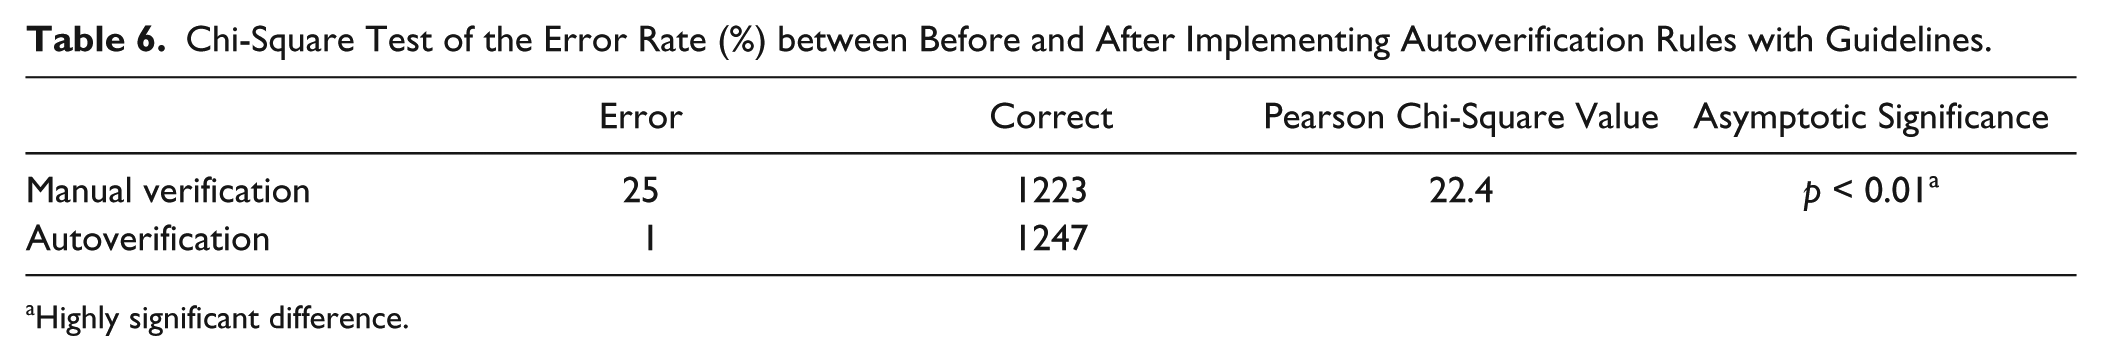
Highly significant difference.
Discussion
ABG analysis provides important and timely clinical information and is vital for patient diagnosis and treatment. 25 To date, there are many reports regarding preanalytical factors, but there is no information concerning autoverification rules with intelligent guidelines, for measuring ABG, suitable for clinical use. Hence, we built an automatic system to satisfy clinical needs.
The autoverification rules consist of (1) quality controls, (2) sample information, (3) instrument error flags, (4) limit range, (5) delta check, and (6) logic relations. Moreover, the added intelligent guidelines are the original part in our study. Quality controls are the prime of all rules. Only when QC requirements are met will the process proceed. Upon on failure of any rules, autoverification would be suspended and intelligent guidelines entered for manual verification.
During the validation in real time ( Table 4 ), subjects were divided into five groups, 6 days per group, to facilitate statistics. The sample size for each group averaged 250 individuals. During autoverification, quality controls of ABG analysis were performed daily. Most results passed sample information and instrument error flag checks at a rate of none or one per day. In the course of limit range check, the failed samples were at an average of 8 per day. Among them, pO2 accounted for more than half. In the process of delta check, the number of results beyond the pO2 delta check range accounted for more than 70%. Nearly half of the patients had no history of blood gas analysis. Logic errors were difficult to find because of their complexity between ABG parameters. Errors have a direct impact on the credibility of a report, making the logic rule check critical in our study. Results also showed that logic errors exist almost daily. pAO2 < pO2 accounted for a large proportion of 52%, and this logic error could be ascribed to the wrong FIO2. When results passed all rules, we got a 75.5% average autoverification passing rate in the end. The failing results, which accounted for 24.5%, needed further manual verification.
In our study, QC and the limit range are only for pH, pCO2, and pO2, which were measured directly and are considered the most important parameters for evaluating acid–base disturbance. Among 22 testing items, pH, pCO2, pO2, and HCO3– were chosen for the delta check, because they are the basic parameters used in the clinic and are related to the judgment of acid–base imbalance.
The limit range check is crucial to results without historical data because the delta checks are unable to be used. Delta checks in ABG analysis are not as effective as in the other autoverification studies, because the patients are usually very ill and their condition can vary widely with time. The main diseases required for ABG analysis are respiratory disease, craniocerebral disease, neonatal illness, and cardiac disease, and they accounted for 70.4% of the total in our study. A patient undergoing ventilation treatment could have a pO2 quite different from the previous pO2 without ventilation. For example, when a COPD patient with acute exacerbations is transported to the emergency room, he will have hypoxemia with a low pO2 under 60 mmHg. One day later, his oxygen pressure could increase above 200 mmHg after oxygen therapy. Under these conditions, the delta check is pointless and would reduce the autoverification passing rate. So we set just day 1 for the interval of the delta check.
In collaboration with a clinician from Respiratory Medicine, we set six logic rules for ABG analysis. The six logic rules enable us to quickly find logic errors between ABG analysis items. Our rules were set as cautiously as possible to guarantee patient safety to the utmost, so some reliable reports were prevented from release and false-positive results were inevitable.
To date, there is no literature about the intelligent guidelines mentioned in this study. The combination of autoverification with intelligent guidelines makes our system more reliable and effective; shortens the TAT, from sample performing to verification, by 33.3% (from 27 to 18 min); and gets an average autoverification passing rate of 75.5%, which is close to the VALAB system passing rate of 50%–90%. 26 Moreover, the number of staff specified for result validation was reduced from three to one. However, our passing rate is lower than that of the DNSev system, which shows a verification rate of approximately 80%. 27 The differences could be made by the research object, laboratory instrumentation, and patients.
Two statistical methods were applied to evaluate our system. The consistency between autoverification and the two qualified technicians is significant (kappa value = 0.99, p < 0.01), demonstrating that our system is valid. The chi-square test comparing the preimplementation error rate and postimplementation error rate also demonstrates significance (Pearson chi-square value = 22.4, p < 0.01). The error rate could be further reduced to 0.05% after implementation, indicating that our system could reduce the probability of making mistakes.
In conclusion, we show that implementing autoverification rules with intelligent guidelines can decrease the number of samples requiring manual verification, reduce TAT, and eliminate errors of sending wrong reports. This allows laboratorians to concentrate more time on abnormal samples, patient care, and collaboration with physicians. The autoverification for ABG analysis implemented in our laboratory is time-saving, consistent among different technicians, and effective in error reduction. However, we only collected 1248 data points over a period of 1 month for real-time validation, which is not a sufficiently large sample. Initially, we wanted to combine results with clinical diagnosis, but the connection between the HIS and LIS in our laboratory was limited, so we had to base our study purely on experimental data. Also, our system did not include all problems and troubleshooting. A few problems, such as those produced by small, undetected clots, were unavoidable. In the future, we will combine the system with patient condition, communicate with clinicians, update guidelines, and strive to make a detailed expert system for the clinic.
Footnotes
Acknowledgements
This study was approved by the Ethics Committee of the First Affiliated Hospital of Shantou University Medical College, Guangdong, China. No consent was needed in this study. We thank Mr. Yang, the group leader of the Clinical Chemistry Laboratory, for manual verification and providing technical guidance. Additionally, we thank Ms. Pan, a professor in the clinical laboratory of Shantou University Medical College (SUMC), for her review of the manuscript.
Declaration of Conflicting Interests
The authors declare no potential conflicts of interest with respect to the research, authorship, and/or publication of this article.
Funding
The authors received no financial support for the research, authorship, and/or publication of this article.