
Abstract
Flow cytometry is widely used in many laboratories for automated nucleated cell counts and their differentiation in body fluids. The implementation of new reflex testing rules on these automated instruments could open new frontiers in laboratory workflow, improving characterization of body fluids and clinical diagnosis and decreasing costs. Ascitic (150) and pleural (33) fluids were collected and assessed by XE-5000 and optical microscopy. Cell counts performed with the methods showed a Pearson’s correlation of 0.98 (p < 0.0001), Passing–Bablok regression y = 0.99x + 2.44, and bias of 32.3. In ascitic fluids, the best diagnostic performance was found for polymorphonuclear and neutrophil counts on XE-5000, which exhibited areas under the curve (AUCs) 0.98 (p < 0.0001) and 0.99 (p < 0.0001), respectively. In pleural fluids the best diagnostic performance was found for polymorphonuclear percent parameter, which displayed 0.97 (p < 0.0001). Specific reflex test rules based on these parameters were characterized by 92% diagnostic concordance, 1.00 sensitivity, and 0.84 specificity with optical microscopy. The application of a set of reflex testing rules may improve the diagnostic performance of XE-5000, increasing its reliability for routine automated cell count in body fluids. We acknowledge that further studies should be planned to validate our findings according to clinical data.
Introduction
The analysis of pleural (PF) and ascitic/peritoneal (AF) fluids by means of flow cytometry represents a valuable opportunity for diagnosis and categorization of body cavity effusions. A diagnosis of spontaneous bacterial peritonitis can be made when the neutrophil (NE) count in ascitic fluids exceeds 250 cells/μL, whereas the diagnosis of tuberculous peritonitis is very likely in the presence of a total nucleated cell (TNC) count of ≥1000 TNC/μL in combination with a prevalent population of lymphocytes (LYs).1,2
A TNC count of ≥1000 TNC/μL in PFs is suggestive for a diagnosis of exudative pleural effusion. In particular, the presence of a prevalent population of NEs (i.e., >50%) is indicative of acute inflammation or parapneumonic effusion, whereas the presence of a prevalent population of LYs (i.e., >50%) is frequently observed in patients with tubercular infection, metastasis, lymphoproliferative disorder, or chylous effusion. 1 The presence of eosinophils (EOs) in ≥10% of TNCs may be indicative of pneumothorax, pulmonary embolism, parasitic diseases, or Churg–Strauss syndrome. 1 Although optical microscopy (OM) remains the gold standard for identification and enumeration of TNCs in body fluids,1,3 this technique has some obvious drawbacks, which include high imprecision and interobserved variability, 4 time-consuming sample preparation and examination, need for trained and qualified personnel for accurate morphological interpretation, and long turnaround time (TAT), along with costs that are greater than those of automated cell counting. 5
The new generation of fully automated cell counters, including hematological analyzers and flow cytofluorimeters coupled with image analysis software for blood cell analysis or automated urinalysis, has also been developed for cell counting and differentiation in body fluids.5–24 It is noteworthy that the automated analysis of body fluid cellularity is mostly challenged by the presence of macrophages (MACROs), mesothelial cells (MESOs), and other abnormal or pathological cells (especially solid cancer cells) that are typically absent in blood or urine, so that the accuracy and differentiation of cellular elements may be impai-red.6,7,15,22,24 More specifically, some automated cell count analyzers provide a TNC count but not morphological differentiation,16–20 whereas specific information about the accuracy of cell recognition is unavailable for others.8,23,24 Even more importantly, validation rules for automated cell counting and a definition of the reflex testing required for accurate result reporting are unavailable in the current scientific literature to the best of our knowledge.
The hemocytometer XE-5000 (Sysmex Co., Kobe, Japan) is equipped with specific software for enumeration and identification of body fluid cellularity. The analytical performance (i.e., imprecision, functional sensitivity, linearity, and carryover) has been thoughtfully validated,4–13 thus enabling its routine use for analysis of body fluids. Nevertheless, a set of rules and the associated reflex tests that may be applied for validation of cell counting and differentiation in body fluids have not have been defined or evaluated so far. 1 Therefore, the aims of this study were to compare the performances of Sysmex XE-5000 and OM for TNC counting and differentiation in different PF and AF specimens, to evaluate diagnostic agreement with cutoffs provided in the CLSI standard, 1 and to develop a new set of rules based on diagnostic parameters provided by XE-5000 that could be used for automated cell count validation in routine analysis.
Materials and Methods
Cell Counts
A total of 184 consecutive fresh samples of body cavity fluids (151 AFs and 33 PFs) collected in 5.4 mg 2.0 mL K3EDTA tubes (Becton Dickinson, Franklin Lakes, NJ) and referred to the clinical laboratory for routine analysis from inpatient wards over approximately one month were simultaneously assessed by OM and Sysmex XE-5000. TNC and differential counts were performed with the XE-5000 body fluid (BF) mode, and results were compared to those obtained with OM after staining with Turk reagents and counting in a Nageotte chamber (dilution 1:20 or 1:200). Morphological classification was based on analysis of May–Grunwald–Giemsa-stained cytospin slides (Carlo Erba Reagents S.p.A., Milano, Italy) by two expert laboratory professionals, finally expressing results as the average of the two independent observations.
The BF mode on Sysmex XE-5000 offers a number of default parameters, including total nucleated cell (TC-BF) and white blood cell (WBC-BF) counts and differential cell counts for mononuclear elements (MN-BF) and polymorphonuclear leukocytes (PMN-BF), both in percentage and absolute number (#). Additional research parameters include eosinophil (EO-BF) and high-fluorescence cell (HF-BF) counting, both in percentage and absolute number.
The morphological differentiation by OM entailed cell classification in one of the following classes: neutrophils (NEs), lymphocytes (LYs), monocytes (MOs), eosinophils (EOs), basophils (BASOs), macrophages (MACROs), mesothelial cells (MESOs), and other cells (OTHER; also including blastlike cells).
The cells were then clustered in a discrete number of homogeneous cell categories to enable direct comparison of enumeration and differentiation with the two methods (i.e., XE-5000 vs OM), as follows:
TC-BF vs OM TNC #
MN-BF vs OM-MN1 (= LY + MO) % and #
MN-BF vs OM-MN2 (= LY + MO + MACRO) % and #
PMN-BF vs OM-PMN (NE + EO + BASO) % and #
NE-XE-5000 (= PMN-BF-EO-BF) vs OM-NE % and #
HF-BF vs OM-NO-WBC (= MESO + OTHER) % and #
The agreement between XE-5000 and OM was assessed with Pearson’s correlation coefficient (r), Passing–Bablok regression, Bland–Altman plot analysis, and Spearman’s rank correlation. The diagnostic concordance of XE-5000 compared to OM was evaluated with receiver operating characteristic (ROC) curves, diagnostic concordance, sensitivity, and specificity. The analysis was performed by using either the diagnostic thresholds of cellularity in pleural and ascitic/peritoneal fluids defined by the CLSI (AFs, number of NE-XE-5000 or PMN-BF ≥ 250 cells/µL; PFs, percentage of NE-XE-5000 or PMN-BF or MN-BF ≥ 50%) 1 or instrument-specific cutoffs identified by means of ROC curve analysis.
Rules of Reflex Test
The presence of morphological flags (i.e., WBC abnormal scattergram), along with DIFF scattergram analysis and data obtained for HF-BF and EO-BF, was then used to define a set of rules for assisting the validation of automated analysis of body fluids, activating reflex tests when needed (i.e., optical cell counting or differentiation using cytospin slides), and validating the use of this approach in routine diagnostics of body fluids. The scattergrams were assessed using the same criteria as for complete blood cell (CBC) count. The following criteria were then used for establishing the positivity of the OM count and differentiation on cytospin slides:
Presence of bacterial flora and/or mycetes
Smudge cells ≥ 20%
Abnormal cells count > 5% (i.e., morphologically aberrant elements and cells with specific peculiar characteristics such as lipophages, erythrophages, activated MESOs, etc.)
Cancer cells count ≥ 1% (including blasts)
Cell agglutination
The performance of validation rules was evaluated against OM analysis by calculation of diagnostic concordance, sensitivity, specificity, Pearson’s chi-squared test (χ2), and Cohen’s kappa coefficient of agreement. The statistical analysis was performed with Analyse-it for Microsoft Excel (Analyse-it Software, Ltd., Leeds, UK).
Microbiological Testing
Microscopic examination was performed on Gram-stained direct smears of pleural and peritoneal fluids according to standard procedures. The matrix-assisted laser desorption/ionization (MALDI)–time-of-flight (TOF) technique (VITEK MS, bioMérieux, Marcy-l'Étoile, France) was used for the identification of positive cultures. Chemosensitivity testing was carried out using the automated microdilution method (VITEK2, bioMérieux).
Cytologic Examination
Samples were fixed with Cytolyt hemolytic and preservative solution (Hologic, Inc., Marlborough, MA). Cells were spun at 1500 rotations/min and the sediment transferred in PreservCyt solution (Cytyc Corporation, Marlborough, MA) to be processed with the T5000 automated processor according to the manufacturer’s recommendation (Hologic). The resulting slide was fixed in 95% ethanol and stained with the Papanicolaou method. The remaining material was stored in PreservCyt solution for possible later use in the preparation of additional slides for further investigations, including immunocytochemistry, molecular diagnosis, and flow cytometry. All specimens were classified as adequate or inadequate cytological material by a cytopathologist. Samples with adequate classification were further categorized as (1) negative, (2) atypical, (3) suspicious, or (4) malignant.
The study was carried out in accordance with the Declaration of Helsinki, under the terms of all relevant local legislation.
Results
Due to heavy cell deterioration, the TNC by OM count could not be performed in five AF samples. Therefore, the agreement of cell counting between XE-5000 and OM was studied in 179 samples, with a total cellularity ranging from 8 to 18,560 TNC/µL (median, 1940 TNC/µL; 95% confidence interval [CI], 888–2900 TNC/µL). Eighteen samples were also excluded from morphological analysis for technical reasons (i.e., insufficient sample, unreadable cytospin slide, etc.). Therefore, the agreement of the cell differentiation between XE-5000 and OM was assessed in 161 samples (130 AFs and 31 PFs). The number of positive samples according to the CLSI standard was 60/161 (37.3%) with OM analysis.
Correlations
The comparison of the TNC count between XE-5000 and OM (TC-BF vs OM-TNC) was as follows: Pearson’s correlation r = 0.98 (p < 0.0001), Passing–Bablok regression y = 0.99x + 2.44 (95% CI of slope, 0.96–1.02; 95% CI of intercept, –5.66 to 9.43), and Bland–Altman bias 32.3 (95% CI, –119.0 to 54.7) ( Fig. 1A,B ). The correlations between XE-5000 and OM for the different cell populations are listed in Table 1 , with Pearson’s correlation coefficients always comprised between 0.77 and 0.98 (all p < 0.001).
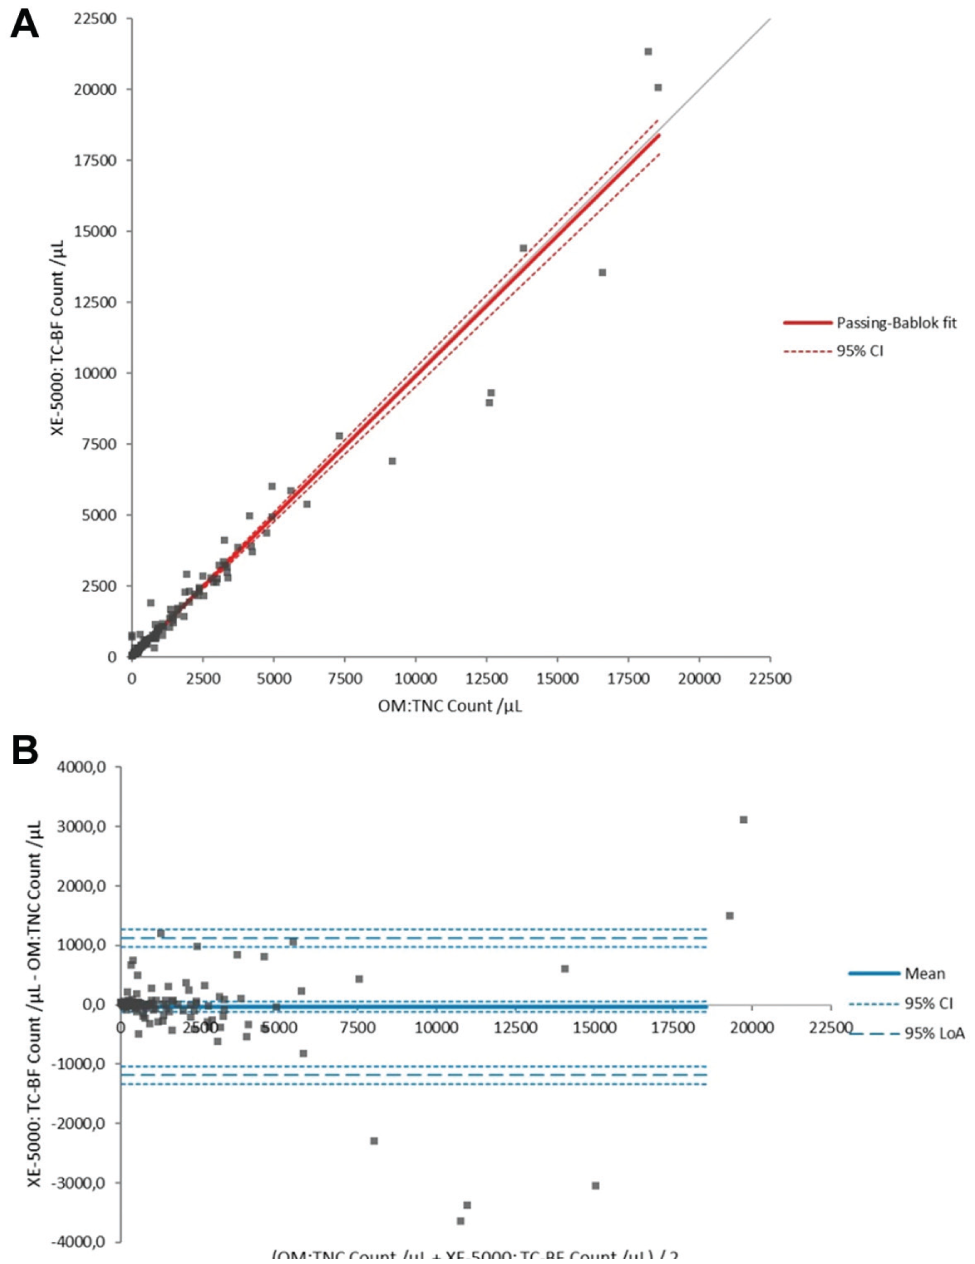
Comparison of cell counts with manual optical method (OM-TNC) and automated technique (TC-BF) in all samples. (
Pearson Correlation, Passing–Bablok Regression, and Bland–Altman Bias for Different Cell Categories in Optical Microscopy (OM) vs XE-5000 Automated Count in Body Fluids (BF). a
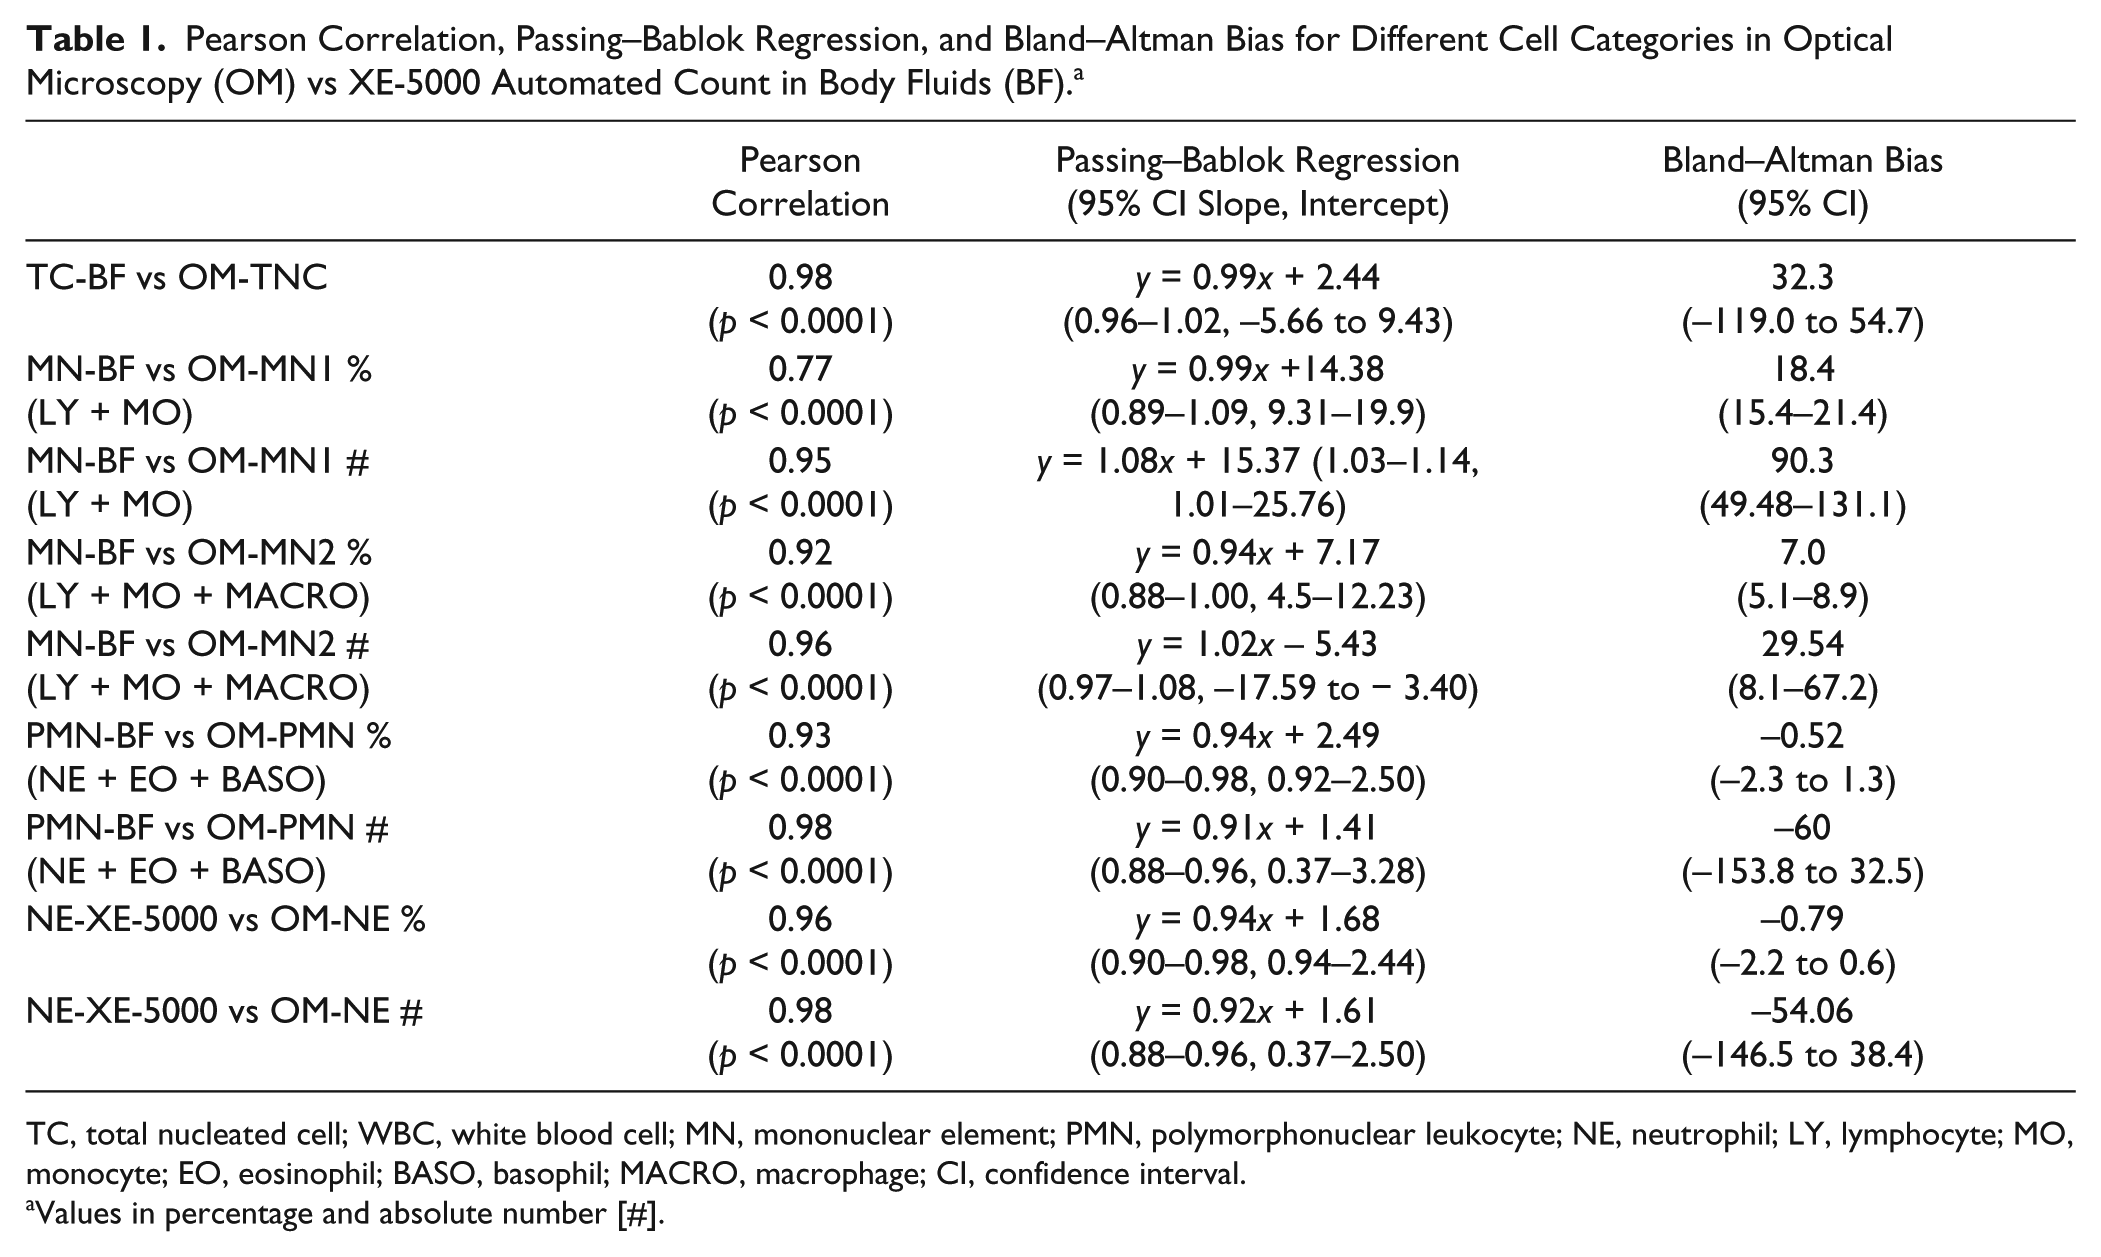
TC, total nucleated cell; WBC, white blood cell; MN, mononuclear element; PMN, polymorphonuclear leukocyte; NE, neutrophil; LY, lymphocyte; MO, monocyte; EO, eosinophil; BASO, basophil; MACRO, macrophage; CI, confidence interval.
Values in percentage and absolute number [#].
Diagnostic Concordance
As regards the diagnostic concordance of XE-5000 in the 130 AFs, the area under the curve (AUC) was 0.98 (95% CI, 0.96–1.00; p < 0.0001) for PMN-BF and 0.99 (95% CI, 0.97–1.00; p < 0.0001) for NE-XE-5000, respectively. When a cutoff of 250 cells/µL for both PMN-BF # and NE-XE-5000 # was used, the diagnostic concordances compared to OM were 94% and 95%, respectively. More specifically, 122 out of 130 samples were correctly classified using PMN-BF # (three false negative and six false positive results, 0.87 sensitivity and 0.96 specificity), whereas 123 out of 130 samples were correctly classified using the calculated parameter NE-XE-5000 (two false negative and six false positive results; 0.86 sensitivity and 0.97 specificity) ( Table 2 ).
ROC Analysis of Different XE-5000 Parameters in Ascitic (AF) and Pleural (PF) Fluids.
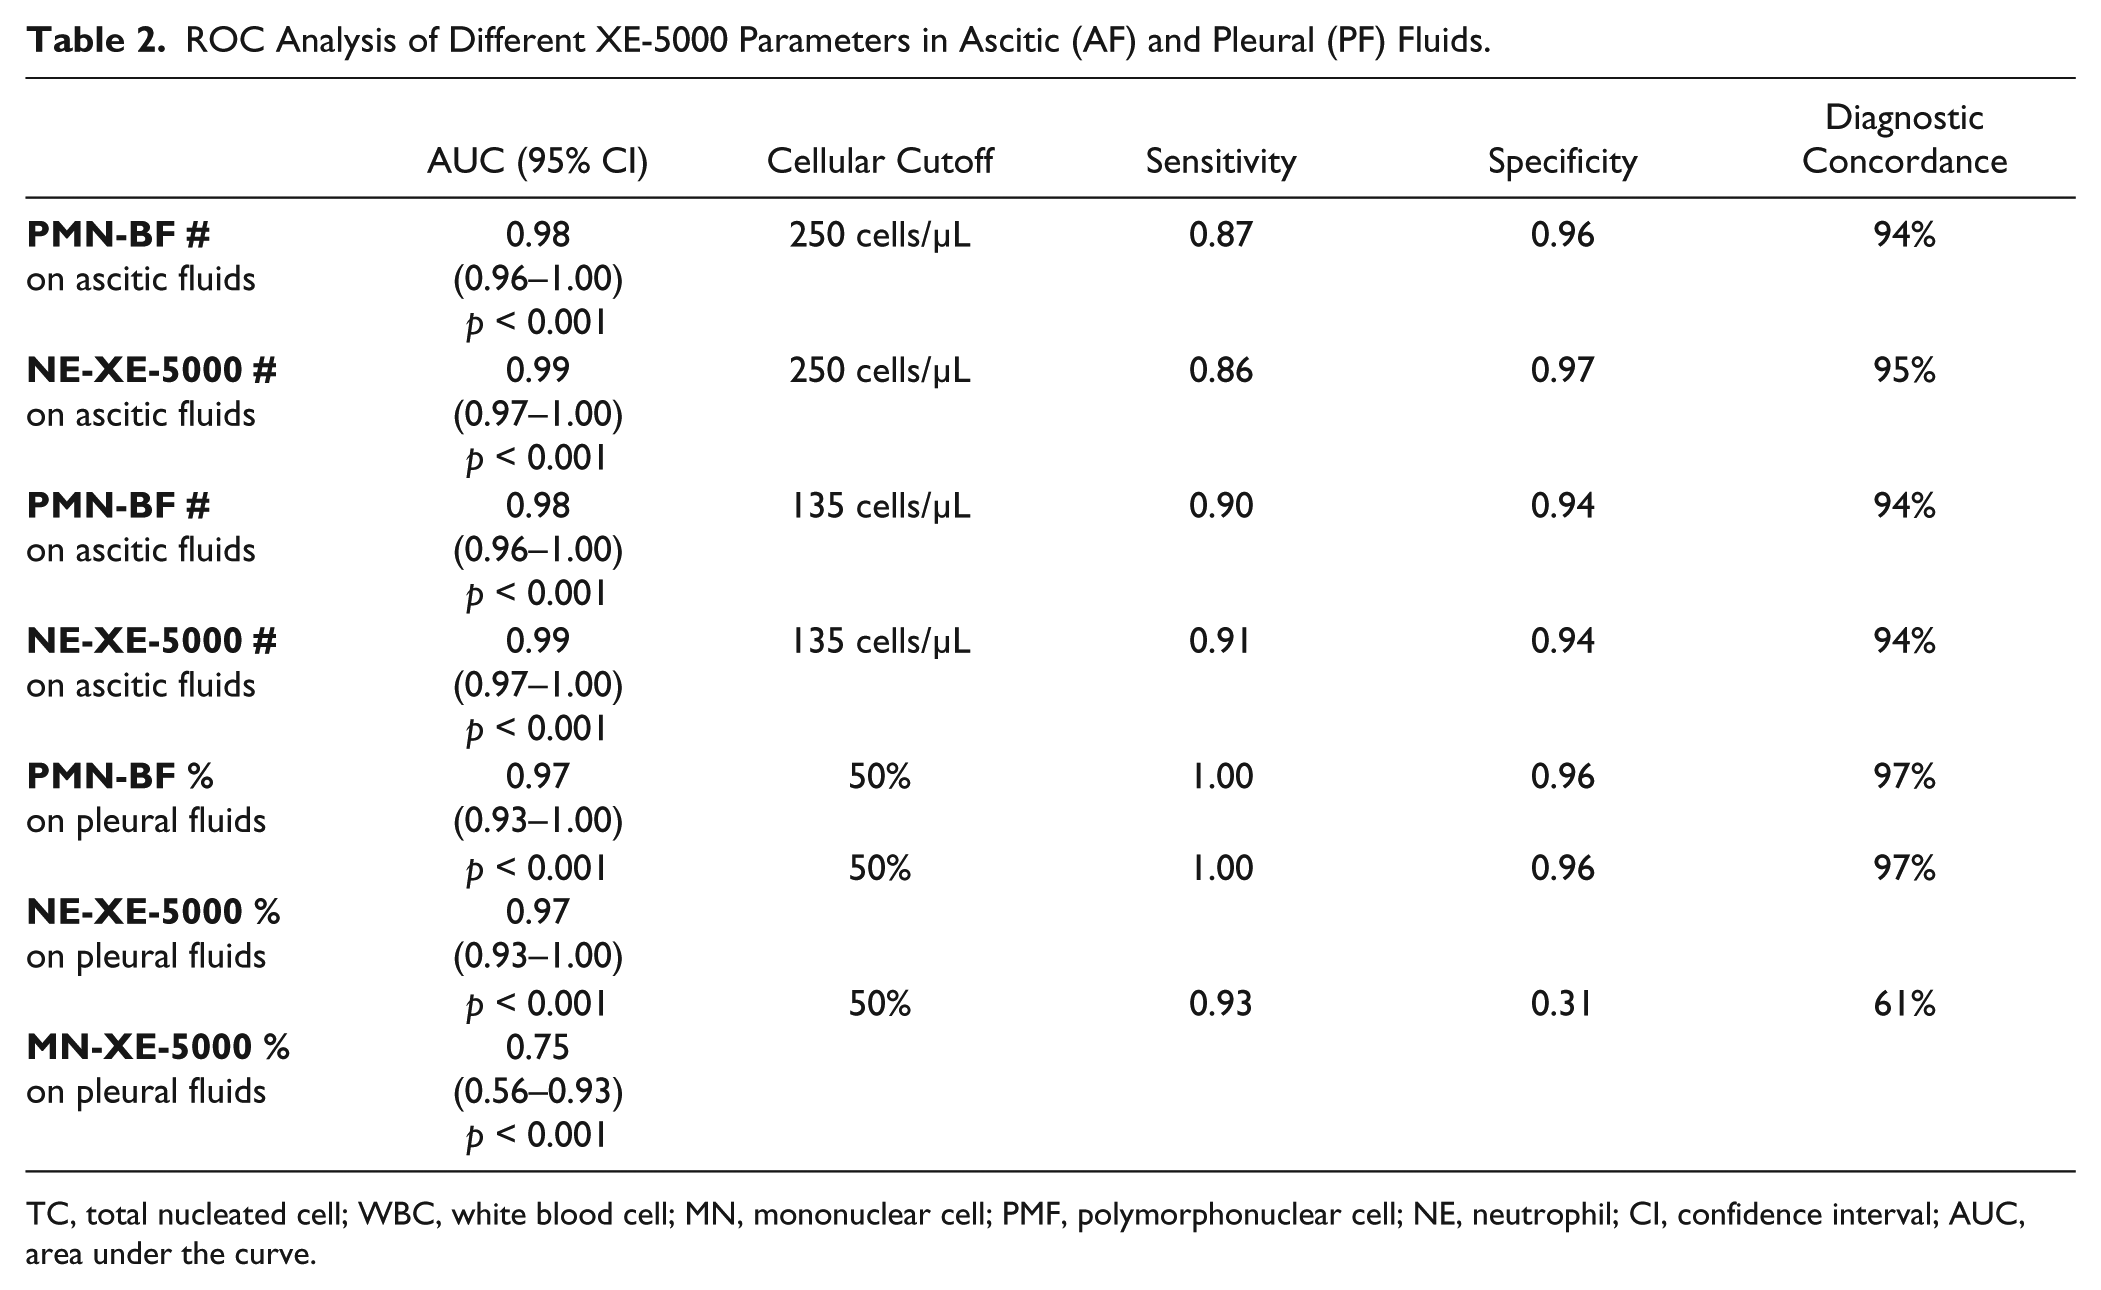
TC, total nucleated cell; WBC, white blood cell; MN, mononuclear cell; PMF, polymorphonuclear cell; NE, neutrophil; CI, confidence interval; AUC, area under the curve.
An instrument-dependent threshold of 135 cells/μL could hence be identified with ROC curve analysis for both PMN-BF and NE-XE-5000. When this threshold was used, both parameters exhibited an identical diagnostic concordance of 94%, with 1.00 sensitivity for both, 0.90 specificity for PMN-BF (nine false positive results), and 0.91 specificity for NE-XE-5000 (eight false positive results) ( Table 2 ).
As regards the diagnostic concordance of XE-5000 in the 31 PFs, the AUC was 0.75 (95% CI, 0.56–0.93; p < 0.0001) for MN-BF % and 0.97 (95% CI, 0.93–1.00; p < 0.0001) for both PMN-BF % and NE-XE-5000 ( Table 2 ). When a cutoff of 50% cellular elements was used, the diagnostic concordance for MN-BF %, PMN-BF %, and NE-XE-5000 % were 61%, 97%, and 97% compared to OM. In particular, 19 out of 31 samples were correctly classified with MN-BF % (1 false negative and 11 false positive results; 0.93 sensitivity and 0.31 specificity), whereas 30 out of 31 samples were correctly classified with both PMN-BF % and NE-XE-5000 % (1 false positive result; 1.00 sensitivity and 0.96 specificity) ( Table 2 ).
Reflex Testing Rules
The number of HF-BF was correlated with the number of MESO and/or cancer cells identified with OM analysis. The resulting Spearman’s correlation was r = 0.70 (p < 0.0001) for both absolute values and percentage. The ROC curve analysis of HF-BF compared to OM analysis of cytospin slides yielded AUCs of 0.75 (95% CI, 0.61–0.79; p < 0.0001) for HF-BF # and 0.59 (95% CI, 0.48–0.68; p < 0.0001) for HF-BF %, respectively. Using a conventional cutoff of 50 cells/µL, the diagnostic concordance, sensitivity, and specificity of HF-BF # were 73%, 0.49, and 0.90, respectively.
According to these results, we developed the following validation rules for automated TNC enumeration and further cell differentiation:
Rule 1: In the presence of WBC abnormal scattergram, perform OM analysis and further cell differentiation on stained cytospin slides.
Rule 2: In the presence of HF-BF ≥ 50 cells/µL (the best cutoff with the ROC analysis evaluation of the sensitivity and specificity above described), perform OM analysis on stained cytospin slides.
Rule 3: In the presence of EO > 10%, perform OM analysis on stained cytospin slides.
Rule 4: In the presence of abnormal WBC-DIFF scattergram, even without the WBC abnormal scattergram flag, perform OM analysis and further cell differentiation on stained cytospin slides.
The application of these rules yielded the following diagnostic performance: diagnostic concordance of 92%, sensitivity of 1.00, specificity of 0.84, a Pearson’s chi-squared test of 116.33 (p < 0.0001), and a Cohen’s kappa coefficient of 0.84 (p < 0.001).
Setting Reflex Testing Rules on XE-5000 and Their Application for Clinical Screening
A full cytological examination was performed in 111 of the total number of samples (88 ascitic and 23 pleural samples), whereas microbiological testing was carried out in 132 samples (108 ascitic and 24 pleural samples). Overall, 38 out of 151 samples were obtained from patients with hepatocellular carcinoma (HCC), whereas the remaining 113 samples were collected from patients undergoing paracentesis drainage after surgery or cirrhosis-induced ascites.
The cytologic examination performed on ascitic fluids did not reveal neoplastic cells (87 negative samples out of 88), with the notable exception of a single case in which atypia and cell necrosis was observed. This case also tested positive with both rule 1 (presence of WBC abnormal scattergram) and microbiological testing (presence of Escherichia coli).
A complete bacterial culture test was available for 33 samples of ascitic fluids (out of 48) with PMN-BF > 250 cells/µL, and 16 of them (49%) tested positive for the following pathogens: 9 samples with Enterococcus faecium, 2 with E. coli, 3 with mixed bacterial flora, and 2 with Candida albicans.
On XE-5000, 63 samples of ascitic fluids were positive at the instrument-specific cutoff (PMN-BF > 135 cells/µL). The following bacterial culture test (available for 44 specimens) yielded the following results: 23 samples (53%) were positive for E. faecium, 4 for E. coli, 2 for E. faecium and Klebsiella pneumonie, 3 for mixed bacterial flora, 2 for C. albicans, 1 for Enterecoccus faecalis, and 9 were negative.
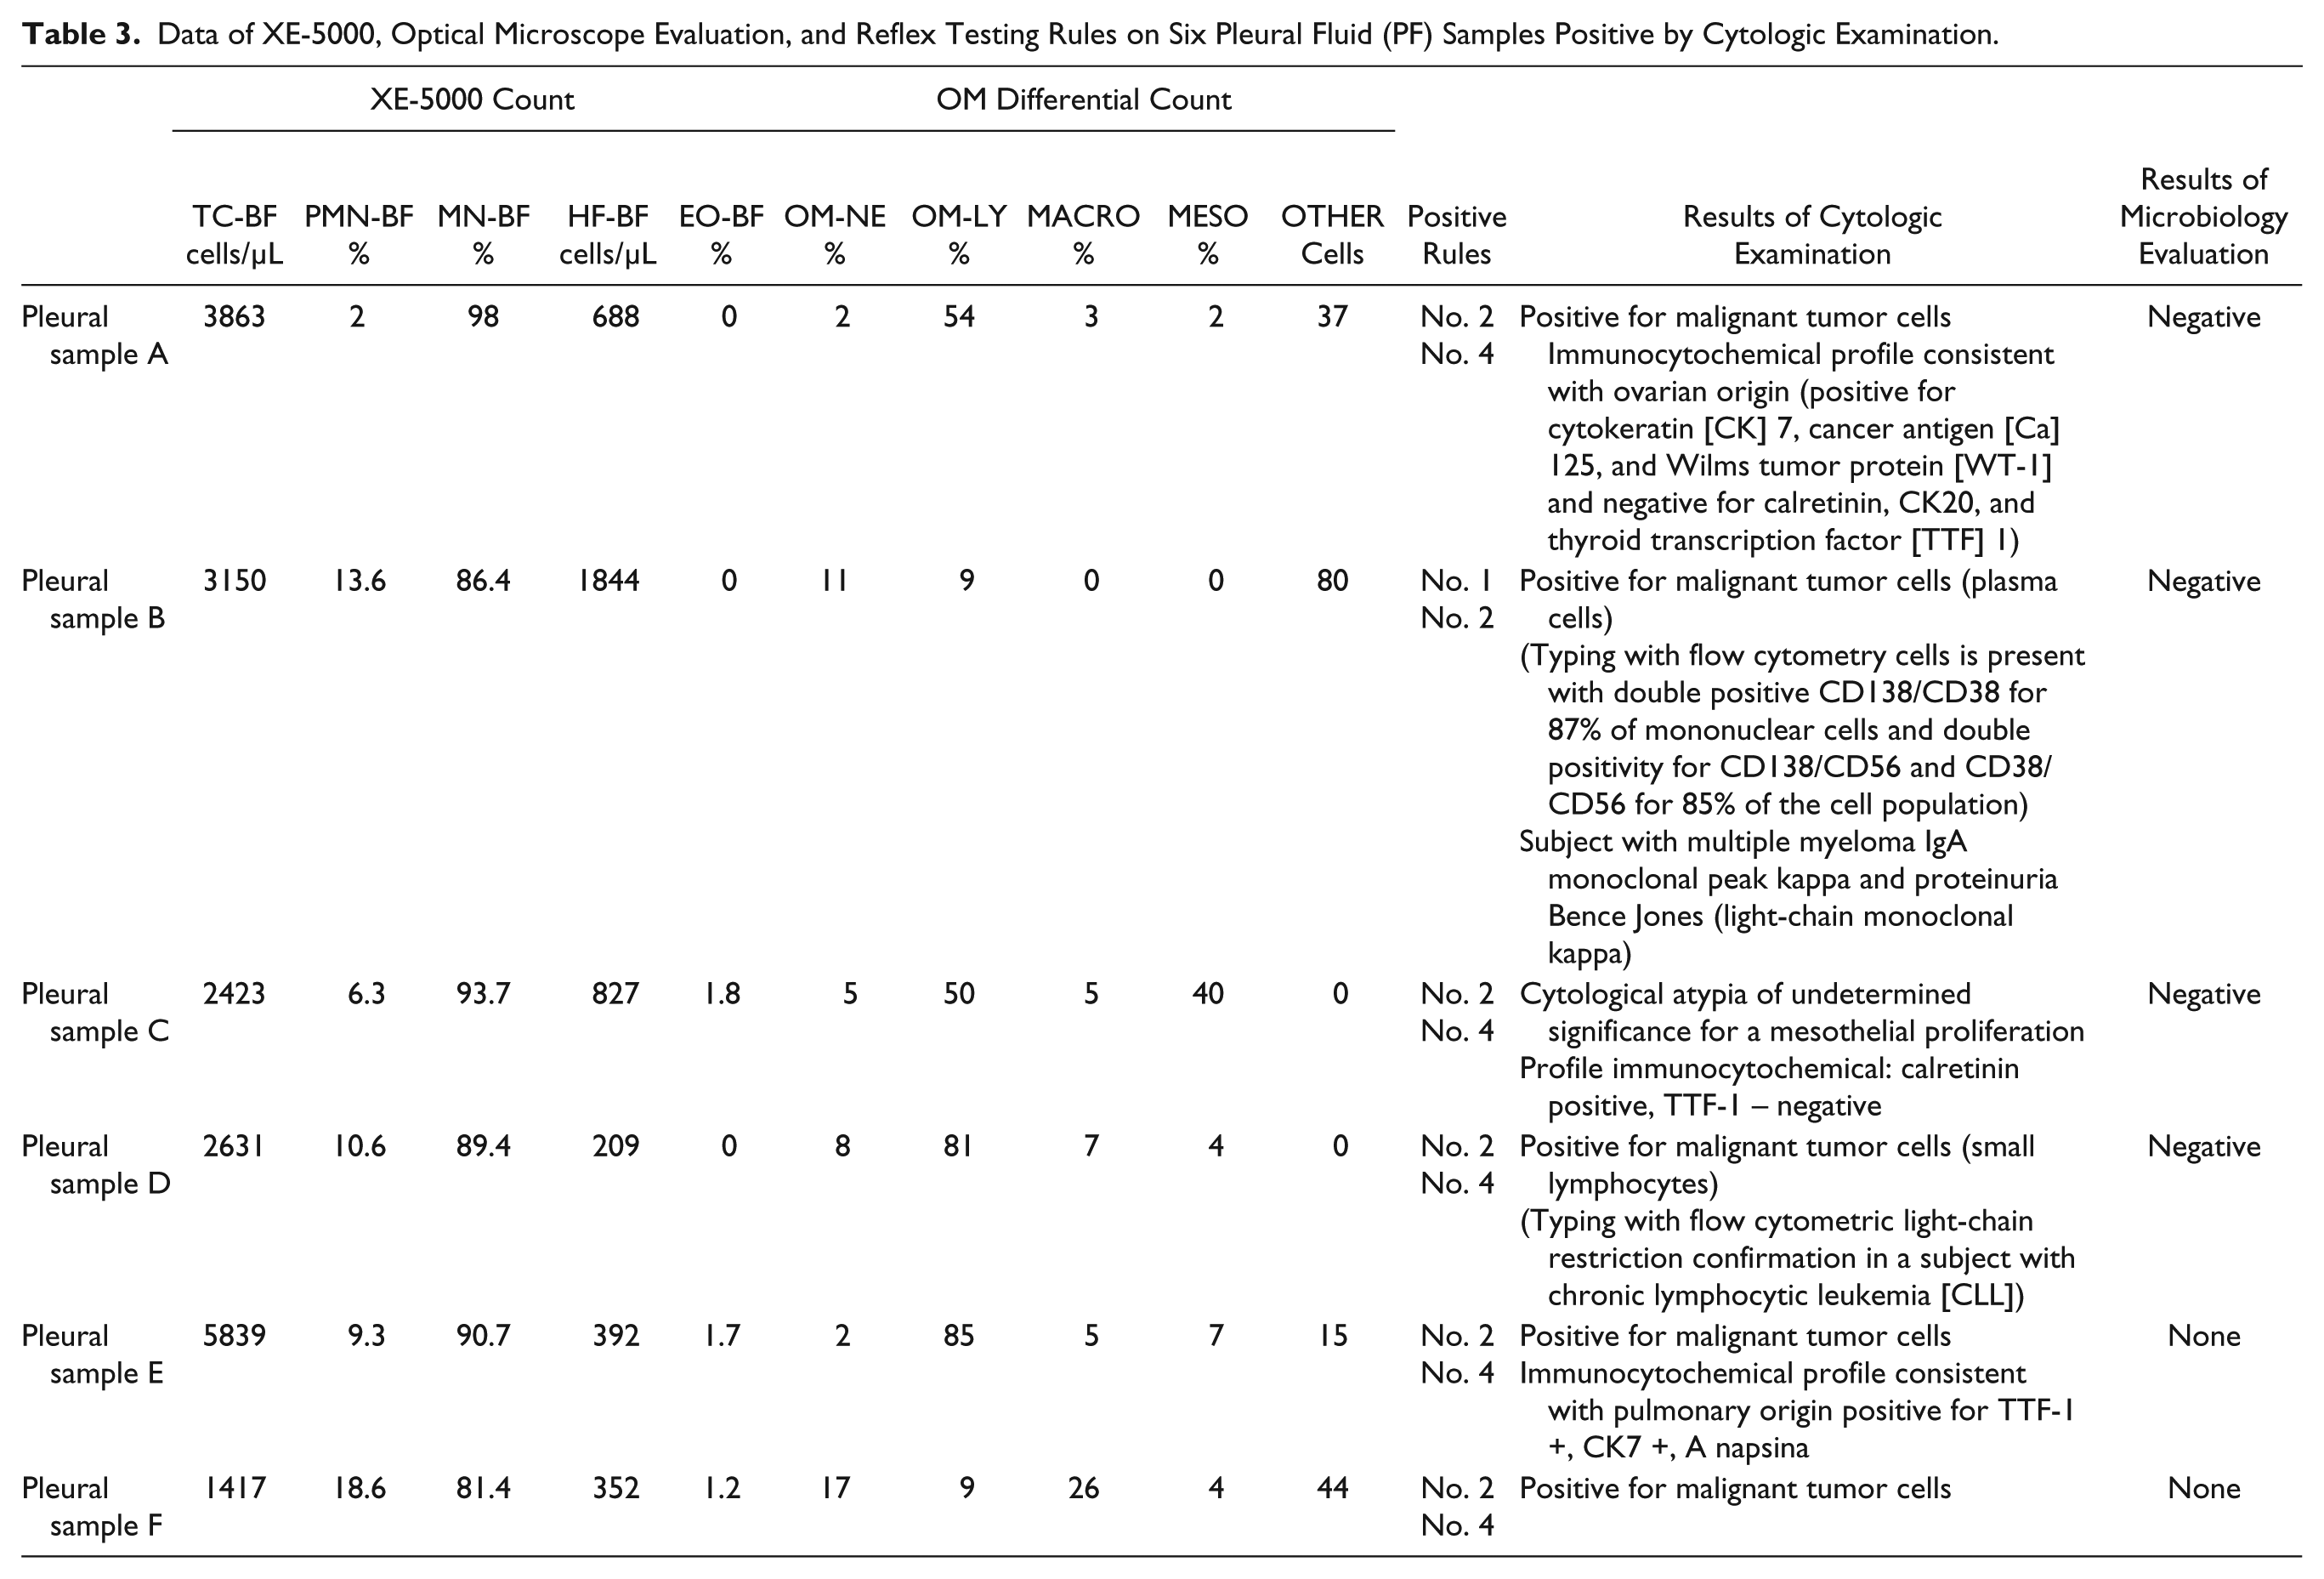
We evaluated 31 samples of pleural fluids and 22 of them showed a TC-BF of >1000 cell/µL; 6 of them were positive with cytologic examination and diagnosed as follows: metastasis from undifferentiated ovarian carcinoma, plasma cell infiltrates, localized chronic lymphoproliferative disorder, malignant mesothelioma, and two pulmonary carcinomas. All samples were positive for the suggested set of reflex testing rules (see Table 3 ).
Data of XE-5000, Optical Microscope Evaluation, and Reflex Testing Rules on Six Pleural Fluid (PF) Samples Positive by Cytologic Examination.
In the remaining 16 of 22 pleural samples with positive testing, 6 of them showed a PMN-BF count of >50%, with microbiological culture being positive in 3 of these (50%; 1 E. coli, 1 Staphylococcus aureus, and 1 C. albicans).
On XE-5000, nine samples of pleural fluids showed an MN-BF count of >50%, which was confirmed by OM-LY in four of them. The last five samples were positive for rule 2. Interestingly, one sample exhibiting EO-BF of 5.6% and HF-BF of 212 cells/µL by XE-5000 was reclassified as positive 1 after microscopic evaluation since it displayed an EO count of 23% by OM. Another sample, which was positive using rule 3 (EO-BF 33.6%), was reconfirmed as positive with OM.
Discussion
In agreement with previous data,4–13 the results of this study confirm the strong correlation of the TNC counts between XE-5000 and OM in body cavity fluids. The evaluation of differential count also exhibited a satisfactory performance compared to OM, in particular for both PMN-BF and NE-XE-5000, as shown in Table 1 . Interestingly, although the comparison of cell identification with XE-5000 and OM showed a lack of correlation between MN-BF and lymphocytes in OM (data not shown), this parameter was strongly associated with OM-MN1 (LY + MO), and an even better correlation was found with OM-MN2 (LY+MO+MACRO) ( Table 1 ).
The overall performance of the MN-BF parameter, as a percentage or an absolute, is apparently lower, exhibiting clear trends of nonlinearity and overestimation ( Table 1 ). This is attributable to the fact that MN-BF % include a variety of cells, namely, LYs, MOs, and MACROs.
The parameter MN-BF % is characterized by a modest diagnostic performance in PF samples, with an AUC that is much lower than those of both PMN-BF % and NE-XE-5000 % (i.e., 0.75 vs 0.97). Conversely, PMN-BF and NE-XE-5000 at the conventional 250 cells/μL threshold 1 showed much better diagnostic performance in AF samples, which could be further improved by introducing an instrument-specific cutoff (i.e., ≥135 cells/μL). Using the same instrument-specific cutoff, the percentage of positive cultures increased to 53%, in agreement with the practical guidelines of the American Association for the Study of Liver Diseases (AASLD). 27
The results of this study also confirm the well-known inclination of XE-5000 to classify as HF-BF both MESO and nonleukocyte cells of probable neoplastic origin, as earlier described.5,6,10,13 This is valuable information for screening purposes, as well as for the definition of validation rules for automated cell counting and activating reflex testing. In fact, HF-BF, when expressed as absolute value, is characterized by an AUC of 0.75 compared with OM for pathological cell identification. Therefore, the inclusion of this parameter in validation rules may contribute to define a new set of acceptance rules for automated analysis of body fluids, exhibiting a high diagnostic agreement with OM.
Taken together, these findings are in support of routine use of XE-5000 for automated cell counting and morphologic differentiation of nucleated elements in pleural and ascitic fluids according to the CSLI standard 1 and the most recent guidelines of the International Society for Laboratory Hematology (ICSH). 26 The WBC-DIFF scattergrams, with clearly defined clusters, allow a reliable quantitative analysis of leukocyte population, especially polymorphonuclear leukocytes and NEs, but not mononuclear cells. 1 Even more importantly, the definition of validation rules and related reflex tests for automated cell counting has contributed to further improve the diagnostic performance of this analyzer. This would provide an effective support to morphological analysis and diagnostic classification of cells in body fluids. Moreover, the low imprecision of XE-5000 further validates its use for follow-up of patients, as enabled by a suitable framework of validation rules. Finally, the positive impact of this analyzer on the optimization of human and economic resources should not be discounted, as previously emphasized by Zimmermann et al. 4
In this study we have also demonstrated that the excellent performance of XE-5000 in cell counting and differentiation, combined with a set of rules for reflex testing of easy implementation, enables a better clinical interpretation of data obtained, thus consistently lowering TAT and costs. A paradigmatic example is represented by the faster diagnosis of metastatic cancer in the six PFs testing positive with instrumental analysis.
Footnotes
Declaration of Conflicting Interest
The authors declared no potential conflicts of interest with respect to the research, authorship, and/or publication of this article.
Funding
The authors received no financial support for the research, authorship, and/or publication of this article.