
Abstract
This article presents a simple weighing method for spherical cells to avoid the high cost of correlated devices in traditional cell-weighing methods. In this method, the constant falling speeds of the spherical objects in liquid are derived to estimate their masses online. Using this method, the detected density of one type of microbead is highly in accordance with the known value. This method is proved to be capable of detecting tiny variations of the cell mass (at least within 1% of the cell mass). Finally, the proposed method is applied in nuclear transplantation operations, and, for the first time, the proper amount of the removed cytoplasm in porcine enucleation is estimated. The proposed method is able to weigh cells with a success rate of 92% at an average speed of 22 s/cell, and it can be performed on traditional microoperation systems, which makes it easily applicable in biological applications.
Keywords
Introduction
Cell weighing has great potential applications in cell biology and diagnosis.1,2 For example, high-speed cell detection method is expected to be applied in the target cell selection in the biomedical area. Cell weighing can also quantify the amount of materials injected into or removed out of the cells in some cellular microoperations, such as embryo microinjections3–5 and oocyte enucleations.6,7
Cell weighing is a challenging task because the cells usually have very small sizes (with diameters of 1–200 µm) and need to be cultured in a liquid environment. At present, few kinds of cell-weighing methods are available according to the references. Biologists usually dry the solution containing cells and weigh the remaining content to estimate the dried mass of the cells. 8 However, this method is very rough and cannot measure the masses of individual cells. Recently, microcantilevers have been used to measure the masses of cells, through detection of the shift in their resonance frequencies9–11 when the cells pass over the beam, because it is highly sensitive to the mass variations of the microcantilevers. This type of method achieves high sensitivities and operation speeds. However, the requirement of expensive special devices, such as the resonators and microchannels, makes this method difficult to be used in the traditional cellular biological applications. Recently, a new method based on the transillumination microscope imaging technique has been presented. 12 This method enables three-dimensional measurement of cellular refractive index and dry mass density, and has been used to detect the mass of the red blood cells. However, it is not appropriate to detect cells with poor optical transparency, such as mammalian oocytes or embryos.
According to Stokes’ law, 13 when a spherical object is released in an infinite culture medium, it first accelerates, and then falls at a constant speed. This constant speed has a linear relationship with the density difference between the object and the liquid environment. Hence, the mass density and, subsequently, the mass of the spherical cell can be calculated through its constant falling speed. However, the constant speed detection is still a challenging task at present.
The side view objective lens 14 can be used to observe the cell-falling process and, subsequently, calculate the constant falling speed. However, equipment of the side view objective lens usually involves many other attached works, such as adjustments of the optical path of the microscope and upgrading cell-culturing devices, which will create many issues for the system setup. In general, the constant falling speed of a cell can be derived through the variation of its defocus lengths or depth information. In fact, the defocus length detection has been a research focus in recent years, 15 especially in the areas with the requirement of motion control of tools in the Z-axis direction. At present, these research efforts basically focus on some specific operational tools, such as the micropipettes. Their one-dimensional shapes make them perfect subjects for defocusing imaging models. 16 However, for objects with spherical shapes such as cells and molecules, these imaging models are not appropriate to obtain their depth information.
Previously, we presented a defocus length derivation method based on template matching 17 to estimate the depth information of the spherical objects. 18 This method is proved to be able to detect the defocus length accurately when it is in the range of 0–100 µm. However, when cells fall into this range, the infinite liquid environment assumption does not exist for cells with relatively large sizes, such as domestic oocytes or embryos. Hence, the derived falling speeds of these cells in this range cannot be used to estimate their masses.
In this article, another cell-weighing method for spherical cells is proposed on a traditional microoperation system. In this method, the target cell is immobilized by two common injection micropipettes (IMs), moved up to a certain height, and released. During the falling process, the constant falling speed of the cell is derived through a novel detection method based on the constant falling height intervals.
Materials and Methods
System Setup
The proposed cell-weighing method is performed by the NK-MR601 microoperation system, which was developed in our laboratory. It has a similar construction to that of other reported microoperation systems in Refs. 19–22.
As show in Figure 1 , this system consists of an inverted microscope (CK-40; Olympus, Tokyo, Japan), a CCD (W-V-460; Panasonic, Osaka, Japan) for microscope image gathering at the highest speed of 30 frame/s, an in-house developed motorized X-Y microplatform (with a travel range of 100 mm, a maximum speed of 2 mm/s, and a repeatability of ±1µm) for cell positioning, a pair of X-Y-Z micromanipulators (with a travel range of 50 mm, a maximum speed of 1 mm/s, and a repeatability of ±1 µm) for positioning the IMs, an autofocus mechanism to adjust the position of the objective lens in the Z-direction (see Fig. 1C ), and a host computer for the microscopic image processing and motion control of the aforementioned platform and manipulators.
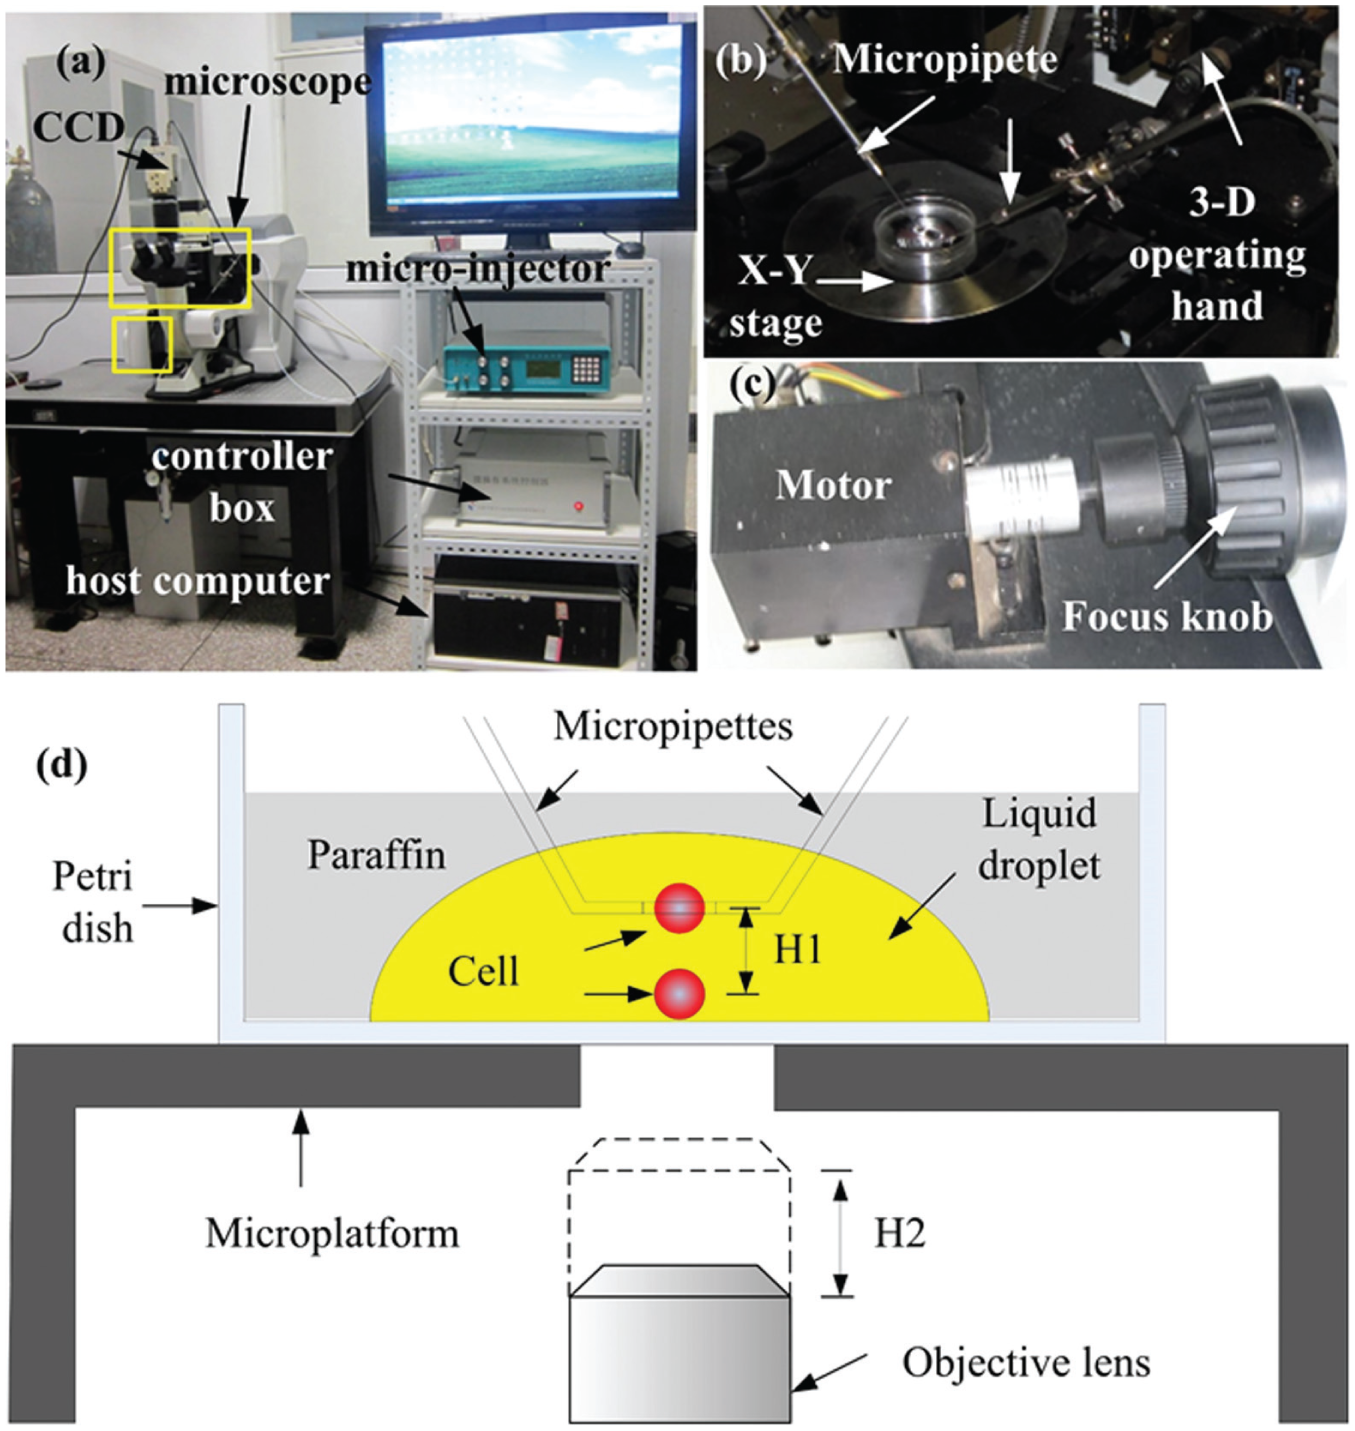
NK-MR601 microoperation system setup. (
A pair of common IMs with a diameters of 2–3 µm are prepared to operate on the cells. These micropipettes are made from borosilicate glass tubes with an outer diameter of 1 mm and an inner diameter of 0.8 mm. These tubes are first pulled by a micropipette puller (MODEL P-97, Sutter Instrument, Novato, CA) and then fractured by a microforge (MF-900; Narishige, Tokyo, Japan) to generate the required outer diameters. Subsequently, they are bent by 45° through the microforge and mounted on the two micromanipulators, separately. Prior to the conduct of the cell-weighing experiments, the micropipettes are treated with 5% trypsin solution for half an hour, cleaning the micropipettes sufficiently and removing any contaminants from them. This will prevent the cell from adhering to the micropipettes and failing to fall down from the micropipettes in the experiments. Then, they are positioned horizontally parallel with the X-Y plane.
As shown in Figure 1D , a standard petri dish with a diameter of 35 mm is placed on the microplatform. In the middle of the petri dish, a culture medium droplet with a radius of about 5 mm is made. The cells are then placed in this droplet. The paraffin is added onto the petri dish to cover the culture medium droplet, preventing its evaporation. Furthermore, the two micropipettes are moved into the culture medium droplet to operate on the cells.
Principles of the Cell-Weighing Method Using Constant Falling Speed
According to Stokes’ law, the spherical object falling in an infinite liquid environment is affected by a friction force FV exerted by the liquid environment. This friction force is proportional to its falling speed V according to the following relationship:

where R0 is the radius of the object; and η is the dynamic viscosity coefficient of the liquid. Besides, the gravitational force G and buoyancy FF also affect the falling process of the object, which can be estimated according to


separately, where ρ1 is the density of liquid; g is the gravitational acceleration; and m is the mass of the spherical object. According to Newton’s second law and using equations 1–3, the acceleration of the cell can be derived according to
where ρ is the density of the cell.
According to equation 4, the released object in the liquid environment will accelerate initially, then fall at a constant speed. Setting a as zero in equation 4, the constant falling speed VC of the object can be derived based on

Using equation 5, the object density ρ can be estimated as follows:

Subsequently, object mass m can be derived through the derived ρ according to

Many cells, especially the animal oocytes/embryos, usually have spherical shapes. Compared with their sizes (with diameters of about 1–200 µm), the culturing solution droplet (with a radius of about 5 mm) can be basically considered as an infinite liquid environment. Hence, the densities of spherical cells can be derived according to equation 6. To achieve this, several important parameters in equation 6, such as R0, ρ1, and η, need to be derived first. Among these parameters, ρ1 can be measured through weighing a constant volume of culture medium, and R0 can be derived through an image-processing method. Therefore, the most challenging task is the calibration of η.
According to equation 6, η can be derived through the constant falling speed VC’ of a spherical object with a known density of ρ’ in the culture medium as follows:

In summary, the detection process of the cell mass can be divided into two processes:
Falling the spherical object in culture medium for medium-viscosity calculation
Falling the cell in culture medium for cell density calculation
It is not hard to find that the key of the above two processes is to derive the constant falling speed of the spherical object or cell.
Template-Based Matching Calibration of the Medium Viscosity
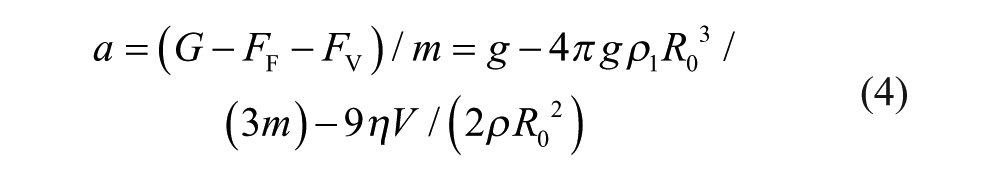
To calculate η, a resin-structured bead (NMPS1100; Suzhou Nano-micro Technology Co., Suzhou, China) ( Fig. 2 ) with a known density of 1.08 g/cm3 is chosen to perform the experiments in the culture medium.
Calibration of the friction coefficient method with a bead. (
As shown in Figure 2B , the vein of the bead is simple and basically centrosymmetric. Hence, it is appropriate to use the template-matching method 18 to obtain the depth information during the falling process and, subsequently, derive its constant falling speed. Figure 2A shows two different cases in which the bead has the same defocus length of Dc under a microscopy with the focus distance of DF. The derived microscopic images of the bead under two different cases are totally the same. Hence, the defocus length DC of the bead during the falling process can be derived through matching its microscope image with that of a defocus bead through lowering down the objective lens with known distances.
To achieve this, an image sequence of the bead with known defocus lengths is established through lowering down the objective lens evenly and capturing bead microscope images during this process (see Fig. 2A ). The movement control of the objective lens is performed by an autofocusing mechanism of our system (see more details in Fig. 1C ). The depth information of the bead in the image sequence is derived through the recorded position of the objective lens, which is provided by an encoder.
To perform the template-matching algorithm, a spherical contour detection algorithm is first executed to obtain the region of the bead (ROB), and the derived bead radius R0 and bead center O are shown in Figure 2B . Furthermore, the micropipettes moves close to each other to hold the bead. The distance between them, DY, is controlled to be less than the detected bead diameter (with a value of 1.8 times the bead radius in experiments), as shown in Figure 2B . To prevent bead falling from the two micropipettes during the lifting-up process, the two micropipettes are positioned a little lower than the center of the bead.
After the bead has been lifted up to a certain height H, the two micropipettes are moved far away from each other in the Y direction to release the bead. To eliminate the influence of the blur contours of the micropipettes to the template-matching results, this algorithm is activated when DY is detected to be more than 2*R0 (2.4*R0 in experiments) through the encoders equipped on the micromanipulators. During the falling process, a contour detection is performed to detect the blurred contour and the center of the bead, as shown in Figure 2C . Again, to eliminate the influences of the contours of the micropipettes, a rectangular area with width more than 2*R0 (133 µm in experiments) and height less than 2*R0 (83 µm in experiments) is selected to perform template matching, as shown in Figure 2C .
Furthermore, the constant falling speed of the bead is derived through the variation of the depth information DC during the falling process. Finally, η is derived through equation 8.
The Constant Falling Speed Detection Method for Cells Based on the Constant Falling Height Intervals
After calibration of the η, the density of the cell can be derived through its constant falling speed in the culture medium according to equation 8, which is introduced in details as follows.
The veins of cells, especially the domestic oocyte/embryos, are much more complex than those of the bead. Previous research demonstrates that the template-matching method can only provide accurate estimations of DC within the range of (0,100 µm). 18 Out of this range, the cell variations across microscopic images with different DC is not apparent enough for using the template matching to estimate the cell defocus length. When DC is in the range of (0,100 µm), the assumption of the infinite liquid environment is not satisfied, because the diameter of the porcine oocyte (about 150 µm) already has the same size with the range of DC. We observed that the falling speed of oocyte decelerates significantly in this range of DC. Hence, the detected variation of Dc using the template-matching algorithm cannot be used to estimate the cell mass anymore. Addressing this problem, we present a novel constant falling speed detection method based on the constant falling height intervals to measure the mass of the cell.
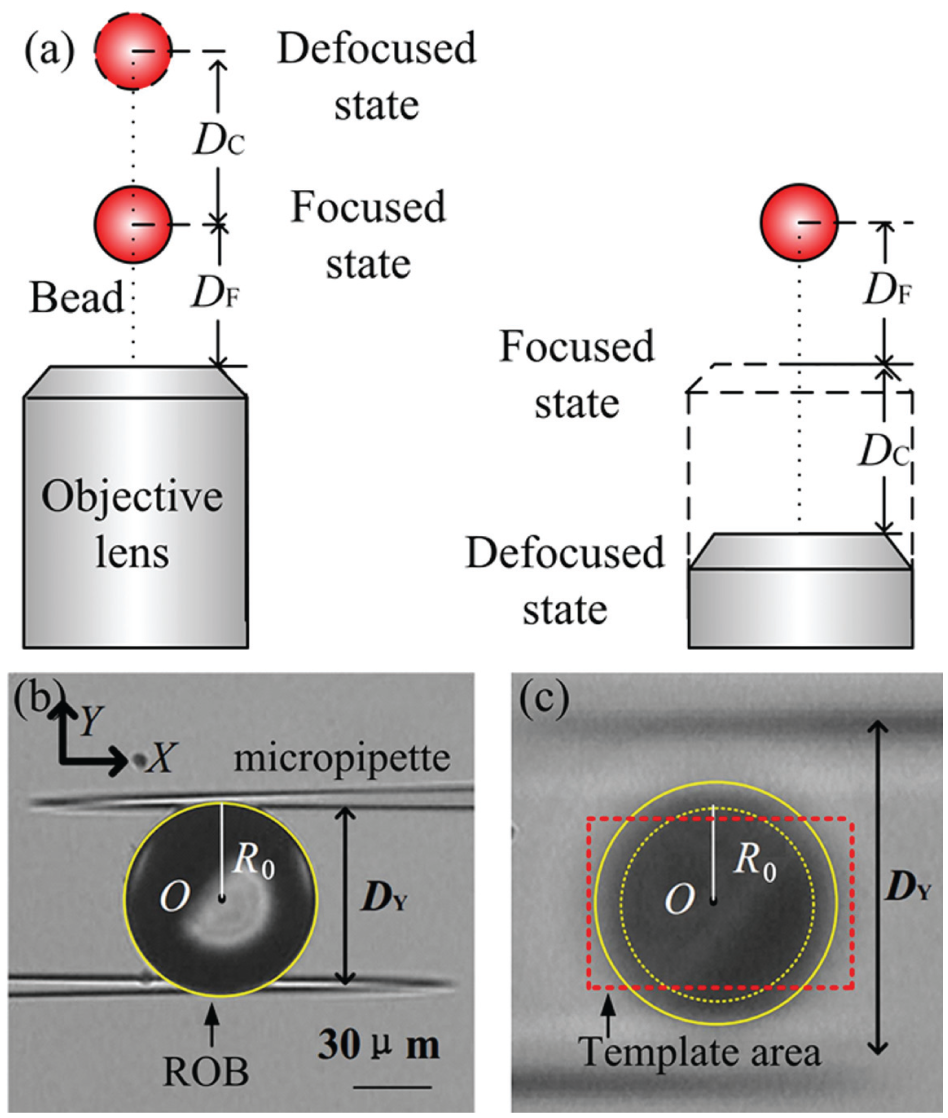
According to the previously falling experimental results of the bead, the falling process of the spherical object in the liquid can be divided into three stages: the accelerating stage, the constant speed stage, and the landing stage. According to equation 5, the falling speed of the same object is unchanged when it begins to fall down above a height that fulfills the infinite liquid environment assumption. Under this condition, the length of the accelerating stage, donated as HA, is also constant. The landing stage is the range of DC near the bottom of the petri dish in which the infinite liquid environment assumption is not satisfied anymore. In this area, the downward flows in the liquid caused by the falling spherical object are occluded by the bottom of the petri dish and return up, increasing the friction force of the liquid to the object and forcing it to decelerate. Also, when the constant falling speed is unchanged, theoretically, the length of the landing stage HL should be unchanged. Hence, the length of the constant speed stage has a linear relationship with the falling height of the cell H, when H > HL + HA. Based on this point, increasing H with constant intervals ΔH, the ratio between ΔH and the increased falling time ΔT tends to a constant value when H > HL+ HA (see Fig. 3 ). Therefore, VC of the cell can be estimated through this ratio.
Schematic: the principle of the constant speed detection method for cells based on constant falling height intervals.
According to the aforementioned analysis, the key step of this new cell-weighing method is the derivation of the falling time of the cell, donated as T, which can be calculated as

where TL and TF are the landing time point and the falling time point of the cell, respectively. The derivation processes of them are introduced as follows.
Similarly to the falling experiments of the bead, TF is determined when DY is detected as more than 2.4 times of the cell radius R0. The derivation process of R0 is shown in Figure 4 . First, the microscopic image of oocyte in the focus state is convolved with a low-pass Gaussian filter for noise suppression (see Fig. 4A ). Then, the Otsu adaptive thresholding method 23 is performed to get the binary image of cell, as shown in Figure 4B . Following that, a contour detection is performed in the binary image to obtain the cytoplasm contour as shown in Figure 4C . The oocyte center O and its cytoplasm radius RC are determined using the outfitting cycle of the detected cytoplasm contour as shown in Figure 4D . At the same time, the edge information of the cell is derived through the Canny edge detection algorithm in the binary cell image (see Fig. 4e ). Because the oocyte radius R0 is slightly larger than the cytoplasm radius RC, a Hough’s cycle detection algorithm is performed in the area out of the cytoplasm to estimate the contour of the zona pellucid. Finally, the oocyte radius R0 is determined as the radius of the detected spherical contour, as shown in Figure 4F .
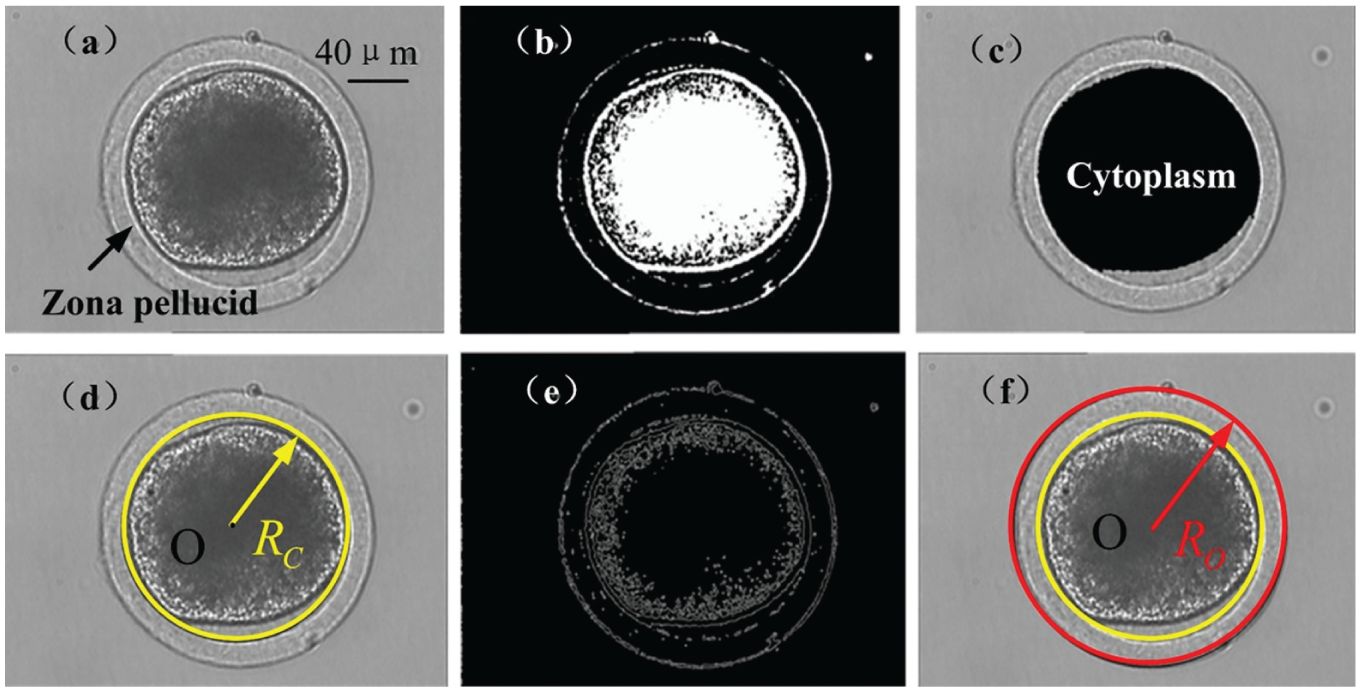
The derivation process of the oocyte radius. (
The defocus length of the cell stops varying when the cell lands on the bottom of the petri dish. Based on this point, a focus evaluation function is proposed to determine the landing moment TL:
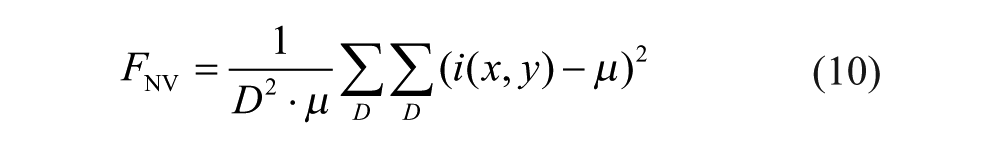
where i(x, y) is the gray value at the point (x, y) in the image; D is the detected diameter of the cell in the focus state; and µ is the average value of gray in the region area of cell (ROC), a selected square area with a center O and a width of D. Here, µ is calculated as

When FNV is detected as less than 0.01 in successive three frames of the microscopic images (with a capturing rate of 20 fps), the cell is considered to land on the bottom of the petri dish, as shown in
Results and Discussions
Falling Experiments on the Bead Using a Template-Matching Algorithm
Before the falling experiments on the bead are carried out, an image sequence of the bead with a different DC is established as shown in
The falling experiments on the bead are performed to estimate η as follows (see more details in
Four falling experiments are performed for one bead. Two experiments are performed in water to validate the detection accuracy of the cell-weighing method using template matching, whereas the other two are finished in the culture medium to detect the dynamic viscosity coefficient of culture medium. Figure 5 illustrates the derived DC of the bead in these four experiments.
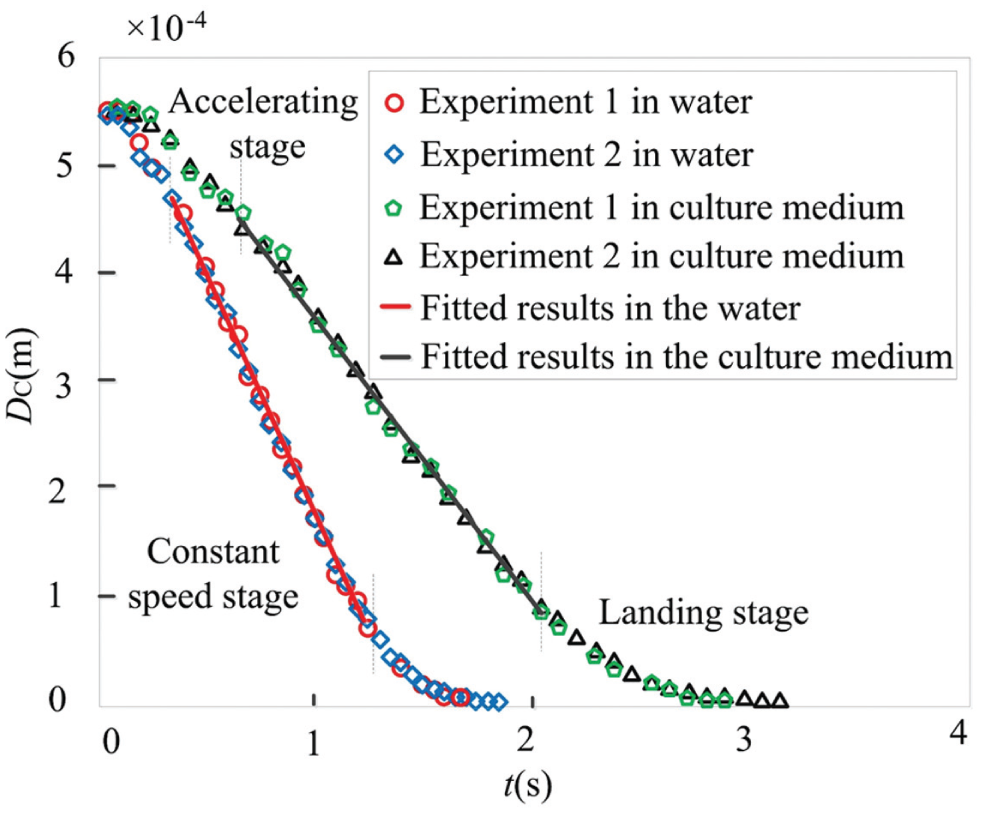
Falling experimental results of the bead.
According to Figure 5 , the detected falling height of the bead is about 560 µm, which is a little less than the lifting-up distance of the two micropipettes (600 µm). This difference is generated for two main reasons. First, as mentioned, the micropipettes are positioned lower than the center of the bead before lifting up. Hence, the factual falling height of the bead is less than the lifting-up distance of the micropipettes. Second, the depth information acquisition starts when DY ≥2.4*R0, which means the bead has fallen down by a certain distance. Considering the above two points, the falling height of the bead is basically in accordance with the factual one, which proves the effectiveness of the depth information acquisition method based on the template-matching algorithm.
Furthermore, the detected results of two falling experiments in the culture medium coincide very well, whether in water or the culture medium. Most importantly, an accelerating stage and a constant speed stage are observed during the falling process in Figure 5 . This is in accordance with the aforementioned analysis, thus proving the rationality of the proposed weighing method. Moreover, a landing stage in which the bead decelerates to zero is found in Figure 5 .
Using the slopes of the fitted lines in the constant speed stages, the constant falling speed of the bead in water is 453 µm/s. The dynamic viscosity coefficient and density of water at 20 °C are 1.002×10⁻³ Pa s and 998.12 kg/m3. The detected radius of the bead is 50.1 µm, which is very close to the average value provided by Suzhou Nano-micro Technology (50 µm). Using equation 6, the detected density of the bead is 1081.2 kg/m3. This result is very close to the provided value of 1080 kg/m3, and the relative error between them is only about 0.1%, which proves the validity of our bead-weighing method.
The detected constant falling speed of the bead in the culture medium is detected as 266 µm/s. Furthermore, the density of the culture medium is detected as 1008.2 kg/m3. The dynamic viscosity coefficient of the culture medium is calculated as 1.500×10⁻³ Pa s according to equation 7. This value is much larger than that of water at 20 °C. This is in accordance with the fact that the culture medium has many materials in it and has higher density than water.
Porcine Oocytes Weighing Experiments Using the Constant Falling Intervals
A number of weighing experiments on mature porcine oocytes (incubated for 2 days) are performed. The oocytes are prepared according to the standard process introduced in Ref.
24
. After the cells are placed into the liquid droplet, the system operates as follows (please see more details in
First, the micropipettes are moved to squeeze and immobilize the oocyte (
A total number of 10 oocytes are measured using the proposed method. To complete a total number of 80 falling experiments, 87 attempts are made. Hence, the success rate of this method is about 92% (80/87). Four failures were detected when the cell fell down during the lifting-up process. Three failures happened when the cell adhered to one micropipette and failed to fall after being released. Figure 6 shows the experimental results of one oocyte. According to Figure 6A , as H is increased, the increased falling time ΔT in each ΔH gradually becomes constant. The relationship between H and T becomes basically linear after H is larger than 200 µm according to Figure 6B . The above results demonstrate that the range of DC in the landing stage is not wider than 0–200 µm. Hence, VC can be derived through the ratio between ΔH and ΔT when H is larger than 200 µm.
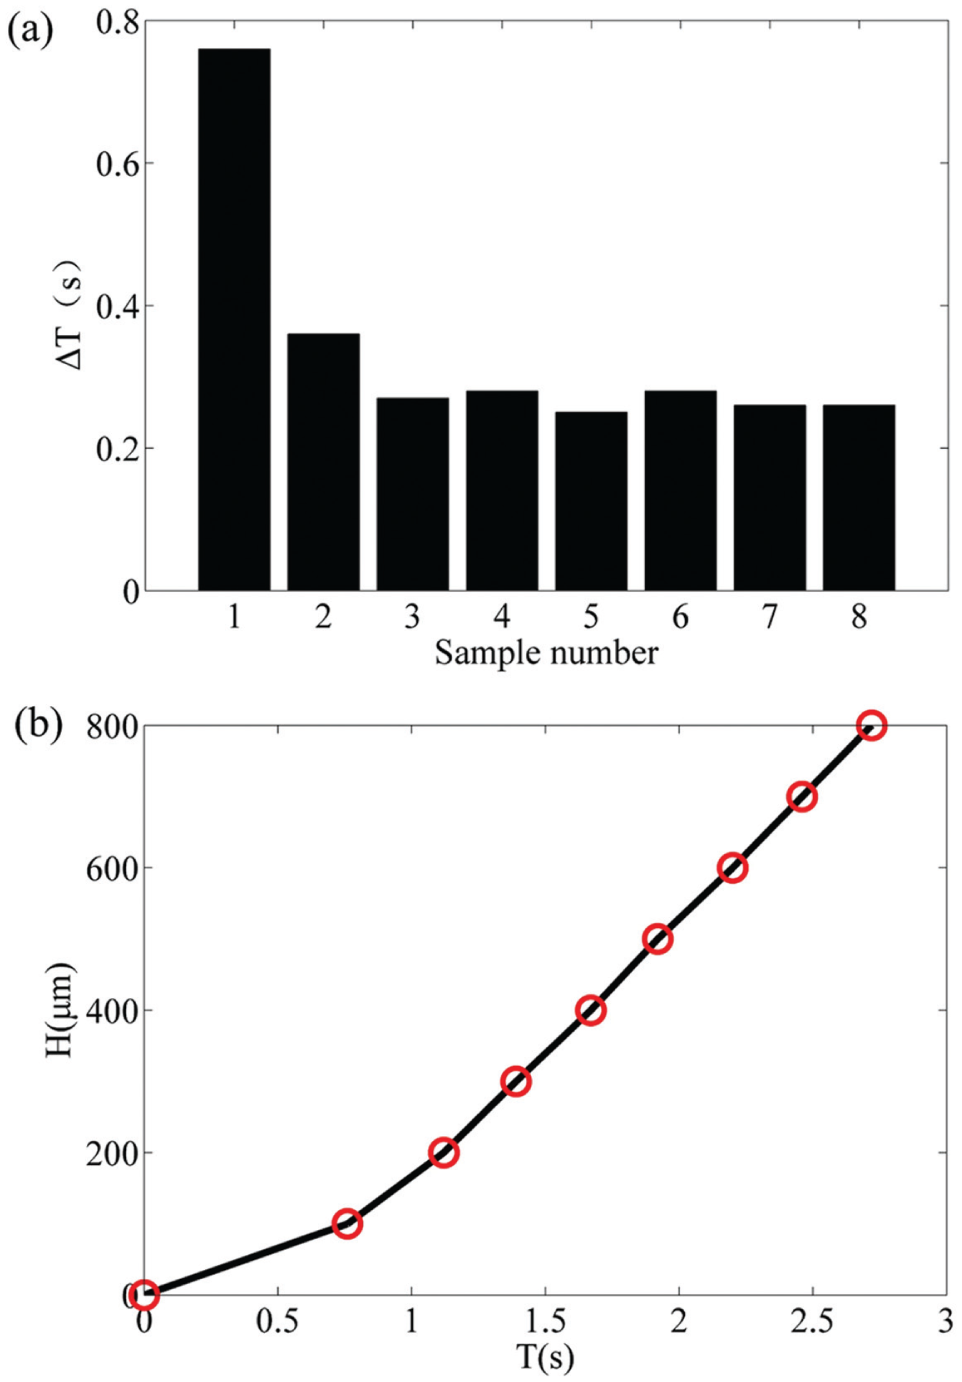
The results of falling experiments on porcine oocytes. (
Using equation 6, the average density of the total 10 oocytes is detected as 1053.4±15.6 kg/m3 (n = 10) according to equation 6, and this is about 1.05 times of the density of the water. This is in accordance with the fact that the cells consist of great protein and sugar molecules, which have higher densities than that of water. The average mass of the oocytes is (2.015±0.041) × 10−9 kg (n = 10), according to the derived densities and geometrical properties of cells.
The proposed cell-weighing method and the method introduced in Ref. 18 are used to detect the density of one oocyte six successive times. The average cell density derived by the proposed method is 1050.9±9.9 kg/m3, whereas the results derived by the method in Ref. 18 are 1045.2±16.8 kg/m3. It is not hard to find that the proposed method has significantly better repeatability than that of the method in Ref. 18 . This is mainly because the proposed method uses the falling time to get the falling speed, effectively eliminates the aforementioned drawbacks using the template-matching algorithm.
According to Figure 6 , when H > 200 µm, ΔT becomes basically constant. As a result, the constant falling speed can be determined through only two falling experiments, one with H of 200 µm and the other one with H of 800 µm. Because the proposed method has a good repeatability, the cell mass can be confirmed only using two falling experiments, which take 22 s totally on average. The cell-weighing method introduced in Ref. 18 usually needs more than three falling experiments to determine the average constant falling speed, which takes more than 30 s.
Although the operation speed of the proposed method is much slower than the method using microcantilever-shaped method, it is totally acceptable for biological applications. Furthermore, the proposed method only requires a pair of common micropipettes and a microscope with two motorized hands. These devices are usually available in common microoperation systems. Hence, our method can be easily applicable to biological manipulations.
Falling Experiments of the Bead Using Constant Falling Intervals
To validate the effectiveness of the weighing method based on the constant falling height intervals, the falling experiments for the bead are performed in water. In experiments, ΔH is selected as 600 µm and ΔT is derived as 1.35 s. Therefore, the constant falling speed of the bead in water is calculated as 444 µm/s. According to equation 6, the density of the bead is 1079.5 kg/m3, which is also in high accordance with the provided value of 1080 kg/m3. The detection error is even less than that of the template-matching method, which means the weighing method based on the constant falling speed intervals can replace the previous method to perform bead-falling experiments in the future. Furthermore, because the oocytes usually have spherical shapes which are similar to that of the bead, the proposed method is expected to estimate the density and mass of the oocyte quantitatively.
Cytoplasm-Removing Experiments
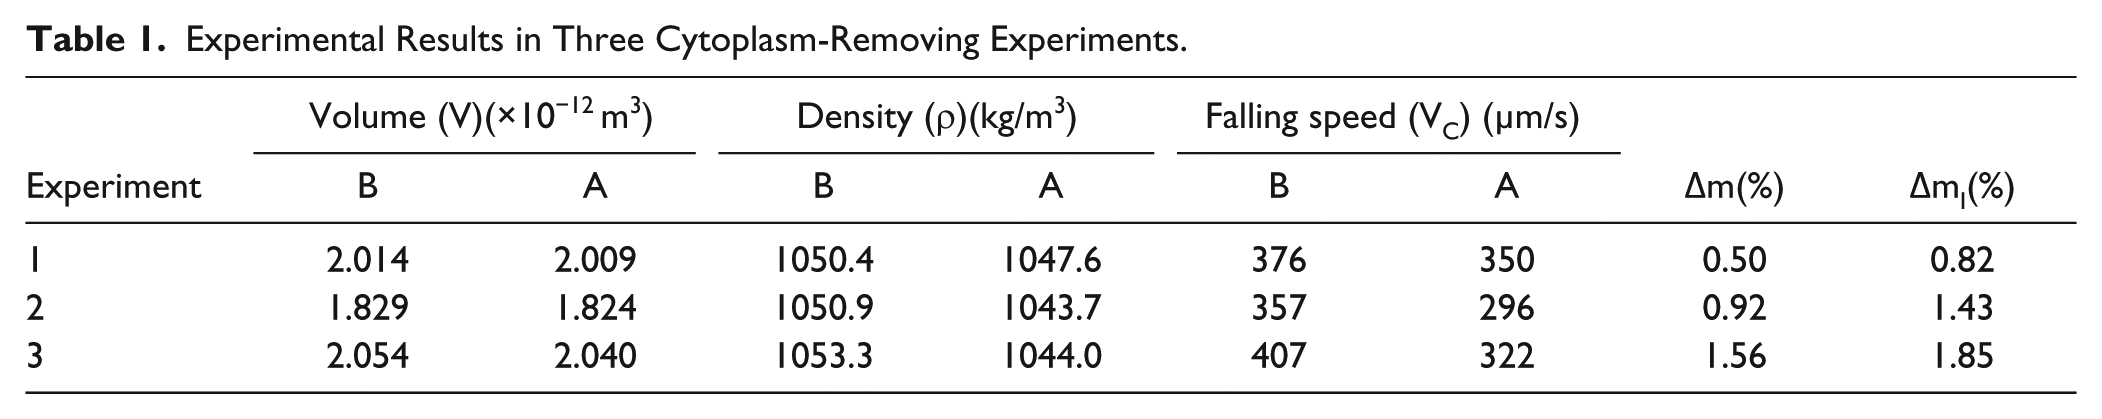
To demonstrate the detection sensitivity of the proposed cell-weighing method, the cytoplasm-removing experiments are performed. As shown in
The volume of the oocyte (before and after cytoplasm removing) is calculated through the derived cell radius R0 before and after cytoplasm-removing operations, assuming that the oocyte is a standard sphere. Furthermore, the volume of the removed cytoplasm is calculated through the microscopic image as follows. The operator inputs the four vertexes of the quadrangular area of cytoplasm in the microscopic image (see points a, b, c, and d in
Experimental Results in Three Cytoplasm-Removing Experiments.
Application in the Nuclear Transplantation
The nuclear transplantation
25
is the primary technique to realize animal cloning. One of the key procedures of this technique is the oocyte enucleation, or removing the cellular parts containing genetic materials. These removed cellular parts include the polar body and the nuclei area lying next to polar body (see
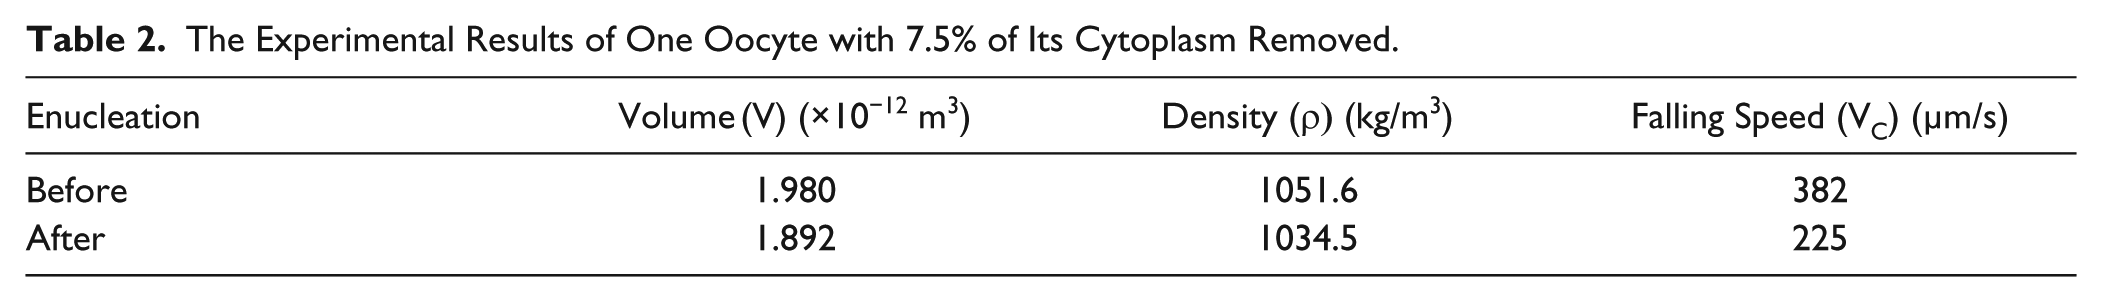
Ten oocytes are chosen to perform the enucleation operation by a highly skilled operator, and
Table 2
shows the experimental results of one oocyte. The fluorescence detection demonstrates that the genetic materials are totally removed (see
The Experimental Results of One Oocyte with 7.5% of Its Cytoplasm Removed.
Conclusion
In this article, a simple robotic weighing approach for spherical cells using a traditional microoperation system is proposed. The detected density of the bead using the proposed method is in high accordance with the provided values. Experimental results on porcine oocytes demonstrate that this approach weighs cells with a success rate of 92% at an average speed of 22 s/cell. It is able to detect less than 1% variation of cell mass (about 7×10⁻¹² kg). Using this method, the amount of removed cytoplasm in nuclear transplantation was detected for the first time. Although only the porcine oocytes were measured in the experiments described, this method can be applied easily to measure other types of spherical cells.
Footnotes
Declaration of Conflicting Interests
The authors declared no potential conflicts of interest with respect to the research, authorship, and/or publication of this article.
Funding
The authors disclosed receipt of the following financial support for the research, authorship, and/or publication of this article: This work was supported in part by the National Natural Science Foundation of China under Grant 61273341, Grant 61327802, and the National High-Tech Research Development Program (863 Program) of China under Grant 2013AA041102. This research is also supported by the Australian Research Council (ARC; ARC LIEF-LE0775692, ARC Discovery-DP110104970, and ARC Discovery DP0986814).
References
Supplementary Material
Please find the following supplemental material available below.
For Open Access articles published under a Creative Commons License, all supplemental material carries the same license as the article it is associated with.
For non-Open Access articles published, all supplemental material carries a non-exclusive license, and permission requests for re-use of supplemental material or any part of supplemental material shall be sent directly to the copyright owner as specified in the copyright notice associated with the article.