
Abstract
Diffuse large B-cell lymphomas (DLBCL) are the most common lymphoid malignancies, and encompass all malignant lymphomas characterized by large neoplastic cells and B-cell derivation. In the last decade, DLBCL has been subjected to intense clinical, phenotypic and molecular studies, and were found to represent a heterogeneous group of tumors. These studies suggested new disease subtypes and variants with distinct clinical characteristics, morphologies, immunophenotypes, genotypes or gene expression profiles, associated with distinct prognoses or unique sensitivities to particular therapy regimens. Unfortunately, the reliability and reproducibility of the molecular results remains unclear due to contradictory reports in the literature resulting from small sample sizes, referral and selection biases, and variable methodologies and cut-off levels used to determine positivity. Here, we review phenotypic studies on the prognostic significance of protein expression profiles in DLBCL and reconsider our own retrospective data on 301 primary DLBCL cases obtained on a previously validated tissue microarray in light of powerful statistical methods of determining optimal cut-off values of phenotypic factors for prediction of outcome.
Keywords
Introduction
Diffuse large B-cell lymphomas (DLBCL) are the most common lymphoid malignancies, comprising 35% to 40% of all adult non-Hodgkin lymphomas. This category encompasses all malignant lymphomas characterized by large neoplastic cells and B-cell derivation (Gatter and Warnke, 2001; Lossos, 2005; Mitterlechner et al. 2006). DLBCL may develop de novo (primary DLBCL) or arise from a previously indolent lymphoma (secondary, transformed DLBCL) at virtually every nodal or extranodal location. It is most commonly observed in cervical, axillar and mediastinal nodes, the stomach and the ileo-coecal region (Gatter and Warnke, 2001). DLBCL are accompanied by an aggressive clinical presentation with the need for highly effective chemotherapy regimens (e.g. Coiffier, 2005). Only about 60% of patients can be cured by rituximab, cyclophosphamide, doxorubicin, vincristine, prednisone (R-CHOP) and equivalent treatment regimens (Coiffier, 2005; Mitterlchner et al. 2006). The gold standard of predicting survival and stratifying patients for risk-adjusted therapy is the international prognostic index (IPI) (Shipp et al. 1993), which consists of easily assessable clinical and laboratory parameters: age, serum lactate dehydrogenase (LDH), stage, performance status and >1 extranodal sites involved. No such histopathologically-defined parameters exist and although the current World Health Organization (WHO) classification (Gatter and Warnke, 2001) accepts different morphologic variants and subtypes of DLBCL, their prognostic utility is hampered by a high rate of interobserver variation, which generally minimizes their influence in therapy. In the last decade, extensive studies of the clinical, phenotypic and molecular aspects of DLBCL have identified them as a heterogeneous group of tumors. These studies suggested new disease subtypes and variants with distinct clinical characteristics, morphology, immunophenotypes, genotypes or gene expression profiles associated with distinct prognoses or unique sensitivities to specific therapy regimens (Pileri et al. 2002; de Leval and Harris, 2003; Wright et al. 2003; Rosenwald and Staudt, 2003; Lossos, 2005; Morgensztern and Lossos, 2005; de Paepe and de Wolf-Peeters, 2006; Muris et al. 2006a). Unfortunately, the reliability and reproducibility of the molecular results remains unclear, and consequently translation into generally accepted standards to predict survival and stratify patients for risk-adjusted therapy has not taken place (for critical remarks see e.g. Hsi, 2001; de Leval and Harris, 2003; Gascoyne, 2004). Technical issues (antibody affinity), lack of standardization of evaluation procedures (definition of cut-off values) and poor study designs (small sample size and collection bias) are the most important factors hindering the efficient clinical translation of these molecular data. From the histopathological standpoint, some of these problems might be resolved by (A) application of monoclonal antibodies and good working fluorescent in situ hybridization (FISH) probes, (B) standardized high throughput analysis methods such as tissue microarrays (TMA) (Tzankov et al. 2005a), (C) powerful statistical methods and (D) consideration of both biological (tumor-specific) and clinical (patient-specific) parameters on thoroughly characterized study collectives.
Here, we review phenotypic studies on the prognostic significance of protein expression profiles in DLBCL. Furthermore, we reconsidered our own retrospective data on 301 primary DLBCL cases obtained on a previously validated TMA (Tzankov et al. 2003a; Went et al. 2004; Zinzani et al. 2005; Tzankov et al. 2006) in light of powerful statistical methods that determine the optimal cut-off values of phenotypic factors for efficient outcome prediction. Since DLBCL with plasmablastic differentiation and acquired immunodeficiency syndrome-related lymphomas, as well as primary mediastinal B-cell lymphomas, are beyond the scope of our review, we refer to recent overviews on these rare variants (Carbone and Gloghini, 2005; Teruya-Feldstein, 2005; Levine, 2006; Savage, 2006).
DLBCL Immunophenotype
DLBCL are derived from germinal center-(GC) or post-GC B-cells, and probably from extrafollicularly-activated B-cells (Alizadeh et al. 2000; Gatter and Warnke, 2001; Pileri et al. 2002; de Leval and Harris, 2003; Rosenwald and Staudt, 2003; Lossos, 2005). The neoplastic cells usually express a series of antigens encountered on mature B-cells. Classical DLBCL are often CD19+, CD20+, CD79a+, BSAP+ (Gatter and Warnke, 2001; Torlakovich et al. 2002; Pileri et al. 2002; de Leval and Harris, 2003). The leukocyte common antigen (CD45) is absent in about 30% of immunoblastic and anaplastic DLBCL (Falini et al. 1990; Gatter and Warnke, 2001). Some immunoblastic DLBCL, particularly those derived from preterminally-differentiated post-CG B-cells (plasmablastic-, primary effusion- and ALK+ DLBCL), often do not express CD20, CD79a and BSAP, but express MUM1, VS38c, CD138, or immunoglobulin (Ig) heavy or light chains (Delecluse et al. 1997; Delsol et al. 1997; Gatter and Warnke, 2001; Carbone and Gloghini, 2005; Teruya-Feldstein, 2005; Savage, 2006). Lineage specificity in such cases therefore requires immunohistochemical analysis utilizing a broader marker panel. Importantly, considering B-lineage markers, the rituximab era highlights the importance of assessing CD20-status in DLBCL at primary diagnosis and at every sequential biopsy, since therapeutic efficacy is related to CD20 expression, which exposure to rituximab can abrogate (Davis et al. 1999; Held et al. 2006).
Prognostic Significance of Immunophenotypic Cellular Differentiation Markers (Table 1)
Review of prognostic phenotypic markers in diffuse large B-cell lymphoma; cut-off levels according to varying reports in the literature. Note the broad range of cut-off levels applied.

indicates the mainstream finding of the reviewed studies.
references from which data arose are mentioned in the according manuscript sections dealing with the individual markers.
The concept of varying DLBCL histogenesis from GC and non-GC B-cells takes, similar to the Kiel and WHO lymphoma-classification concept, normal B-cell differentiation into consideration, a concept supported by gene expression profiling data (Alizadeh et al. 2000; Pileri et al. 2002; de Leval and Harris, 2003; Rosenwald and Staudt, 2003; Lossos, 2005). Non-neoplastic GC B-cells have a distinct protein expression profile (bcl-6+, CD10+, MUM1– and CD44sweakly+). The expression of BCL6 and MUM1, both involved in transcription regulation of genes important for lymphocyte activation and cell cycle control, is virtually reciprocal in normal B-cells (Fig. 1) (Shaffer et al. 2000; Falini et al. 2000). Protein expression in DLCBL in comparison to non-neoplastic B-cells is more complex (Fig. 2), suggesting deregulation of their gene expression, e.g. MUM1 and bcl-6 expression is not exclusive in DLBCL (Falini et al. 2000; Falini and Mason, 2002; Pileri et al. 2002; de Leval and Harris, 2003; Hans et al. 2004). Expression of each of the mentioned differentiation antigens has been found to be of prognostic significance in DLBCL, but these results remain somewhat controversial.

Reciprocal expression of Bcl-6 (left) and MUM1 (right) in normal germinal centers. Note striking Bcl-6 nuclear positivity in the centroblast-rich follicle dark zone and the majority of cells in the centrocyte-rich pale zone on the left as well as isolated MUM1+ cells within the germinal center on the right.

Cluster center analysis in our own series of diffuse large B-cell lymphomas considering expression of differentiation markers. The overlap of the red and green ellipsoids with the protein expression circles indicates cluster center tendency. Note the strict segregation of CD10- and MUM1 expression, but the comparatively low segregation of Bcl-6- and CD44s- and even lower Bcl-2- and FOXP1 expression within the diffuse large B-cell lymphoma clusters.
Bcl-6 is a zinc finger sequence-specific transcriptional repressor specifically expressed on GC B-cells (Cattoretti et al. 1995; Shaffer et al. 2000). Approximately 50% of DLBCL express Bcl-6 in a variable proportion of tumor cells (Fig. 3 and 4A) (Skinnider et al. 1999; King et al. 2000; Artiga et al. 2002; Pileri et al. 2002; Braaten et al. 2003; Colomo et al. 2003; de Leval and Harris, 2003; Chang et al. 2004). Bcl-6 expression in DLBCL may be a signature of a GC differentiation stage of the original B-cell before malignant transformation, or may be turned on due to translocations involving the BCL6 locus at 3q27 with variable partners of either the Ig family or non-Ig genes, or due to mutations in the 5’ non-translated regulatory region (Ye et al. 1993; Lo Coco et al. 1994; Ye et al. 1995; Pescarmona et al. 1997; Kramer et al. 1998; Skinnider et al. 1999; Capello et al. 2000; Butler et al. 2002; Falini and Mason, 2002; Pasqualucci et al. 2003; Ohno, 2006). It is likely that only co-expression of bcl-6 with CD10 reflects a true GC DLCBL derivation (Dogan et al. 2000; King et al. 2000; see Paragraph on expression of CD10). Indeed, bcl-6 and CD10 expression cluster together in DLBCL (Fig. 3). While bcl-6 protein or mRNA expression in DLBCL has been found to predict favorable outcomes by some investigators, this has not been confirmed by others (Lossos et al. 2001; Braaten et al. 2003; Colomo et al. 2003; Tzankov et al. 2003a; Chang et al. 2004; Winter et al. 2006). The same contradictory results have been found for BCL6 rearrangements, which some authors report to be associated with a favorable outcome and others report no distinct prognostic significance (Lo Coco, 1994; Offit et al. 1994; Pescarmona et al. 1997; Kramer et al. 1998; Barrans et al. 2002a; Jerkeman et al. 2004). This controversy can be explained by the fact that translocations, leading to non-Ig/BCL6 fusion products, indicate a poor prognosis, while those leading to Ig/BCL6 fusions do not (Akasaka et al. 2000; Ueda et al. 2002; Ohno, 2006). Bcl-6 mutations are probably also associated with distinct outcomes in DLBCL (Vitolo et al. 2002; Artiga et al. 2002).

Outcome cluster analysis of phenotypic markers and phenotypes according to the “Hans’ algorithm” (Hans et al. 2004) and cut-off values from Table 2, as well as clinical parameters in diffuse large B-cell lymphomas (DLBCL). Cases expressing markers higher than the cut-offs, males, and patients >66 years are indicated in red, while negative cases, females, and individuals <66 are in green. Phenotypic germinal center DLBCL are indicated in orange, while non-germinal center DLBCL are in blue; only one DLBCL case (brown) co-expressed all three CD10, Bcl-6 and MUM1. Note the aggregation of FOXP1+, MUM1+ and Bcl-2+ cases in the lymphoma-related deaths cluster as well as the slight predominance of CD10+, Bcl-6+ and highly proliferative tumors in the survival cluster. Empty balks represent analysis failure or lacking LDH data.

A. Expression of Bcl-6 in diffuse large B-cell lymphoma (DLBCL). Note intense and moderate nuclear signals in lymphoma cells as well as internal negative controls (endothelial nuclei). B. Expression of CD10 in DLBCL. Note intense membranous signals in lymphoma cells as well as internal negative controls (small lymphocytes). C. Expression of MUM1 in DLBCL. Note intense and moderate nuclear signals in lymphoma cells. D. Expression of cyclin E in diffuse large B-cell lymphoma. Note moderate and isolated intense nuclear signals in lymphoma cells.
CD10 is a membrane metalloproteinase expressed in GC B-cells (Shipp et al. 1989; King et al. 2000). Approximately 35% of DLBCL express CD10 (Fig. 3 and 4B) (Dogan et al. 2000; King et al. 2000; Fabiani et al. 2002; de Leval and Harris 2003; Tzankov et al. 2003a; Hans et al. 2004), but the prognostic relevance of such expression is controversial. Some authors reported an association of the CD10+ phenotype with a significantly lower rate of complete remissions, but most studies showed CD10 expression to be a favorable prognostic factor in DLBCL (Xu et al. 2001; Oshima et al. 2001; Uherova et al. 2001; Fabiani et al. 2002; Colomo et al. 2003; Biasoli et al. 2005; Muris et al. 2006b). A large proportion of CD10+ DLBCL express Bcl-6 (Fig. 3), indicating a GC-origin, and this phenotype seems to be particularly predictive of a favorable outcome (Ree et al. 2001; Barrans et al. 2002b; Colomo et al. 2003; Huang et al. 2002; McCluggage et al. 2002; Tzankov et al. 2003a; Chang et al. 2004; Hans et al. 2004; Zinzani et al. 2005; Berglund et al. 2005; van Imhoff et al. 2006).
In normal B-cells, MUM1/IRF4 expression probably drives the final steps of intra-GC B-cell differentiation and initiates subsequent steps of maturation towards plasma cells. Thus, MUM1 can be detected by immunohistochemistry in a small percentage of Bcl-6– GC B-cells, post-GC B-cells and plasma cells (Falini et al. 2000). In DLBCL, MUM1 is expressed in 50 to 75% of both Bcl-6+ and Bcl-6– samples, and may reflect derivation from B-cells at a late GC or post-GC stage of differentiation (Fig. 3 and 4C) (Falini et al. 2000; Tsuboi et al. 2000; Natkunam et al. 2001; Pileri et al. 2002; Chang et al. 2004; Hans et al. 2004; Saez et al. 2004; Zinzani et al. 2005). Gene expression profile analyses showed that MUM1 clustered within the group of genes expressed by activated B-cell like DLBCL (Alizadeh et al. 2000). Subsequent TMA studies demonstrated that expression of MUM1 in at least 30% of tumor cells was associated with a significantly worse outcome (Chang et al. 2004; Hans et al. 2004; Tzankov et al. 2006; Muris et al. 2006b; van Imhoff et al. 2006), while other studies found no association between MUM1 expression and outcome (Colomo et al. 2003; Berglund et al. 2005).
FOXP1 (FORKHEAD BOX P1) is a transcription factor containing a forkhead DNA-binding domain (Kaestner et al. 2000). The FOXP1 gene is located on chromosome 3 and is expressed in normal activated B-cells and in a subset of DLBCL with a predominantly non-GC phenotype (Fig. 3) (Barrans et al. 2004; Hans et al. 2004; Banham et al. 2005; Wlodarska et al. 2005). FOXP1 expression correlates with poor survival in DLBCL patients (Barrans et al. 2004; Banham et al. 2005). Interestingly, FOXP1 can be also detected in marginal zone B-cell lymphomas. Studies on the molecular mechanisms underlying FOXP1 expression in both DLBCL and MZL showed that its expression can result from a translocation t(3;14) (p13; q32) in 1% of cases, or may be related to an increased gene copy number, since 60% of FOXP1+ DLBCL harbor the trisomy 3 (Wlodarska et al. 2005; Fenton et al. 2006). Interestingly, 45% of FOXP1+ extranodal marginal zone B-cell lymphomas also have trisomy 3, and FOXP1 expression correlates with poor survival (Sagaert et al. 2006).
CD44 is a family of cell surface adhesion glycoproteins that act as receptors for hyaluronate. CD44 molecules play a key role in normal lymphocyte development, homing and activation and are important for tumor spread (Irving et al. 1998). CD44 exist in a variety of alternatively spliced isoforms. Normal lymphocytes express the standard CD44 isoform (CD44s). In addition to CD44s, DLBCL may express larger splicing variants (CD44v), especially those containing exon v6/7, which are associated with disseminated malignancies in experimental models (Drillenburg and Pals 2000). Expression of CD44s and/or CD44v6 has been associated with shortened survival in DLBCL and clustered in bcl-6– (non-GC) cases (Ristamaki et al. 1995; Drillenburg et al. 1999; Inagaki et al. 1999; Tzankov et al. 2003a).
A few studies point to the CD5 expression in DLBCL (Harada et al. 1999; Kroft et al. 2000; Suguro 2006). Its finding in 109 de novo cases was supposed to represent a unique subgroup of DLBCL because of the uniform phenotype (CD5+/CD10–/CD19+/CD20+/CD21+/CD23–/cyclin D1–), usual centroblastic morphology and aggressive clinical behavior (Yamaguchi et al. 2002; Suguro et al. 2006). However, the putative adverse prognostic relevance of CD5 expression has not been confirmed by other studies, which instead correlated CD5 positivity to the occurrence of other specific molecular aberrations (Katzenberger et al. 2002; Karnan et al. 2004; Zimpfer et al. 2004; Yoshioka et al. 2005).
VS38c and CD138 are markers of late post-GC differentiation and are often expressed in HIV-associated-, plasmablastic-, primary effusion- and ALK+ lymphomas (Delecluse et al. 1997; Delsol et al. 1997; Gatter and Warnke, 2001; Carbone and Gloghini, 2005; Teruya-Feldstein 2005; Levine 2006). Common DLBCL are rarely reactive with these markers (Pileri et al. 2002; de Leval and Harris, 2003).
Considering the expression of bcl-6, CD10 and MUM1 as well as CD44, CD138, bcl-2 and other biomarkers, different algorithms to identify GC and non-CG DLBCL have been proposed (e.g. Barrans et al. 2002b; Colomo et al. 2003; Tzankov et al. 2003a; Chang et al. 2004; Hans et al. 2004; Zinzani et al. 2005, Tzankov et al. 2006; Muris et al. 2006b; Oh et al. 2006; van Imhoff et al. 2006), but confirming the relevance of most of them is hampered by failures in results reproducibility and low validity.
Prognostic Significance of Immunophenotypic Cell Cycle-and Apoptosis-controlling Proteins in DLBCL (Table 1)
Disruption of the physiological balance between cell proliferation and cell death is a universal feature of malignant tumors. Two major concurrent regulatory pathways control the cell cycle: The p53 pathway, which regulates apoptosis and arrest in the G1-phase of the cell cycle, and the retinoblastoma (Rb) pathway, which regulates the G1-S transition. Cell cycle progression is regulated by a complex molecular network involving cyclins (CCN), cyclin-dependent kinases (CDK) and CDK inhibitors (CDKI). Genetic alterations and/or deregulations of many of these factors are frequently detected in DLBCL (Sherr 2000).
p53, one of the most frequently mutated genes in human cancer, monitors DNA integrity by arresting cells at the G1-phase or programming them to cell death when DNA is defective (Somasundaram 2000). p53 is usually immunohistochemically undetectable in normal cells because of its rapid degradation. Missense mutations of p53 usually result in protein stabilization, making it detectable by immunohistochemistry, but the absence of p53 expression cannot be regarded as an unequivocal sign of a wild-type gene, since rare nonsense or frameshift mutations produce rapidly degradable p53 proteins that fail to accumulate (Soussi and Beroud 2001). In DLBCL, p53 is immunohistochemically detectable in 30 to 40% of cases, but only a fraction of p53+ DLBCL have an underlying mutation, thus p53 mutational status can obviously not be deduced from immunohistochemically detected p53 expression alone. Importantly, only p53 mutations, which are found in about 20% of DLBCL, appear to be associated with clinical drug resistance and poor outcome (Villuendas et al. 1993; Piris et al. 1994; Kramer et al. 1996; Ichikawa et al. 1997; Koduru et al. 1997; Wilson et al. 1997; Moller et al. 1999; Llanos et al. 2001; Leroy et al. 2002; Kerbauy et al. 2004). The combined analysis of p53 and its downstream target, p21, comprises the distinction between p53 immunopositivity associated with p53 mutation (p53+/p21–) and that, reflecting accumulation of wild-type p53 (p53+/p21+) (Villuendas et al. 1993; Chilosi et al. 1996; Moller et al. 1999). Some studies showed that the p53+/p21– (Δp53) immunophenotype, used as a surrogate for p53 mutations, is associated with treatment failure and poor survival in DLBCL as well, particularly in GC DLBCL (Moller et al. 1999; Pagano et al. 2001; Visco et al. 2006). We recently performed a TMA-based study on 297 DLBCL considering the prognostic significance Δp53 (Went et al. 2004), which was found in 21% of cases. In a multivariate model, high IPI and Δp53 were independent prognostic markers of poor survival.
Bcl-2, a mitochondrial inner membrane anti-apoptotic protein (Hockenbery et al. 1990), should be particularly discussed, because its prognostic importance in DLBCL has been confirmed by numerous studies (Moni et al. 1999; Rantanen et al. 2001; Shivakumar and Armitage, 2006) and bcl-2 associated treatment resistance can be abolished by the addition of rituximab to CHOP-therapy regimens (Mounier et al. 2003; Coiffier 2005). Bcl-2 is widely expressed in normal lymphoid tissues, but is absent in GC B-cells (Pezzella et al. 1990). The exemplary t(14;18) (q32; q21) translocation characteristic of follicular lymphoma (Tsujimoto et al. 1985), which induces production of high levels of bcl-2 protein, is observed in about 25% of DLBCL, but bcl-2 protein expression is found in >50% of DLBCL (Fig. 3) (Jacobson et al. 1993; Piris et al. 1994; Dalla-Favera et al. 1994; Gascoyne et al. 1997a; Pescarmona et al. 1997; Kramer et al. 1998; Skinnider et al. 1999; Rantanen et al. 2001; Huang et al. 2002; McCluggage et al. 2002; de Leval and Harris 2003; Barrans et al. 2003; Tzankov et al. 2003a; Iqbal et al 2004). Indeed, in the absence of BCL-2 translocation, amplification of 18q21 (containing the BCL2 gene) is another important mechanism for bcl-2 protein over-expression in DLBCL, and can be detected in about 30% of cases (Monni et al. 1997; Rao et al. 1998; Skinnider et al. 1999; Rantanen et al. 2001). Amplifications seem to be more frequent in non-GC DLBCL (18%) than GC DLBCL (5%), while the latter more frequently harbor the t(14;18) (q32; q21) (Huang et al. 2002; McCluggage et al. 2002; Rosenwald et al. 2002; Barrans et al. 2003; Iqbal et al. 2004; Kusumoto et al. 2005). There is no evidence that the presence of a BCL-2 translocation at diagnosis has any impact on the survival of patients with DLBCL, though the prognostic impact of bcl-2 protein expression, evaluated in multiple large-scale trials, is significant (Hill et al. 1996; Gascoyne et al. 1997a; Pescarmona et al. 1997; Bebb et al. 2002; Muris et al. 2006b). A recent publication supported the prognostic significance of t(14,18) in GC DLBCL (Barrans et al. 2003), while others suggest that bcl-2 expression may be of greater prognostic significance in non-GC DLBCL (Iqbal et al. 2006). The anti-apoptotic activity of bcl-2 is modulated in part by its ability to heterodimerize with bax, another member of the bcl-2 protein family with a pro-apoptotic activity (Oltvai et al. 1993). In two studies, low bax expression tended to be correlated with an adverse outcome in DLBCL (Gascoyne et al. 1997b; Sohn et al. 2003).
Survivin is a member of the apoptosis-inhibiting protein family and is expressed during mitosis, inhibiting apoptosis at the G2-M transition (Li and Ling, 2006). It is normally undetectable in adult tissues. In a large prospective DLBCL trial, survivin expression was detected in 60% of the cases and was an independent predictor of decreased survival (Adida et al. 2000). A second smaller study confirmed these observations for both phenotypical GC- and non-GC DLBCL (Watanuki-Miyauchi et al. 2005).
The monoclonal anti-Ki-67 antibody (MIB-1), which detects a protein expressed in the G1-, S-, G2- and M- but not G0-phases of the cell cycle, is widely used as a proliferation marker (Brown and Gatter, 2002). The functional significance of Ki-67 remains unclear (Scholzen and Gerdes, 2000). In DLBCL, the cell cycle fraction assessed by Ki-67 is variable, usually ranging from 30 to 100%, but is typically high (de Leval and Harris, 2003). A high proliferation index has been associated with an unfavorable clinical outcome in some studies, but not in others (Miller et al. 1994; Llanos et al. 2001; personal observations, (Fig. 3)). Since it has been suggested that Ki-67 plays a role in the ribo-some biosynthesis rather than being directly responsible for cell proliferation (Scholzen and Gerdes, 2000), detecting markers directly involved in DNA replication might be a more precise method to evaluate the proliferative behavior of a tumor. The minichromosome maintenance (MCM) protein family, consisting of six abundant members of DNA-binding proteins, stands at the end of many signaling pathways involved in cell proliferation. MCMs ensure that synthesis of DNA is initiated only once during each cell cycle and are only expressed in cycling, but not in quiescent and differentiating cells (Tye, 1999). We recently demonstrated that expression of MCM2 in ≥40% of tumor cells is a negative prognostic marker for disease-specific survival in a large series of DLBCL (Obermann et al. 2005a).
In normal cells, transition through the restriction point of the cell cycle in the G1-phase, beyond which cell proliferation is independent of external signaling, is negatively regulated by the Rb protein, which binds and inactivates E2F transcription factors whose activity is necessary for expression of S-phase genes. Under mitogenic stimulation, accumulation of D-type CCNs allows formation of active CDK4/CCND complexes that inactivate Rb, thus promoting E2F-mediated transcription and subsequent progression through the early (mitogen-dependent) G1-phase of the cell cycle. Later, CDK2/CCNE complexes drive the mitogen-independent G1-phase progression as well as the G1-S transition. CDK1/CCNB1 complexes play an important role in G2-M transition and execution of mitosis (Sherr 2000). Considering cell cycle regulation in DLBCL, expression of CCNB1, CCND2, CCND3, CCNE, CDK1 and CDK2 and CDKI p27 have been shown to be prognostically relevant (Erlanson et al. 1998; Saez et al. 1999; Sanchez-Beato et al. 1999; Ferreri et al. 2001; Moller et al. 2001; Filipits et al. 2002; Kuttler et al. 2002; Lin et al. 2003; Saez et al. 2004; Hans et al. 2005; Obermann et al. 2005b; Tzankov et al. 2006). Expression of CCND2 in more than 30% or of CCND3 in more than 50% of neoplastic cells, respectively, seems to predict inferior overall survival (Filipits et al. 2002; Hans et al. 2004 and 2005). In addition to the direct activation of CDK4, CCND3 can further promote cell proliferation by the sequestration of p27 and indirect activation of CDK2/CCNE, which might explain why high p27 expression (probably sequestered by CCND3) is an adverse prognostic factor in DLBCL (Saez et al. 1999; Sanchez-Beato et al. 1999; Lin et al. 2003). We recently showed that 35% of DLBCL express CCNE in >20% of tumor cells (Fig. 4D) despite the general lack of CCNE gene amplification (Tzankov et al. 2006), a constellation similar to that in classical Hodgkin lymphoma (Tzankov et al. 2003b). In classical Hodgkin lymphoma, CCNE over-expression seems to reflect profound deregulation of the cell cycle in Hodgkin and Reed-Sternberg cells (Tzankov et al. 2003b; Tzankov et al. 2005b) and has no prognostic significance, while CCNE in DLBCL obviously preserves its oncogenic potential to promote G1-S transition independent of extracellular mitogenic stimuli (Gong et al. 1995; Bortner and Rosenberg 1997). CCNE expression in >20% of tumor cells is an IPI-independent prognostic factor for both overall- and disease-specific survival and a predictive factor for poor response to CHOP treatment regimens in DLBCL (Tzankov et al. 2006). Expression of CCNE did not correlate with proliferation as assessed by Ki-67 (Tzankov et al. 2006), in agreement with previous observations (Erlanson et al. 1998). Thus, mitogen-independent deregulation of the G1-S transition possibly plays a more important oncogenic role than proliferative activity. Interestingly in that context, we and others demonstrated that detection of >1% CCNB1 stainable cells in DLBCL is also a stage-independent negative prognostic factor (Kuttler et al. 2002; Obermann et al. 2005b). In summary, deregulation of the G1-S (CCNE/CDK2) and G2-M transitions (CCNB1/CDK1) are probably most critical for the malignant potential of DLBCL (Fig. 5).

Schematic demonstration of cell cycle regulation. The most critically disturbed phases in diffuse large B-cell lymphomas are delineated in blue (G1-S transition) and red color (G2-M transition).
Implementation of Receiver Operating Characteristic (ROC) Curves and Area under ROC (AUROC) to Determine Optimize Prognostic Cut-Off Values of Immunophenotypic Markers in DLBCL
One of the main obstacles for practical translation of the marker profiles reviewed herein is the considerable variation in criteria used by different investigators to classify positive and negative cases, as well as the fact that in some instances (e.g. Bcl-2 and Bcl-6), the multiple mechanisms driving protein expression have not been taken into consideration. The quantity of positive cells and staining intensity for many of the phenotypic markers considered shows a continuous distribution from 0 to 100% in DLBCL. Cut-off levels for the different markers have a broad range and their sensitivity and specificity have not yet been critically addressed (Table 1).
When a diagnostic test is based on a continuous variable, a range of different cut-off values may be investigated to decide which value should be used to discriminate between patients according to outcome (Bewick et al. 2004). In most instances, it is desirable to choose a test that has highest possible values for both sensitivity and specificity. A graphic of sensitivity against 1 – specificity is called a receiver operating characteristic (ROC) curve (Fig. 6). A perfect test would have a sensitivity and specificity both equal to 1. The ROC curve would start at coordinates X0; Y0, go vertically up the y-axis and then horizontally across to coordinates X1; Y1. A good test would be somewhere close to this ideal (Bewick et al. 2004). If a variable has no diagnostic or prognostic value, then a test based on it would be equally random and the ROC curve would run diagonally (Fig. 6). The performance of a diagnostic variable can be quantified by calculating the area under the ROC curve (AUROC). The ideal test would have an AUROC of 1, whereas a random guess would have an AUROC of 0.5. If there is no particular requirement on the sensitivity and specificity of a test, then the Youden's index (Y) may be used to choose an appropriate cut-off for the descriptive values from the ROC curve:

Typical receiver operating characteristics (ROC)-curve of a prognostic marker in diffuse large B-cell lymphoma (DLBCL) (blue), in that particular case FOXP1. The area under the ROC-curve is 0.583, p = 0.015, suggesting that FOXP1 determination in DLBCL is of significant prognostic importance. The optimal cut-off value for FOXP1 expression considering survival determined by ROC and Youden's transformation was at 47,5% positivity (arrow) with a specificity of 59% and sensitivity of 57%; note that the cut-off point indicated by the arrow is as next to the coordinates 0.0;1.0. The reference diagonal green line corresponds to a variable without diagnostic capability. The ideal ROC-curve is delineated in red.

The maximum value Y can attain is 1, when the test is perfect. The coordinates from the ROC curve can be easily calculated and sorted by this index. Optimal cut-off values then should be determined with reference to Y nearest to 1. The potentials of implementation of ROC/AUROC for diagnostic purposes in immunohistochemistry have only recently been realized and addressed (e.g. Obermann et al. 2005a; Obermann et al. 2005b; Zlobec et al. 2006).
Taking into consideration these statistic operators, we critically re-evaluated our own TMA series of 301 primary DLBCL (Tzankov et al. 2003a; Went et al. 2004; Zinzani et al. 2005; Tzankov et al. 2005a; Tzankov et al. 2006) to determine the optimal cut-off values for differentiation-associated antigen expression (Table 2). We linked the results to the clinical end-point “disease-related mortality” and critically compared the outcomes obtained considering the cut-off levels form the ROC curves and Y with those suggested in the literature. Comparison of the results linked to disease-related mortality by the Kaplan-Meier method for every factor unequivocally showed the superior discriminating power (increased sensitivity and specificity) of the cut-off levels calculated considering the ROC curves and Y (e.g. Bcl-6, Fig. 7). Furthermore, we compared the results on the molecular classification of our DLBCL series according to the “Hans’ algorithm” (Hans et al. 2004) using cut-off values of the variables from the original publication and those suggested by the ROC curves and Y. The Kaplan-Meier analysis showed a superior prognostic value of the phenotypic DLBCL classification according to the cut-off values from the ROC curves (data not shown).
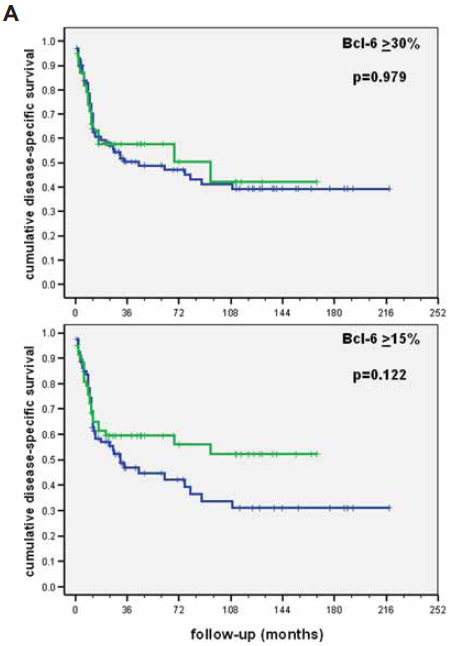
Comparison of results for the prognostic value of Bcl-6 in our diffuse large B-cell lymphoma series linked to disease-related mortality by the Kaplan-Meier method applying cut-off levels suggested in the literature (upper) and the ROC curves (lower).
Determination of optimal cut-off levels considering disease-specific survival (DSS) for selected phenotypic markers and clinical parameters in our own series of diffuse large B-cell lymphomas applying receiver operating characteristic curves (ROC). The significance of each biomarker considering DSS was finally tested after dichotomization by the Kaplan-Meier (K-M) method. Factors in which values > cut-off have adverse prognostic effects are italicized.

Perspectives
A high number of strong candidate biomarkers, particularly expressed proteins, that contribute to prognosis in DLBCL have been identified but not yet translated to practical utility mainly because of contradictory reports in the literature resulting from small sample sizes, referral and selection biases, and variable methodologies and cut-off levels used to determine positivity. These obstacles must be addressed before these biomarkers can be introduced into clinical practice. First, biomarker assessment in DLBCL should be standardized and validated applying powerful statistical methods. Second, the clinical material required to study such questions should be clearly documented and brought into TMAs, which should become an integral part of all clinical trials. The combination of tumor-specific biomarkers with patient-specific clinical factors in new predictive and prognostic models will enable successful individual risk-adjusted patient treatment.