
Abstract
Cell signaling is a dynamic and complex process. A typical signaling pathway may begin with activation of cell surface receptors, leading to activation of a kinase cascade that culminates in induction of messenger RNA (mRNA) and noncoding microRNA (miRNA) production in the nucleus, followed by modulation of mRNA expression by miRNAs in the cytosol, and end with production of proteins in response to the signaling pathway. Signaling pathways involve proteins, miRNA, and mRNAs, along with various forms of transient posttranslational modifications, and detecting each type of signaling molecule requires categorically different sample preparation methods such as Western blotting for proteins, PCR for nucleic acids, and flow cytometry for posttranslational modifications. Since we know that cells in populations behave heterogeneously,1 especially in the cases of stem cells, cancer, and hematopoiesis, there is need for a new technology that provides capability to detect and quantify multiple categories of signaling molecules in intact single cells to provide a comprehensive view of the cell’s physiological state. In this Technology Brief, we describe our automated microfluidic platform with a portfolio of customized molecular assays that can detect nucleic acids, proteins, and posttranslational modifications in single intact cells with >95% reduction in reagent requirement in under 8 h.
Introduction
Cell signaling is a complex, intricate process that involves many players, including proteins, nucleic acids, and transient posttranslational modifications (PTMs) ( Fig. 1 ). The traditional view of the cell signaling cascade begins with cell surface receptor activation, where a change in receptor structure conformation begins a cascade of events (e.g., a kinase cascade where kinases transiently phosphorylate in series), leading to the translocation of transcription factor into the nucleus to induce expression of relevant genes into messenger RNA (mRNA). The induced mRNA is exported into the cytosol and translated into proteins that can then carry out response to the original stimulus that activated the surface receptor. To make the process even more complex, small, noncoding RNAs, known as microRNAs or miRNAs, can be induced along with the mRNA, and the miRNAs function by binding the 3′ untranslated region (UTR) and recruit the RISC complex to degrade the mRNA. 2
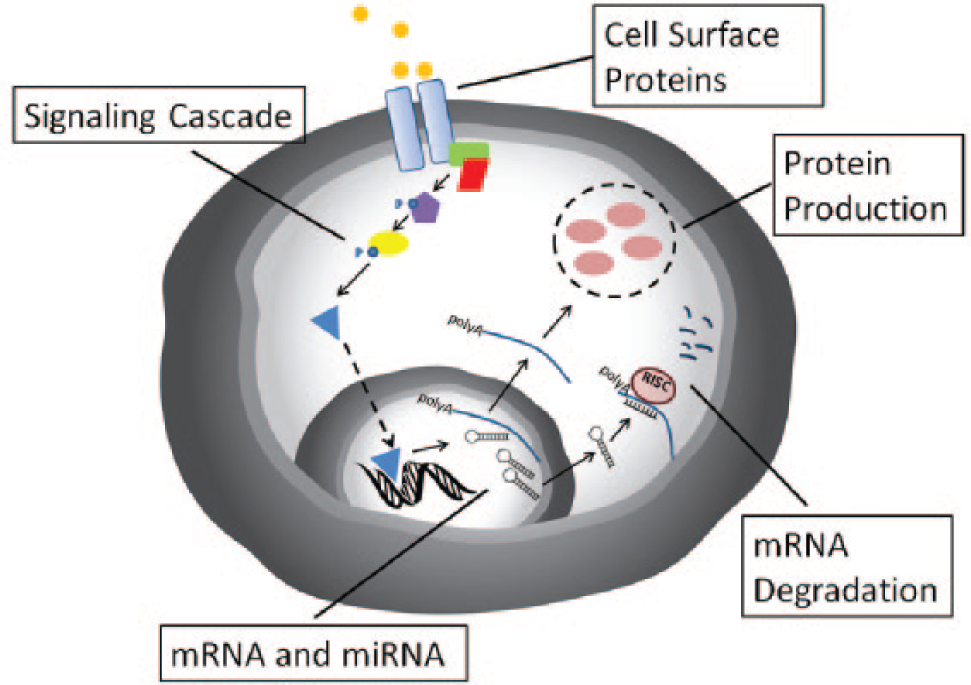
Cell signaling diagram. Activation of cell surface receptor leads to phosphorylation cascade, which then induces the transcription of messenger RNA (mRNA) and microRNAs (miRNAs). The mRNA and miRNA are exported into the cytosol, and mRNA is translated into proteins, whereas the miRNA can inhibit protein translation by binding mRNA and inducing their degradation.
Understanding the role of all these key players in signaling networks is critical for deciphering the molecular mechanisms of cellular and disease processes. Such a study requires an integrated, multiplexed platform that enables a systems-level investigation of the complex interactions between these signaling biomolecules. To date, no technology exists that can integrate the detection and analysis of all the signaling molecules, particularly at the single cell level. Analysis of each class of biomolecules currently requires categorically different methods for sample preparation and detection. For instance, proteins are primarily detected by Western blotting, nucleic acids by PCR, and PTMs by flow cytometry or mass spectrometry. The multiple sample preparation techniques required to detect different categories of molecular targets involve labor-intensive steps, including stimulation, fixation, permeabilization, immunostaining, and multiple wash steps in between. The manual methods for performing large-scale cell signaling studies not only involve bulky equipment but also many opportunities for user-introduced artifacts that can confound reproducibility.
The analysis of cellular signaling is further complicated by the fact that cells are heterogeneous in nature. To fully understand how individual cells respond to stimuli in cellular and disease processes, one must study the changes in protein, mRNA, miRNA, and PTMs at the single-cell level. For example, to study the CD8 T-cell response to different vaccines requires distinguishing T-cell subtypes based on cell surface markers to study the heterogeneous gene expression patterns in individual T cells that underlie differential induction of vaccine-induced immunity. 3 Bulk profiling methods only generate averaged signaling measurement from heterogeneous cell populations, and single-cell resolution analysis of miRNA, mRNA, and protein will yield information otherwise unattainable using bulk methods. Existing single-cell analysis methods include amplification-based methods that include PCR-based amplification to profile DNA and RNA, but these methods can introduce bias during the amplification and require days of hands-on manipulation time to accomplish. In addition, amplification-based single-cell analysis methods require lysis and nucleic acid extraction and cannot be used practically to profile proteins and PTMs along with the nucleic acids in the same cell.
To address the need for a new technology that provides true single-cell resolution multiplexed signaling analysis, we have developed an automated, microfluidic platform with accompanying molecular assays that enable rapid processing of intact cells (~8 h) to simultaneously detect miRNAs, mRNAs, proteins, and PTMs at single-cell resolution, with only ~270 nL reagent and ~1000 cells required per sample. The molecular assays that accompany the platform combine in situ hybridization (ISH) and immunostaining to gain access to both nucleic acid and protein targets without the need to lyse and amplify cellular signals. An added benefit is that both ISH and immunostaining are compatible with microscopy for visual inspection of the spatiotemporal correlation between the proteins and nucleic acid species, while the same sample can be analyzed in a flow cytometer to gather quantitative data regarding the magnitude of the cellular signals. The entire multiplexed single-cell detection platform is designed with graphic user interface–based software that controls all valves and pumps, allowing for hands-free operation of the platform from cell loading and stimulation to sample preparation, followed by automated analysis. The elimination of manual cell handling steps greatly reduces time and labor, and the microfluidic format reduces sample and reagent requirement by ~95%, with the added benefit of eliminating user error. The automated platform provides systems-level high-content profiling of mRNA, miRNA, and proteins in an integrated experimental space.
At the heart of the microfluidic platform is a quartz microfluidic chip with 10 individually addressable cell holding chambers ( Fig. 2A ) connected to 14 programmable valves and pumps ( Fig. 2B ). The user can program the sequence of valve openings and closings and the amount of pressure flow to automate the flow of cells and reagents in the chip. The chip’s configuration allows for automated interrogation of 10 different cell types or experimental conditions, using only 270 nL of reagent per chamber, thereby reducing the reagent cost more than 95%. The microfluidic chip sits in a manifold retrofitted to an inverted fluorescent microscope, and the user can visually track fluid and cell movement during the experiment, as well as perform brightfield and fluorescent microscopy analysis after automated sample preparation ( Fig. 2B ). After sample preparation and image capture, the chip and manifold are moved to a custom-built micro-flow cytometer ( Fig. 2C ), and cells are detached by proteolytic cleavage and hydrodynamically focused at the center of the chip for on-chip flow cytometry. In this Technology Brief, we highlight the molecular assays developed on the microfluidic platform that allow for the automated detection of miRNA, mRNA, and proteins, as well as the work flow that allows multiplexed detection of different categories of biomolecules in the same cell.
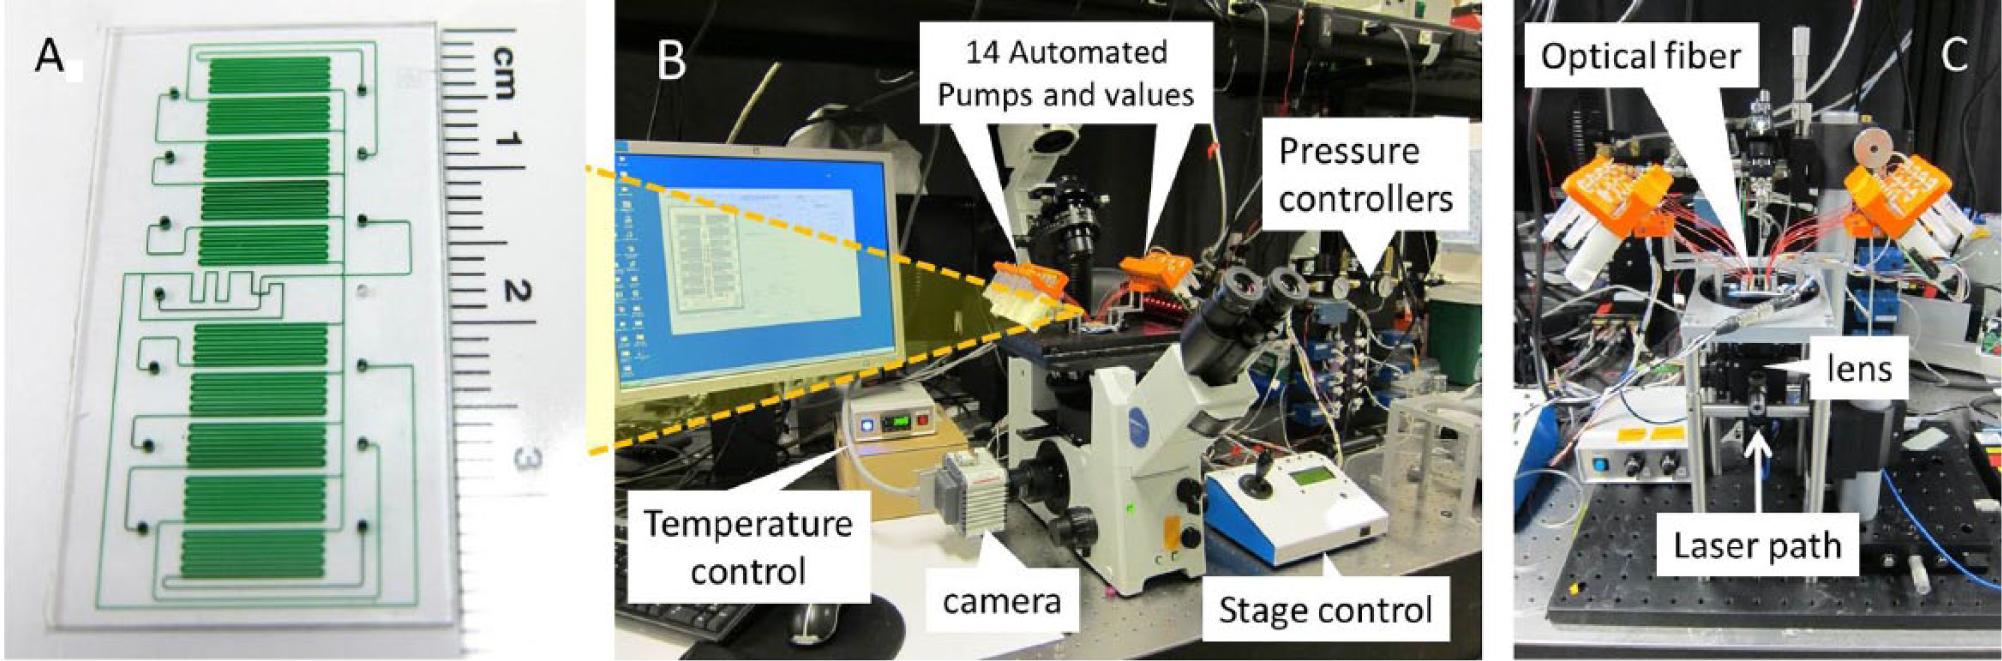
Microfluidic platform details. (
Materials and Methods
Microfluidic Platform Setup
The 10-chamber microfluidic chip was designed in-house using AutoCAD 2010 (Autodesk, Inc., San Rafael, CA), photomasks were generated at Photo Sciences (Torrance, CA), and quartz microfluidic devices were fabricated by Caliper Life Sciences (Hopkinton, MA). An array of 14 holes that were 500 µm in diameter, seven on each side, provided for fluid inlet. The chip in this study contained 10 horizontal fluidically isolatable microchannel series with the following dimensions: width of 200 µm, depth of 30 µm, and length of 72 mm, with each holding from 500 to 2000 cells and 220 nL of fluid volume. All subsequent steps in chip packaging and details of the chip platform are as previously described. 4
Cell Culture and Stimulation
The RAW 264.7 murine macrophage cell line was purchased from ATCC (Manassas, VA), cultured in growth medium consisting of 450 mL of Dulbecco’s modified Eagle’s medium (DMEM), 50 mL of fetal bovine serum (FBS) (100-500, Gemini, West Sacramento, CA), 10 mL of HEPES, 5 mL of L-glutamine (200 mM), and 1:100 penicillin/ streptomycin (Gibco, Carlsbad, CA) and 200 µg/mL Geneticin (Invivogen, San Diego, CA). RAW cells were captured in the microfluidic chip and stimulated with 100 nM Escherichia coli smooth lipopolysaccharide (LPS) (L4524; Sigma-Aldrich, St. Louis, MO) in growth media for various times. Jurkat cells were purchased from ATCC (TIB-152) and cultured in RPMI media (11875-093; Invitrogen, Carlsbad, CA) containing 10% FBS (100-500; Gemini, and 0.5 mg/mL penicillin and streptomycin (15240062; Invitrogen). For stimulation of Jurkat cells, cells were seeded at 1 × 10⁶/mL for 0, 8, 16, 20, or 24 h with 10 ng/mL Phorbol 12-myristate 13-acetate (PMA) (P8139; Sigma) and 1 µM ionomycin (I3909; Sigma). After stimulation, the Jurkat cells were fixed with 8% paraformaldehyde (Electron Microscopy Sciences, Hatfield, PA) in phosphate-buffered saline (PBS) for 10 min. Fixed cells were pelleted at 300 g for 5 min and washed twice with PBS.
Cell-Tak Modification of Microfluidic Chip to Reversibly Capture Nonadherent Cells
The working Cell-Tak (354240; BD Biosciences, San Jose, CA) solution was made by combining 15 µL Cell-Tak with 575 µL 0.1M sodium bicarbonate (pH 8.0), followed by adding 10 µL 1N NaOH immediately prior to adsorption onto the chip. Freshly made working Cell-Tak solution was continuously driven into all 10-cell holding chambers of the chip for at least 15 min to thinly coat the microchannels with Cell-Tak, followed by PBS wash for 5 min to remove excess Cell-Tak from the microchannels. The coated chips were used within 1 day.
Microfluidic Assays for Cell Surface Protein Expression, Cytosolic Phosphoproteins, and Cytokine Staining
For protein immunostaining, cells were cultured for up to 4 h with 1 µL/mL of Golgi-Plug reagent containing brafeldin A (555029; BD Biosciences) and fixed with paraformaldehyde (1.5%–8%) for 10 min; incubated with fluorescent-labeled antibody targeting cell surface receptors, TLR4/MD2 receptor at 1:15 dilution (117605; BioLegend, San Diego, CA) or CD69 early T-cell activation marker at 1:100 dilution (13-0699-80; eBioscience, San Diego, CA), for 15 min; and washed for 5 min with PBS. Following cell surface staining, cells were permeabilized with 0.1% Triton X-100 and incubated with intracellular phospho-specific ERK1/2 at a 1:15 dilution (4375; Cell Signaling Technology, Danvers, MA) and intracellular tumor necrosis factor–α (TNF-α) at a 1:50 dilution (19-7321-81; eBiosciences) for 30 min.
Microfluidic mRNA and miRNA ISH
Double DIG-labeled locked nucleic acid (LNA) probes for miRNA 155 and scrambled miRNA control and an N-terminal biotin-labeled β-actin mRNA LNA probe were purchased from (Exiqon, Vedbaek, Denmark). The following LNA-containing probes were used for miRNA and mRNA detection:
miR155 (/5DigN/ACCCCTATCACGATTAGCATTAA/3Dig_N/)
Scrambled (/5DigN/GTGTAACACGTCTATACGCCCA/3Dig_N/)
β-Actin, hsa biotin-5′CTCATTGTAGAAGGTGTGGTGCCA3′
Scrambled, biotin-5′GTGTAACACGTCTATACGCCCA3′
After performing protein immunostaining as described in the previous section, the miRNA and mRNA ISH was performed on the same cells. The amplification method was performed as described previously. 5 Briefly, the following ISH reagents were made fresh: solution 1 (0.13M 1-methylimidazole, 300 mM NaCl [pH 8.0], adjusted with HCl), 1-Ethyl-3-(3-dimethylaminopropyl)carbodiimide (EDC) solution (0.16M EDC in solution 1, adjusted to pH 8.0), and hybridization buffer (50% formamide, 2× saline-sodium citrate [SSC] buffer, 50 µg/mL yeast transfer RNA [tRNA], 50 µg/mL salmon sperm, 50 mM NaPi). The immunostained cells were washed with solution 1 for 5 min, followed by incubation with solution 2 for 20 min, and then washed for 5 min with Tris-buffered saline (TBS). The cells were then prehybridized for 30 min at 62 °C in hybridization buffer prewarmed to 65 °C. All LNA probes were used with the 10-pmol/25-µL hybridization buffer and flown into predetermined chambers. The hybridization with LNA probes was performed at 80 °C for 90 s, followed by 90 min at 62 °C, and then washed with 2× SSC + 50% formamide at 65 °C for 10 min, followed by a wash with 1× SSC for 20 min at room temperature, and finally washed with 0.1× SSC for 5 min at room temperature. For the β-actin mRNA, the hybridized biotinylated LNA probe can be detected by incubation with PE-conjugated streptavidin at 1:200 (S-866; Life Technologies, Carlsbad, CA) for 30 min, followed by a 5-min TBS wash. For miRNA signal, proceed to rolling circle amplification.
Signal Amplification Using Rolling Circle Amplification
The FITC Duolink mouse PLUS (92001-0030) and mouse MINUS (92004-0030) probes and detection kit (92014-0030) from Olink Biosciences (Uppsala, Sweden) were used to perform rolling circle amplification of miRNA signals as previously described. 5 After ISH with DIG-labeled LNA probes, the cells were blocked with 2% bovine serum albumin (BSA) for 30 min at 37 °C and incubated with anti-DIG antibody (11333062910; Roche, Indianapolis, IN) at 1:50 for 1 h at 37 °C. Cells were then washed with TBS with 0.05% Tween 20 (TBST) for 5 min. The detection of the miRNA/LNA probe duplex was accomplished by amplifying the DIG antibody bound to the DIG labels on the LNA probes. The Duolink mouse PLUS and MINUS probes were diluted 1:5 (20 µL PLUS + 20 µL MINUS + 60 µL dilution buffer from kit) and incubated with cells for 1 h at 37 °C. After incubation, all chambers were washed for 5 min with TBST, and the subsequent ligation and amplification steps were done according to the manufacturer’s instructions by using only one reaction volume for all 10 chambers.
Microscopy
Brightfield, epifluorescence, and phase contrast images were captured at ×60 and ×100 magnification on an Olympus (Tokyo, Japan) IX-71 inverted microscope equipped with a CoolSNAP HQ CCD camera (Photometrics, Tucson, AZ) and Image-Pro software (Media Cybernetics, Bethesda, MD).
Flow cytometry
On-chip flow cytometry was performed using a 488-nm solid-state laser (85-BCF-020-112; CVI Melles Griot, Carlsbad, CA) in an epifluorescence configuration for excitation as previously described. 5 Briefly, the laser beam was aligned to reflect and focus on the detection region at the center of the chip by using a long-pass dichroic mirror (LPD01-488S; Semrock, Rochester, NY) and an aspheric lens (5722-H-B; New Focus, Santa Clara, CA). Forward scattering was collected by a custom-made sculpted tip silica optical fiber (1000-µm core, 2000-µm sculpted spherical tip; Polymicro Technologies, Phoenix, AZ) and channeled to a photomultiplier tube (PMT)–based detector (H5784-20; Hamamatsu, Bridgewater, NJ). Laser-induced fluorescence emission was first collected via the same aspheric lens used for focusing and subsequently detected via the dichroic mirror used in the excitation leg of the apparatus. A custom eight-channel linear multianode PMT unit coupled with filter optics (DMT560; Hamamatsu) was used for green, yellow, red, and far-red fluorescence detection. In-house software for data collection was scripted using LabVIEW (National Instruments, Austin, TX). The scatter and fluorescence captured were collected using a computer equipped with a National Instruments data acquisition module, and the data were further analyzed using the Peak Finder application in LabVIEW. The Peak Finder application fit the peak of the raw voltage signals from the PMT with a polynomial fit, generating the peak amplitude and width values.
Results and Discussion
miRNA Detection ( Fig. 3A )
The most technically challenging molecular target to detect in an intact single cell is miRNA (
Fig. 3A
). To detect miRNAs at single-cell resolution, a novel flow cytometry compatible fluorescent in situ hybridization (flow-FISH) assay to detect miRNAs using LNA-containing probes has been developed in our laboratory.
5
The LNA flow-FISH assay combines the advantage of LNA’s high melting temperature
6
with the specificity of proximal ligation and rolling circle amplification
7
to provide highly specific amplification of otherwise undetectable miRNA signals in an intact cell (
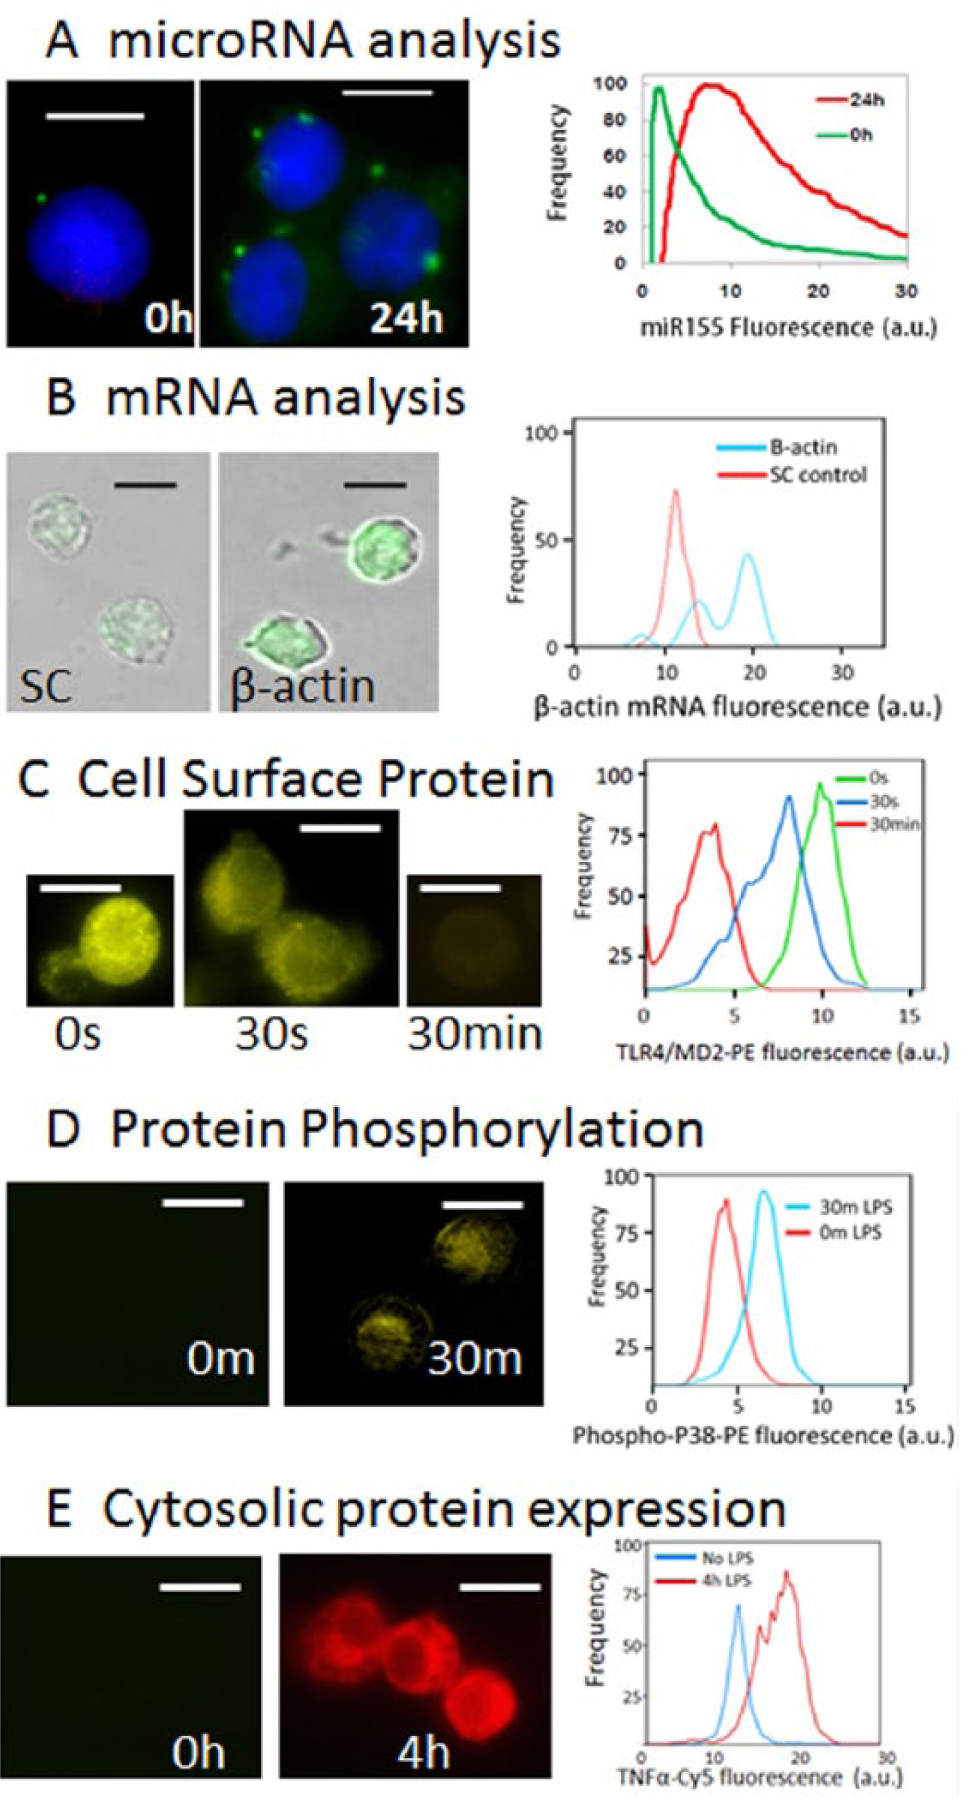
Portfolio of microfluidic molecular assays developed for the platform. (
mRNA Detection ( Fig. 3B )
The LNA flow-FISH method can easily be used to detect mRNA. Figure 3B illustrates the detection of β-actin mRNA using biotinylated LNA-containing probes. For abundant mRNA targets, no further enzymatic signal amplification is required. The mRNA/probe complex can be detected by incubating with fluorescent-labeled streptavidin. The biotin-streptavidin–based mRNA detection can be multiplexed with miRNA detection.
Cell Surface Protein Detection ( Fig. 3C )
To demonstrate the detection of cell surface proteins, we used fluorescent dye–labeled antibodies directed against cell surface proteins after initial paraformaldehyde fixation of the cells but prior to permeabilization with Triton X-100. 4 In Figure 3C , the cell surface receptor complex TLR4/MD2 was activated by LPS, and as the TLR4/MD2 complex changed conformation as a result of TLR4 activation, the complex lost affinity to the antibody directed against the inactive TLR4/MD2 complex. As a result, the fluorescence associated with the inactive TLR4/MD2 complex decreased as a function of time after addition of LPS.
Protein Phosphorylation ( Fig. 3D )
Figure 3D illustrates the detection of transient phosphorylation in signaling proteins by demonstrating the detection of phosphorylated p38 protein after LPS stimulation of macrophages. p38 is a known component of the TLR4 innate immune pathway, and the phosphorylation of p38 has been shown to lead to induction of proinflammatory genes. 8 By using phospho-specific antibodies conjugated to fluorescent dyes, any phospho-profiling of kinase cascades can be performed using the platform. 9
Intracellular Cytokine Detection ( Fig. 3E )
Intracellular proteins can be detected using fluorescent conjugated antibodies. To detect proteins that are released from the cell, such as chemokines and cytokines, a Golgi release inhibitor such as brefeldin A can be added to the culture media for up to 8 h to increase the intracellular concentration of cytokines for detection by immunostaining. 4 In Figure 3E , LPS-activated macrophages were treated with brefeldin A for 4 h, and the intracellular TNF-α protein was detected using the anti–TNF-α antibody.
Multiplexed Assay Scheme for All Biomarkers
All microfluidic molecular assays developed on the platform are compatible for multiplexing with each other and will provide systems-level analysis of signaling pathways in the native cellular context at single-cell resolution. Immunostaining the protein biomarkers prior to EDC fixation and ISH of nucleic acid probes allows for the multiplexing of protein and nucleic acid targets in the same samples, and the entire multiplexed assay can be completed in 8 h ( Fig. 4 ). The use of directly conjugated antibodies allows for the multicolor flow cytometric analysis of all biomarkers at once. The platform and accompanying assays will advance the knowledge of cell signaling pathways and their correlation with disease states, and it holds great potential for both basic cell signaling research and the development of multiplexed miRNA/mRNA/protein biomarker panels for disease diagnostics and companion diagnostics.
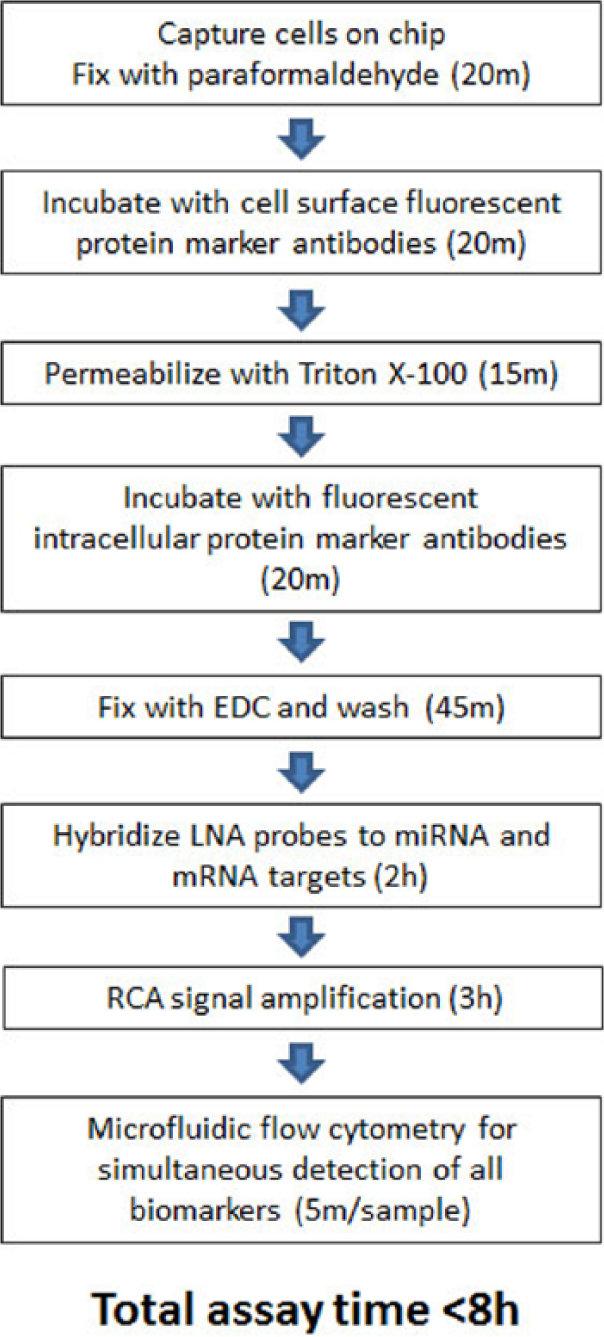
Experimental work flow for multiplexed detection of microRNA (miRNA), messenger RNA (mRNA), and proteins on the microfluidic platform. The entire protocol can be performed in under 8 h and requires 1000 to 3000 cells and only ~270 nL of reagent per condition for up to 10 different conditions. LNA, locked nucleic acid; RCA, rolling circle amplification.
Footnotes
Acknowledgements
Sandia National Laboratories is a multi-program laboratory managed and operated by Sandia Corporation, a wholly owned subsidiary of Lockheed Martin Corporation, for the U.S. Department of Energy’s National Nuclear Security Administration under contract DE-AC04-94AL85000. The authors would like to thank Dr. Aarthi Chandrasekaran for insightful comments regarding the manuscript.
Declaration of Conflicting Interests
The authors declared no potential conflicts of interest with respect to the research, authorship, and/or publication of this article.
Funding
The authors disclosed receipt of the following financial support for the research, authorship, and/or publication of this article: Financial support for preparation and some of the work included was provided by the grants: R01 DE020891, funded by the NIDCR; The MISL Grand Challenge Laboratory Directed Research and Development program at Sandia National Laboratories. Part of this research was paid by P50GM085273 (the New Mexico Spatiotemporal Modeling Center) funded by the NIGMS. The funders had no role in study design, data collection and analysis, decision to publish, or preparation of the manuscript.
References
Supplementary Material
Please find the following supplemental material available below.
For Open Access articles published under a Creative Commons License, all supplemental material carries the same license as the article it is associated with.
For non-Open Access articles published, all supplemental material carries a non-exclusive license, and permission requests for re-use of supplemental material or any part of supplemental material shall be sent directly to the copyright owner as specified in the copyright notice associated with the article.