
Abstract
The technology presented in this study demonstrates the feasibility of integrating nanostructures onto the surface of an electrical platform to achieve enhanced detection of the cardiac biomarker, troponin-T. A polymer microcontact printing technique was modified using printed circuit boards as molds for the application of gold nanoparticles onto microelectrode-patterned glass substrates. The microelectrodes were designed to support electrical impedance spectroscopy measurements and fabricated using standard photolithography methods. Capture antibodies specific to troponin-T were functionalized onto the surface of gold nanoparticles by using a thiol-based cross-linking molecule. The antibody-conjugated gold nanoparticles were stamped onto the electrodes using a matching pattern imprinted onto an elastomeric mold. As a control to validate the efficacy of the nanotextured surface on the glass substrate, an electroplated printed circuit board was also used. The incorporation of gold nanoparticles showed significant amplification of the electro-ionic signals generated through binding of the antigen to its capture antibody. Enhanced sensitivity was demonstrated through detection of the target biomarker in the femtogram per milliliter range in buffer solution and biological media. In the absence of gold nanoparticles, the sensor demonstrated detection of troponin-T at higher concentration points. This study illustrates a robust method for developing a more sensitive, label-free biosensor.
Introduction
One of the most significant dilemmas facing the medical community is the ability to diagnose diseases at early stages of development.1,2 To properly address this issue, physicians require technologies that allow for rapid, ultra-sensitive detection of biological markers associated with these illnesses. Troponin-T is a biomarker that, when detected in the bloodstream, can signify the development of a multitude of cardiovascular ailments, including pulmonary arterial hypertension, congestive heart failure, and acute myocardial damage, among others. 3 Cardiovascular diseases such as these affect one out of every three individuals in the United States and results in more than 17 million deaths globally each year. 4 It has been shown that concentrations of the biomarker in the picogram per milliliter (pg/mL) and higher regimes are indicative of serious cardiac damage. 5 Most of the technologies on the market today resort to enzyme-linked immunosorbent assay (ELISA) techniques, which show consistency at detecting proteins above 10 pg/mL. However, they can be time-consuming and require trained laboratory personnel for execution. Also, to effectively use the prognostic capability of this biomarker, an approach must be developed to identify troponin-T at a much lower concentration than is possible with the “gold-standard” methods currently in use.
Nanostructures have been used extensively with biosensing systems in attempts to enhance performance of the device by using the favorable properties associated with reduced size of the material. Gold nanoparticles in particular are widely used in this field due to their capacity for significantly enhancing transduction signals of a sensing system. 6 Because this biologically inert material does not affect molecular structure or activity, gold nanoparticles can be easily functionalized with biological macromolecules to allow for detection using a variety of optical and electrochemical transduction mechanisms. 7 Another beneficial characteristic of nanoparticles is the large surface area of their structure relative to their volume. This feature creates additional area that may allow for a greater number of reactions to occur at the surface of the material.8,9 For example, the increased surface area of gold nanoparticles has been previously used as a means of functionalizing larger quantities of proteins compared with using planar electrodes or even nanomaterials with different geometries. As a greater number of antibodies become available for biological interactions to occur, it is possible to distinguish target molecules at much lower concentrations through various sensing mechanisms.
Electrochemical sensing methodologies have become increasingly prevalent due to their simplicity and ability to rapidly detect molecules at lower concentrations compared with other approaches. 10 In addition, gold nanoparticles can be of significant benefit to these systems because they can assist in amplifying electrical signals due to their high conductivity. 11 This study aims at using electrochemical impedance spectroscopy (EIS) for detection due to its capacity for identifying changes occurring at the surface of the organic-inorganic interface without the incorporation of labels or tags. Currently, there are a number of label-free technologies for biomolecule detection using EIS, but there are some limitations in the detection metrics, such as high background noise resulting in high limit of detection, poor specificity, and modification of the detected analyte due to the use of redox probes.12 –14 In recent years, gold nanoparticles have been used in conjunction with EIS. So far, these technologies are still limited in their applicability for lab-on-a-chip diagnostics, due to lengthy, complex setups that hinder it from being integrated as a valuable diagnostic tool.7,8
The platform described here aims to resolve some of these issues through a method of microcontact printing using an elastomeric polydimethylsiloxane (PDMS) stamp. Microcontact printing has been used extensively for soft lithographic applications, where the molded relief on the stamp imprints a self-assembled monolayer (SAM) in a patterned fashion on the substrate. 15 The SAMs commonly printed onto substrates include cross-linking molecules, such as thiolates, but biological molecules have also been patterned using this technique. 16 Instead of printing with traditional SAMs, we used an “ink” containing antibody-functionalized gold nanoparticles to create a modified immunoassay for enhanced biomarker detection. The array of antibody-conjugated nanoparticles printed onto our platform helped to achieve the ultra-sensitivity and specificity necessary for detecting troponin-T at significantly lower levels than those that are currently available. In addition, using printed circuit boards and glass substrates with lithographically created electrodes allows for rapid prototyping and low-cost manufacturing of sensor platforms. Glass substrates also offer an added benefit of being used when visual methods, such as microscopy, are necessary for evaluation of the assay.
Materials and Methods
Sensor Design and Fabrication
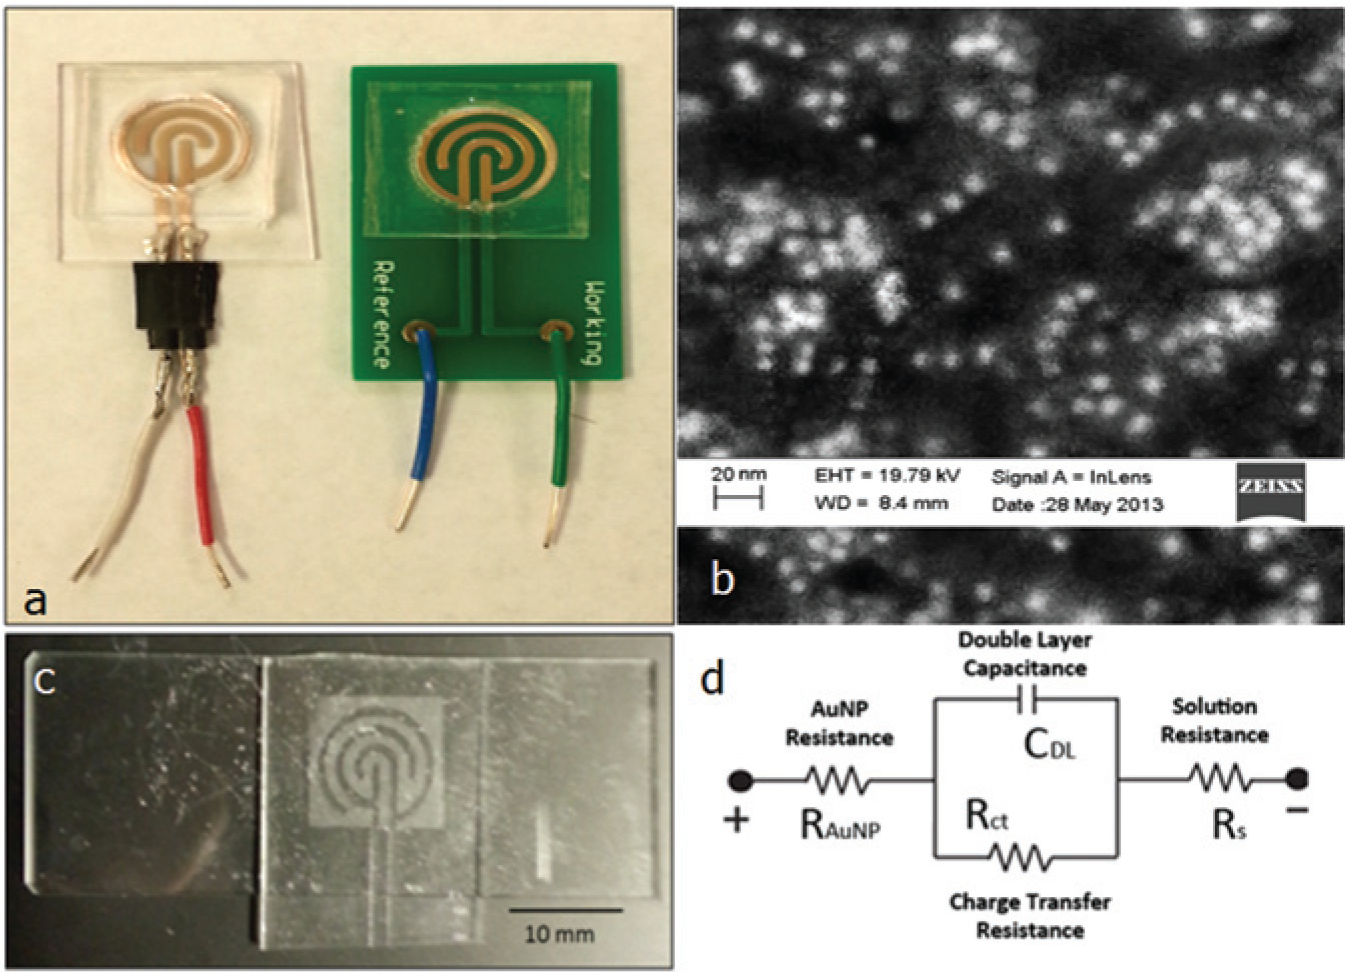
The sensor platform consisted of a 2-mm-thick glass substrate approximately 1 × 1 inch, which was subjected to UV photolithography for electrode patterning. Standard lithographic techniques were applied, starting with an S1813-positive photoresist spin coated on the glass, followed by UV exposure, metal deposition, and a liftoff procedure. The photomask used during exposure allowed for creation of a concentric circular design of gold electrodes on the substrate. Figure 1a shows the interdigitated pattern of the working and reference electrodes on glass as well as the corresponding electroplated design on a printed circuit board (PCB). This particular design was used to create a uniform electric field by eliminating possible edge effects. Each electrode was 1 mm wide with 1 mm spacing between each edge. The overall diameter of the sensing site was 13 mm. Leads were connected to the electrodes using silver epoxy. To keep fluid samples confined to the sensing area, a PDMS manifold was created with a round opening to match the dimensions of the outer circular electrode. Figure 1a displays each individual piece used in the fabrication and assembly of both platforms.
(
Gold Nanoparticle Conjugation
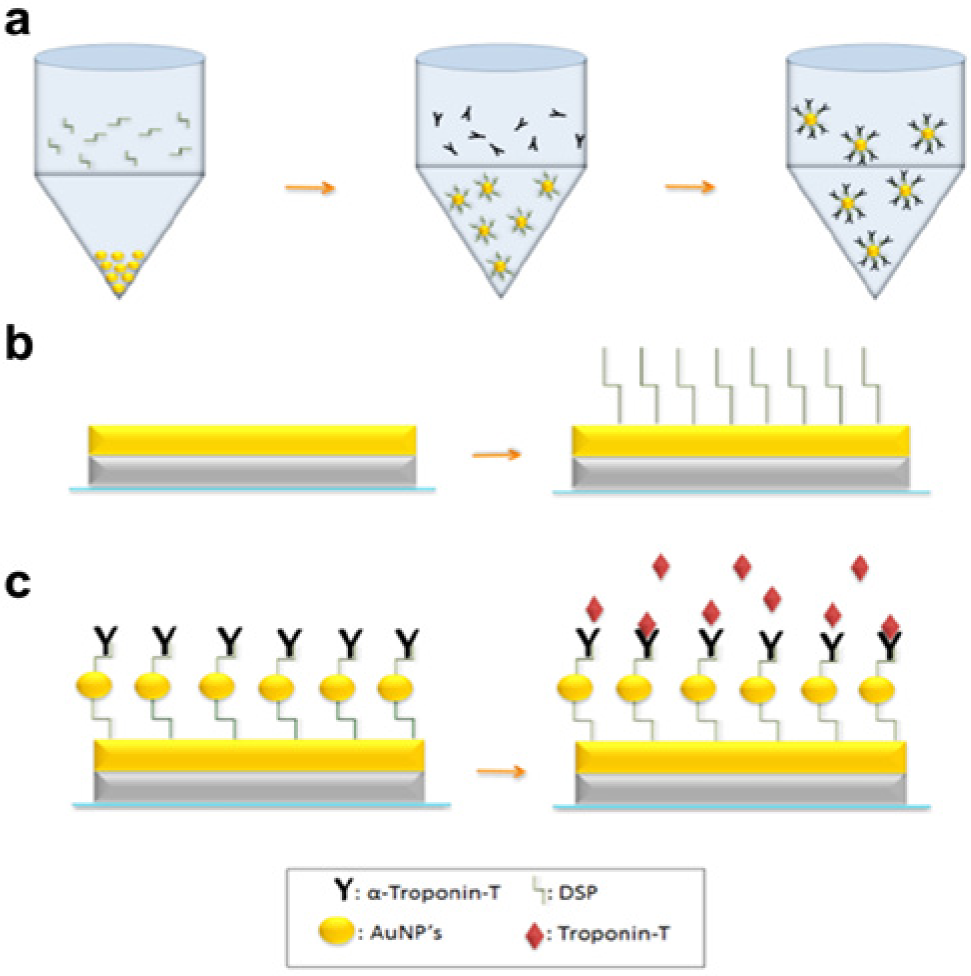
Figure 2a illustrates the protocol used for the conjugation of capture antibodies onto gold nanoparticles (AuNPs). First, a 0.05% weight-by-volume solution of AuNPs was prepared in phosphate-buffered saline (PBS). The solution was subjected to centrifugation for 10 min at 12,000 rpm. The PBS was removed and a 10-mM solution of dithiobis succinimidyl propionate (DSP) dissolved in DMSO was added. The AuNP/DSP solution was incubated at room temperature for 30 min. The solution was then centrifuged at 12,000 rpm for 10 min. The DMSO was removed, and a 250-ng/mL sample of α–troponin-T antibodies in PBS was added to the AuNP/DSP. The solution was incubated at 4 °C for 2 h. During the long incubation, another 10-mM solution of the thiol-linking agent was added onto the circular pattern of the sensing site on the glass substrate. The solution was allowed to incubate at room temperature for 30 min. Figure 2b shows a cross section of the metal electrodes along with the bound DSP cross-linking molecules.
(
Elastomeric Stamp and AuNP Printing
Two PDMS stamps were fabricated by pouring the liquid elastomer on a relief of the electrode pattern that was created on the PCB substrate. The PCB substrate was used as the mold for fabricating the PDMS stamp. The 1-mm-thick PDMS elastomer was cut to the size of each substrate: approximately 1 × 1 inch for the glass and 1 × 1.5 inches for the PCB. The cured stamps were placed in a plasma etcher for 5 min to create a hydrophilic surface on the stamp. Immediately following the plasma treatment, the antibody-conjugated AuNPs were pipetted onto the surface of the elastomeric stamps. Both substrates were then placed upside down onto the stamps, with the raised edges of the PDMS aligned with the concentric circular design of the sensing site. The setup was allowed to incubate at 4 °C for 2 h. Figure 1c shows the design of the elastomeric stamp. After incubation, both substrates were removed from the stamp and the manifold was placed onto the platform. Figure 1b shows a scanning electron microscope (SEM) image of the gold nanoparticles on the surface of the electrodes after the removal of the stamp. Calculations using the SEM images show that an average of 2680 gold nanoparticles are bound to the surface per square micron of the electrodes.
Electrochemical Impedance Spectroscopy
EIS was the applied method for detection of troponin-T due to its capacity for low limits of detection as well as the speed with which it can be executed. To effectively implement this electrochemical technique, a transduction element must be designed that can “sense” electrical changes due to biochemical interactions at its surface. Normally, EIS is performed using redox probes in a three-electrode setup, often modeled using the schematic diagram known as a Randle’s circuit. 17 The proposed platform can be represented by a modified version of this equivalent circuit model, which can be seen in Figure 1d . The initial component, RAuNP, represents the overall resistance offered by the gold nanoparticles printed on the electrodes. The resistor-capacitor combination denotes the effects of the charge transfer due to the interaction of proteins and buffer medium on the AuNPs present on the electrode surface. The resistive component of this charge transfer is termed Rct. The antibody-conjugated AuNPs form an electrical double-layer region at the liquid-metal interface, represented as a capacitive double layer termed Cdl. The charged ions in the media offer resistance to the flow of current in the bulk, which can be denoted by an independent resistive component, Rs. Using this strategy for detection of troponin-T requires interaction of the biomarker at the junction between the fluid media and the electrode surface. This interface is known as the electrical double layer (Edl) and measures approximately 50 nm in thickness. When a sample of fluid, such as PBS, is added onto the sensor and a potential is applied, there will exist a distribution of charges at this junction. The Edl acts as a parallel plate capacitor, with charges building up on both sides of the solution-metal interface. This charge distribution can be characterized by an impedance output provided using a potentiostat, which calculates the voltage-to-current ratio of the system. As molecules become immobilized on the electrode surface, the previous charge distribution becomes disrupted and a change in the measured impedance value will occur. In this case, as the antibody-conjugated gold nanoparticles and troponin-T interact at the surface of the electrodes, the impedance of the system will decrease. These impedance changes can be mapped to specific concentrations of the biomarker and result in a calibration curve with which to compare patient samples of unknown troponin-T quantity.
With EIS, the potential applied to the electrodes is an alternating current (AC) voltage and is always relatively small (on the order of millivolts) when working with biological molecules. This is due to the denaturation of the macromolecular structure that accompanies the use of large input voltages. Because the potential applied to the circuit is AC, there also exists a frequency component that must be taken into account. The frequency was originally swept from 100 mHz to 1 MHz to identify the range where capacitance was the dominant factor in determining the resultant impedance measurement. The range of frequencies applied to the sensor was narrowed down to between 50 and 1200 Hz. To establish a set of impedance values for each sample, the 100-Hz frequency was designated as the point of reference. The reason for choosing this specific frequency was that it allowed for the greatest changes in impedance between samples.
Immunoassay Protocol
After the antibody-conjugated AuNPs were printed onto the circular electrode patterns, 200 µL of Superblock (ThermoFisher Scientific, Rockford IL) was added to the sensing site and allowed to incubate for 15 min. After this step of blocking the unbound N-hydroxysuccinimide (NHS) sites on the cross-linker, a wash was performed on the sensor using PBS without any added molecules. The buffer, by itself, acts as a “blank” solution. Since this step represents a sample with zero concentration of biomarkers, an impedance measurement was taken to identify the baseline value with which to compare all subsequently tested samples. The “blank” sample was then removed from the sensing site to allow the lowest concentrated dose of troponin-T to be added onto the sensor. Following removal of the buffer from the sensor, 200 µL of a 1E-5–pg/mL sample of troponin-T diluted in PBS was placed onto the sensing site. The solution was allowed to incubate at room temperature for 15 min before another impedance measurement was taken. The sample was then removed, and a 3× PBS wash was performed prior to the addition of the next solution. This procedure was repeated for samples of troponin-T diluted in PBS at concentrations of 1E-5, 0.01, 0.1, 10, and 100 pg/mL. All impedance measurements were taken using a Gamry Reference 600 potentiostat (Gamry Instruments, Warminster, PA) with input parameters consisting of a 10-mV AC voltage and frequencies ranging from 50 to 1200 Hz. Figure 2c illustrates this unique immunoassay formed on the surface of the gold electrodes capable of binding the target protein.
After the experiments were run using PBS, the sensor was tested for application in biological media. The same protocol was employed, but instead of diluting troponin-T in PBS, human serum was used as the media solution. The human serum used in these experiments maintained a pH of 7.3 and contained a total protein concentration of approximately 6 g/dL, consisting of, but not limited to, albumin, phosphatase enzymes, transferase enzymes, and lactate dehydrogenase. It also contained a number of various biochemicals, including, but not limited to, cholesterol, creatinine, hemoglobin, bilirubin, glucose, uric acid, and triglycerides. The troponin-T experimental samples were diluted directly into the human serum without any pretreatment.
Results and Discussion
The proposed sensor platform uses the favorable properties associated with gold nanoparticles and the technique of electrochemical transduction to obtain enhanced detection of the cardiac biomarker, troponin-T. To test the robustness of the biosensor, we attempted to detect this protein at extremely low concentrations, ranging from 1E-5 pg/mL to 100 pg/mL. Using EIS, the device was able to detect the biomarker of interest at concentrations in the femtogram per milliliter concentration regime in isotonic buffer as well as in biological media. Three replicates were completed for each media type on both the glass and PCB substrates. Experiments were also conducted without the use of gold nanoparticles to provide a control for comparison. All results provided in this study are displayed as changes in impedance. The change in impedance was calculated by subtracting the impedance value measured for each of the concentrated samples from that of the zero concentration baseline value. Because each troponin-T sample measurement is compared with the baseline measurement, the corresponding change in impedance can be directly correlated to that specific biomarker concentration.
Signal Classification
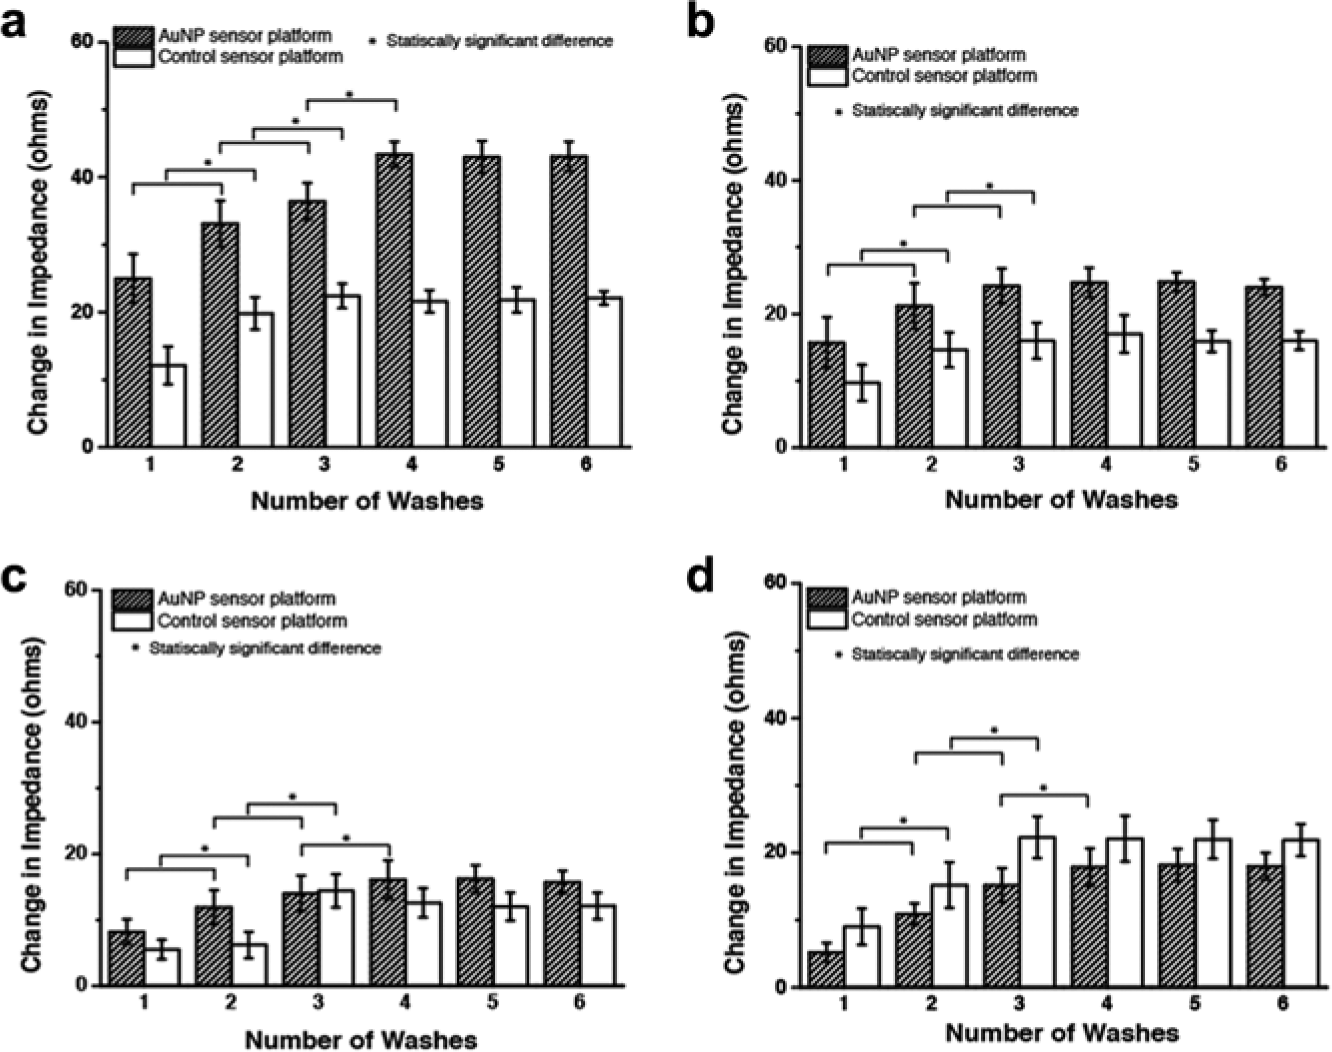
To understand the limitations of a sensor platform, it is essential to characterize its various performance metrics. For immunoassays in particular, the most important of these concepts are the limit of blank (LoB), limit of detection (LoD), and dynamic range of detection. These analytical metrics are necessary because they provide a minimum and maximum boundary for the amount of analyte that can be detected and quantified using the given technology. LoB can be defined as the highest apparent analyte concentration expected when samples devoid of any target analyte are tested. 18 The LoB was calculated by first measuring the change in impedance between the last preparatory step and a sample of purified buffer. The biosensors were prepared until the Superblock step according to the aforementioned immunoassay protocol. Impedance measurements were first taken with the Superblock solution on the sensor platforms. Following this step, a blank PBS wash was performed six times with impedance measurements being taken for each. The change in impedance was calculated by taking the difference between the Superblock and buffer measurements. Figure 3 shows the results of these impedance changes for each of the “blank” PBS samples. The LoB could then be calculated using equation (1):

Analysis of signal interference for (
where µb is the mean value of concentration and σb is the standard deviation estimated from the six samples of buffer tested on the sensor platform. The test was repeated in the same manner using untainted human serum instead of PBS. The experimental LoB with AuNPs was estimated to be 8.63E-3 pg/mL and 9.0E-3 pg/mL for PBS and human serum, respectively.
The performance of the sensor as shown in Figure 4 (dose response) demonstrates the dynamic range of operation for the sensor. Generally, the performance of the sensor platform is not reliable over the entire range. Hence, LoD estimation was required for identifying the lowest actual concentration at which detection and estimation can be performed reliably and feasibly. To effectively demonstrate and represent the appropriate detection limits of troponin-T using this method, the issue of signal interference, also known as analytical noise, had to be properly addressed. Using this type of detection strategy, noise can be attributed to the bulk solution as well as any nonspecific biomolecule interaction occurring on the electrode surface. However, by adjusting the technique to specifically evaluate changes occurring at the electrical double layer, the interfering signal related to the bulk solution is significantly reduced. In other words, the noise associated with nonspecific binding at the electrical double layer becomes the most important factor to consider. Experiments were carried out to help in differentiating impedance changes correlating to noise versus signals resulting specifically from the desired antibody-antigen binding events. A specific, relevant signal corresponding to this type of protein interaction was defined as the impedance change that is three times greater than the interfering signal.
Detection of various concentrations of troponin-T using electrochemical impedance spectroscopy with and without the use of gold nanoparticles (AuNPs). (
In addition to establishing the LoB, the experimental results shown in Figure 3 can also be used to help in determining the signal noise characteristics of the system. The impedance changes between the Superblock step and the subsequent PBS wash steps were suitable for this analysis since the signal change due to the presence of a blank buffer with respect to a completely prepared sensor platform directly corresponds to the interfering signal of the sensor platform. The results show that the change in impedance for both substrates seems to steady after three washes with both the buffer and human serum. This steady-state impedance change was established as the noise for each platform. Therefore, the LoD was recognized as the lowest concentration corresponding to a signal at least three times the noise values seen in Figure 3 for each substrate and corresponding media.
For the PCB substrates with AuNPs, an impedance change of 43 Ω was observed for a blank PBS solution. Similarly, for the control PCB substrates, an impedance change of 22 Ω was observed. In the case of glass substrates with AuNPs, an impedance change of 25 Ω was observed for a blank PBS solution, whereas 16 Ω was observed for the control without AuNPs. The impedance changes corresponding to these experiments can be visualized in Figure 3a , b . Since human serum is a complex matrix with a number of cross-reactive biological molecules, the signal interference tests were repeated with these media in the place of PBS. In this case, the PCB substrates with AuNPs maintained an impedance change of 16 Ω, while the glass substrates with AuNPs showed an impedance change of 22 Ω. An impedance change of 12 Ω and 18 Ω was observed for the PCB and glass controls tested with PBS and the human serum solution, respectively. The impedance change corresponding to these experiments can be visualized in Figure 3c , d .
Troponin-T Detection
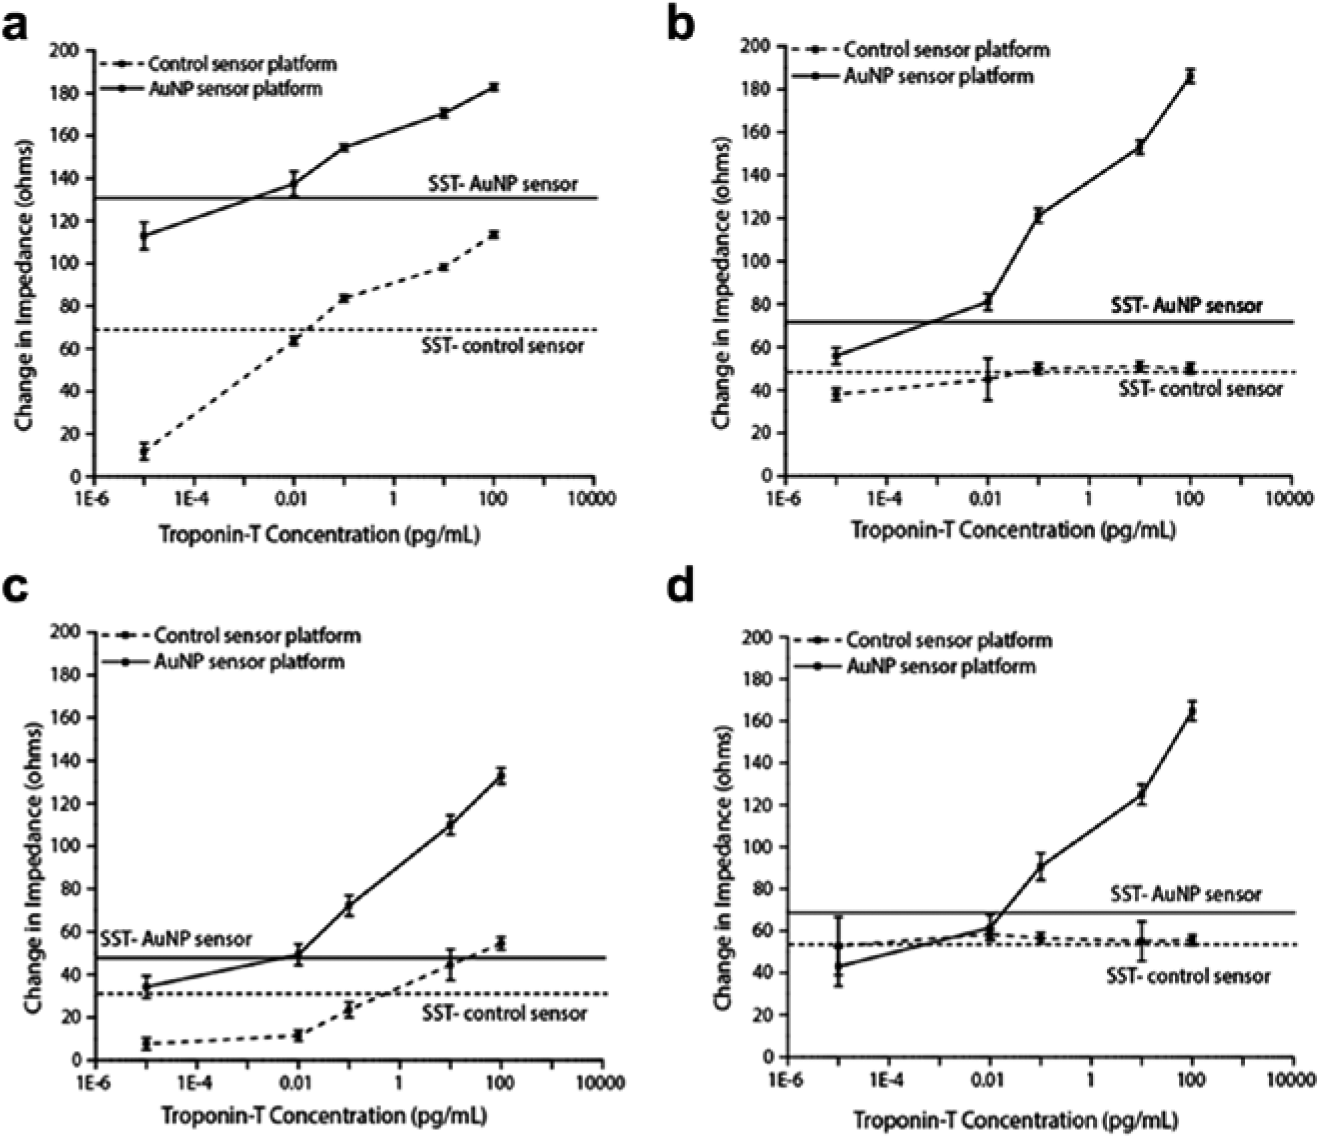
The two plots seen in Figure 4a , b represent the performance of the sensor with and without the use of AuNPs in PBS on two different substrates: electroplated PCB and lithographically patterned glass. The benefit of using gold nanoparticles is evident by comparing the different sensor responses. The change in impedance value that corresponds to a specific signal threshold (three times the noise signal) is shown in the figure as a horizontal line. Without the use of gold nanoparticles, the lowest dose of troponin-T that could be specifically detected in PBS media was 0.1 pg/mL for the PCB substrate. The changes in impedance for this platform ranged from 11 Ω for the lowest concentration to 113 Ω for the 100-pg/mL sample. In the case of the glass substrate, the sensor demonstrated an output signal response very close to or below the specific signal threshold for the system. When using this substrate without AuNPs, the impedance changes ranged from 39 Ω to 51 Ω.
When using antibody-conjugated AuNPs, the electrical signal generated was amplified, providing a limit of detection 10-fold lower on the PCB platform and actual protein detection on the glass substrate platform. The target biomarker was detectable up to 100 pg/mL for both the PCB and glass substrates. When testing the PCB substrates, the changes in impedance ranged from 113 Ω for the 1E-5–pg/mL concentration to 183 Ω for the 100-pg/mL sample. For the glass substrates, the changes in impedance started at 53 Ω for the lowest concentration and increased for each subsequent concentration to 172 Ω for the 100-pg/mL sample. The R2 values were also calculated for the two experimental conditions, showing 0.93 for the PCB substrate and 0.98 for the glass.
To establish the robustness of the sensor for molecular detection, tests were performed on samples of troponin-T in biological media. Figure 4c , d illustrates a similar representation of data as that of the previous figure, but in this case, human serum was used as the media instead of PBS. Again, the trends in the two plots clearly show the benefit of using gold nanoparticles when attempting to detect small quantities of the cardiac biomarker. Figure 4c , d shows the specific signal threshold value of impedance changes required for an output signal to be classified as “noise free” and relevant to the specific detection of troponin-T. Using gold nanoparticles, the limit of detection for troponin-T in human serum was 0.1 pg/mL on the glass substrate, showing increased changes in impedance for each sample in the immunoassay to 100 pg/mL. The impedance changes ranged from 43 Ω for the lowest concentration to 165 Ω for the most concentrated sample. The PCB substrate was able to detect the presence of troponin-T starting at 0.01 pg/mL and continuing to 100 pg/mL. The impedance changes for the PCB were calculated to be 34 Ω for most dilute sample and increased to 133 Ω for the 100-pg/mL concentration. The R2 values calculated for these two experiments show 0.92 for the PCB substrate and 0.98 for the glass.
Without using AuNP, the PCB was able to detect the target biomarker in human serum between 10 and 100 pg/mL. The changes in impedance ranged from 8 Ω for the lowest dose to 55 Ω for the highest concentration. Using the glass substrate without AuNPs, the signal response was approximately at the specific signal threshold value, making detection of troponin-T with confidence not possible. The changes in impedance using this substrate ranged from 53 Ω for the least concentrated dose to 56 Ω for the highest concentrated sample. In both cases of buffer media, the use of AuNPs provided a broader dynamic range of output signal measured for the various concentration doses of troponin-T tested.
The error displayed for both plots in the figure was calculated using the standard error of the mean between triplicate experimental runs. As mentioned previously, the limits of detection were established by evaluating the issue of noise. By comparing the impedance values measured for each troponin-T sample with the noise, the lowest antigen concentration that allowed for a 3:1 signal-to-noise ratio or better was determined to be the limit of detection for that experimental condition. 19
Biosensor Setup
As stated previously, detection using EIS is accomplished by monitoring electrical changes at the Edl that are a direct result of molecular interaction. Previous work indicates that specific detection of biomarkers can be accomplished using immunoassays that are immobilized directly onto the surface of a transduction element using a cross-linking molecule.20,21 These techniques have shown effectiveness but can be improved through the use of nanostructures. Instead of attaching the monoclonal capture antibodies directly to the sensing site of the platform, they were first functionalized to the surface of gold nanoparticles using DSP as a linker. When the DSP/DMSO solution is added to the AuNPs, the thiol groups in the spacer arm of DSP bind with the gold. The other end of the DSP is an NHS ester group that will form an amide bond with primary amine groups at the base of the Fc region on the capture antibody.
After immobilizing the α–troponin-T antibodies to the gold nanoparticles, a unique method was employed to affix the complexes to the sensing site. This was achieved using a method of soft lithography known as microcontact printing. A stamp was created by pouring liquid PDMS over a relief of the pattern associated with the platform’s sensing site. Prior to printing the antibody-conjugated gold nanoparticles onto the gold electrodes, the PDMS stamp was plasma treated to make its surface hydrophilic. This was very important for creating a uniform distribution of the aqueous solution on the PDMS stamp. A common issue with elastomeric stamps is sagging and pairing of the raised portion of the PDMS. This was of no concern due to the slightly larger electrode geometry and the functionalized AuNPs’ lack of affinity for the substrate material. The larger electrode size allows for a stamp to be created that is more robust and can be used for a greater number of prints.
The sensing site on the substrate was pretreated before stamping by adding a DMSO solution containing the thiol cross-linking agent to the surface of the electrodes. This allowed for exposure of the linker’s reactive groups on the surface of the gold electrodes. These functional groups assist in immobilizing the gold nanoparticles onto the electrode surface through reactions with the amino acid side chains of the conjugated antibody. After the AuNPs were positioned on the platform’s sensing site, it was possible to test samples for the presence of troponin-T.
Biosensor Performance
When using the AuNPs, the electrical response of the sensor platform displayed greater changes of impedance with larger quantities of troponin-T. As increased concentrations of troponin-T were added to the sensor, a greater amount of binding occurred between the biomarker and its conjugate antibody attached to the gold nanoparticles. As more biochemical interactions occurred between the protein conjugates, the lower the impedance fell from the baseline value, which in turn increased the change in impedance. This decrease in impedance due to molecular binding is a direct result of enhanced charge transfer at the Edl.
The advantages of using AuNPs for ultra-sensitive detection are evident when using both types of substrates. One interesting observation was the lack of detection seen when measuring impedance changes on the glass substrates without the use of AuNPs. These control runs displayed difficulty in detecting troponin-T above the required signal threshold throughout the immunoassay. When stamping the lithographically patterned electrodes with AuNPs, it was then possible to detect the cardiac biomarker at relevant concentrations. Using the PCB substrate, the LoD decreased 10-fold and 100-fold for PBS and human serum, respectively. This decrease in LoD and increase in dynamic range of detection allow for greater confidence in concentration estimations by reducing errors associated with false positives or negatives.
Difficulties will commonly arise when testing sensors in biological media versus purified buffer media. This is evident by the response seen with the sensor using human serum on both substrates lacking the application of AuNPs. Often, sensors lose the ability to reliably detect specific biomolecules in a sample filled with an abundance of different dissolved proteins. 22 Also, media such as serum are less conductive than buffers containing large numbers of charge-carrying ions. The application of gold nanoparticles plays a pivotal role when using biological media because the increased conductivity of the material allows for amplified charge transfer at the Edl regardless of the solution used. Without gold nanoparticles, the measured impedance values of the system will rise due to the resistance offered by the contents of the human serum media.
From the data seen in Figure 4 , it is apparent that the gold nanoparticles acted to amplify the changes in impedance produced when concentrated samples of troponin-T were analyzed. This is most likely due to a few favorable characteristics that the nanoparticles possess. First, the 5-nm gold nanoparticles have a much greater surface area to volume ratio compared with that of planar electrodes. If all the gold nanoparticles prepared for each of the immunoassay experiments were functionalized to the surface of the sensor, it would increase the reactive surface area by approximately 3 cm2. This larger surface area allows for the immobilization of greater amounts of antibody on the surface of the nanoparticle, increasing the likelihood of antigen capture. Second, the nanoparticles used in the experiment were specifically chosen to be gold. This not only allowed for functionalization of antibodies onto the nanoparticle surface but also allowed for amplified charge transfer between the bound complex and the electrodes. Gold, in general, is already an inherently conductive material, which is the reason for it commonly being used for electrical systems. The highly conductive gold nanoparticles allow for increased charge transfer through the Edl, which will create an amplified electrical signal in the form of a large drop in impedance. Accordingly, when minute quantities of troponin-T interact with antibody-conjugated gold nanoparticles in this region, a more sizable electrical signal will be generated, resulting in enhanced detection at lower antigen concentrations.8,9
One important aspect that still needs to be addressed is the ability of the sensor platform to perform after being stored for long periods. Under the current biosensor setup method, the device would have to be stored at 4 °C to ensure that the antibodies remain stable. This is the suggested information provided by the vendor for stability of monoclonal antibodies.
In conclusion, the work presented in this study demonstrates the use of gold nanoparticles in combination with electrochemical impedance spectroscopy for the detection of very small quantities of the cardiac biomarker, troponin-T. The nonfaradaic form of EIS used in this work proved to be an effective method for molecular detection due to its rapid transduction mechanism and sensitivity. When gold nanoparticles were incorporated into the electrochemical detection strategy, sensitivity of the system increased significantly for both glass and PCB substrates. Antibody-conjugated gold nanoparticles were functionalized onto the surface of the electrodes using the method of microcontact printing. This was performed to create an immobilized immunoassay at the electrical double layer, which translated biochemical antibody-antigen interactions into electrical signals.
Future studies will focus on development and testing of this device for future applicability as a point-of-care diagnostic platform. Decreasing sensor setup time and increasing the shelf life of the platform are immediate challenges for generating a more functional device. Also, the platform needs to be tested on a large cohort of patient samples to validate the performance against current detection schemes such as ELISA. It is possible that this technique for troponin-T recognition can be applied toward identification of other various biomarkers as well, such as glycans and nucleic acids.
Footnotes
Acknowledgements
We thank the UT Dallas Clean room for fabrication and characterization facilities.
Declaration of Conflicting Interests
The authors declared no potential conflicts of interest with respect to the research, authorship, and/or publication of this article.
Funding
We thank Cecil and Ida Green Endowment in Systems Biology Science for partial support of M. T. Jacobs and A. P. Selvam.