
Abstract
Cellular dielectric spectroscopy (CDS) provides realtime, label-free, universal measurements, enabling comprehensive pharmacological evaluation of cell surface receptors in living cells. The sensitivity of the measurement allows monitoring of ligand-mediated activation of endogenous receptors, therefore generating physiologically relevant data. Activation of receptors results in CDS response profiles that are characteristic of main subsets of G-protein coupled receptors (GPCRs) within a cell line. This allows cluster analysis of response profiles that may be used in several important applications, which include identification of the G-protein coupling of orphan GPCRs and the cataloging of active endogenous receptors in cells. In this study, CDS technology is used in the pharmacological evaluation of multiple receptors in many cell types, including primary cells. Specifically, data is presented demonstrating hit confirmation, receptor selectivity analysis, ligand potency, and Schild analysis of receptor-selective antagonists. CDS results compare favorably to other cell-based assays, and the robustness and reproducibility of CDS assays are reflected by low assay coefficient of variation (CVs) and reliable Z'-scores of the data. Because CDS requires no stable or transiently transfected cells or special reagents, assay development and data acquisition is simple and fast. The ease of use, universality, and label-free nature of the CDS-based platform make it well suited to secondary screening applications in drug discovery.
Keywords
Introduction
Cellular dielectric spectroscopy (CDS) is a novel technology that enables comprehensive pharmacological evaluation of endogenous cell surface receptors using a label-free, real-time, kinetic cell-based assay approach. In addition, CDS is universal, allowing measurement of multiple types of receptors, including G protein-coupled receptors (GPCRs), tyrosine kinase receptors (TKRs), and nuclear receptors using the same platform, without the need for any modification of the cell. The unique information generated by CDS allows identification of receptor-mediated signal transduction, which can be used for further characterization (e.g., deconvolution of orphan GPCRs).
CDS technology is based on monitoring the impedance (Z) of an applied electrical current as it flows through a cell monolayer. Previously published work established the use of impedance measurements for investigating the material properties of cells. 1 –10 For example, impedance measurements have been successfully applied to monitoring cell membrane conductivity, 11 –15 monolayer permeability, 16 –19 morphology, 20 –22 migration, 23,24 and cellular micromotion. 25 Work has also been done that describes the use of a single frequency to measure the activation of cell surface receptors. 26 –28 The commercially available CellKey™ system 29 (Fig. 1) builds upon and extends this body of work by enabling impedance measurements and fluid delivery to the cells to be made simultaneously by incorporating fluidics consisting of an onboard 96-channel dispense head with adjustable dispense speed, pipette height, and mixing capability. In addition, impedance measurements are monitored across a large range of frequencies (1 kHz-110 MHz), yielding more complex information that is characteristic of receptor-mediated signaling pathways being activated.
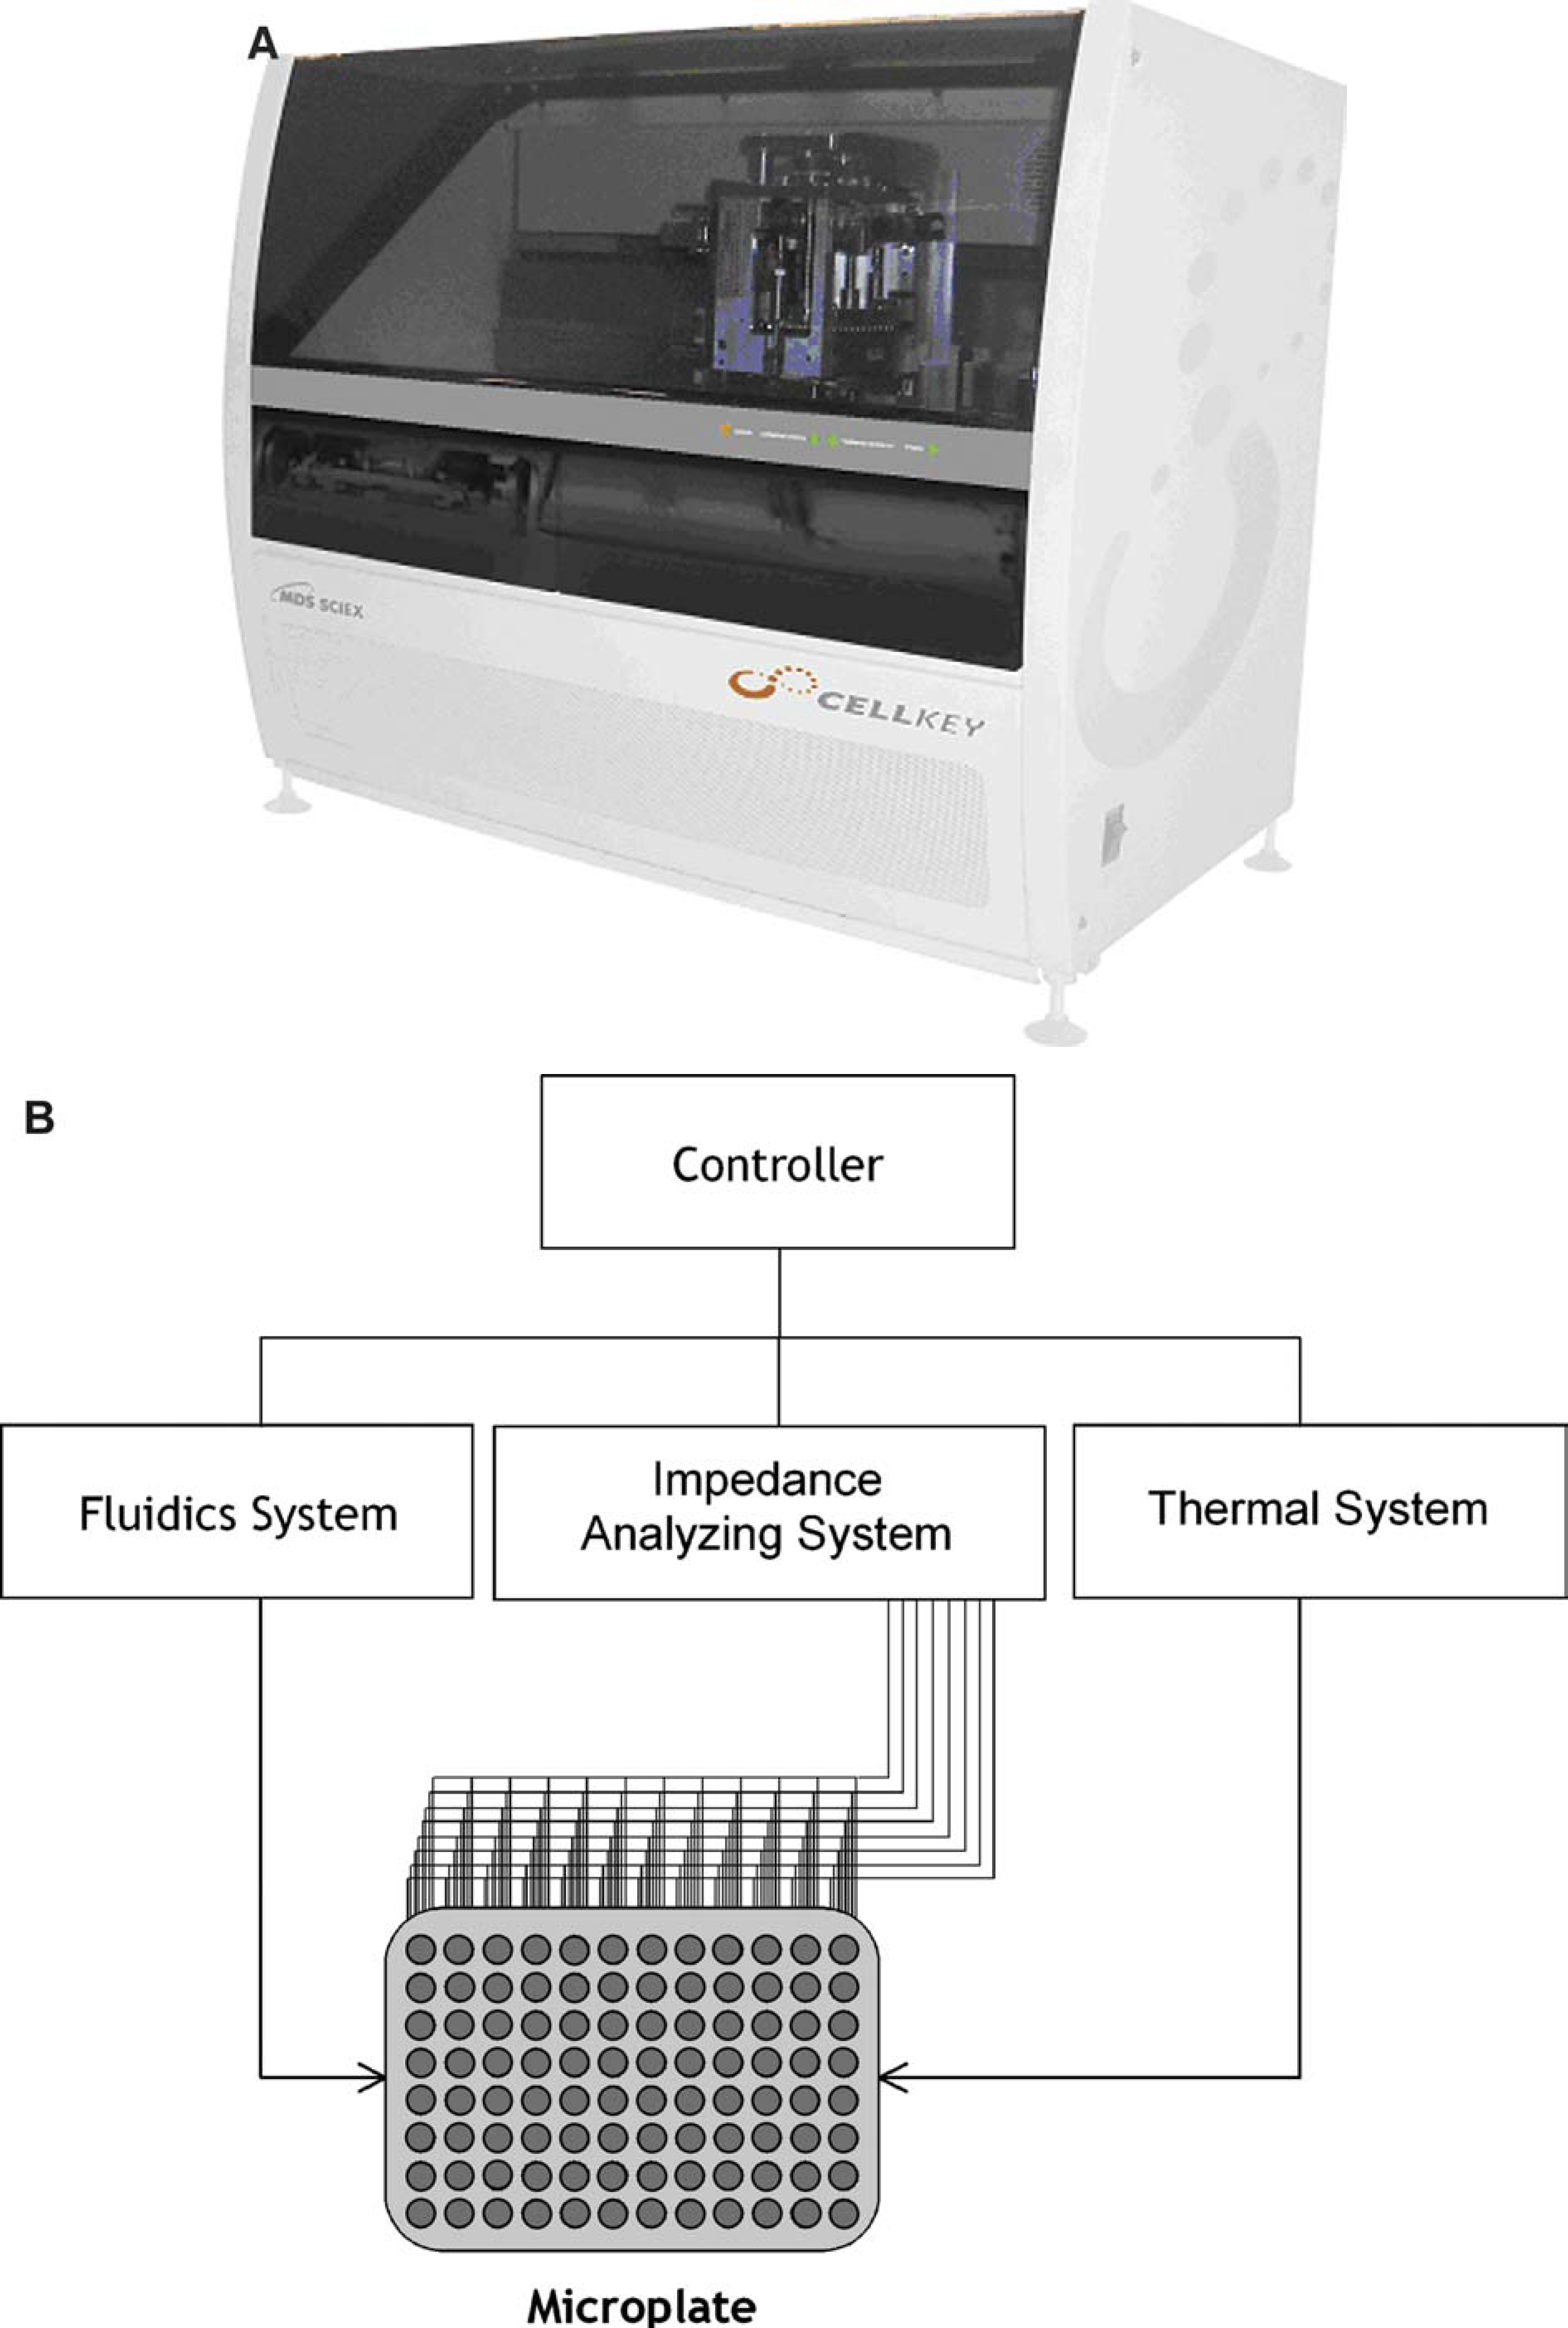
Overview of cellular dielectric spectroscopy (CDS). (A) Picture of CellKey™ system. Data in this study were generated on breadboard version of instrument (picture not shown). (B) Component diagram pertaining to both the CellKey™ system and breadboard versions. Each well of a 96-well microplate contains custom electrodes that are connected to an impedance-analyzing device. The system contains a 96-well fluidics delivery device and a thermal system for temperature regulation. All aspects of assay set up, execution, and data acquisition and analysis are controlled by custom applications software. (C) Diagram of a single well of the custom 96-well CDS plate. The CDS instrument supplies constant voltage to cells plated on the electrode producing current flow around and between cells (extracellular current, Iec) and through cells (transcellular current, Itc). (D) Graph illustrating the response when a stimulus such as a receptor ligand is applied. The maroon trace is the impedance change due to changes in extracellular current (ΔZIec), and the blue trace is the impedance change due to changes in transcellular current (ΔZItc). Measurements taken prior to ligand addition (indicated by the arrow) are used as a baseline to quantitate the CDS response.
CDS measures changes in impedance (ΔZ) that occur upon stimulation of different cell surface and nuclear receptors. Impedance is defined by the ratio of voltage to current as described by Ohm's law (Z = V/I). In order to measure receptor-mediated impedance changes, mammalian cells are seeded onto a custom 96-well microplate containing electrodes at the bottom of the wells. The CDS-based instrument supplies constant voltage, which produces a current that flows around and between cells (extracellular current or Iec) and through cells (transcellular current or Itc) (Fig. 1C). Contributors to the impedance measurements are (1) changes in cell adherence to their substrate, (2) changes in cell shape and volume, and (3) changes in cell-cell interactions. These individually, or together, affect the flow of extracellular and transcellular current, and hence, the magnitude and characteristics of the signal measured. Each of these physiological changes can be linked to receptor-mediated signal transduction that results, for example, in changes in cytoskeletal organization. 30 –32 In addition, non-cytoskeletal-based contributors to the CDS measurement have been identified.
Stimulation of differently coupled GPCRs generates characteristic CDS responses primarily, but not exclusively, due to their differential effects on the actin cytoskeleton, which affect the cellular parameters measured by impedance. 30 –32 For instance, it has been shown that activation of Gq- 33 –35 and Gi-GPCRs 36,37 and some tyrosine kinase receptors (TKRs) 38,39 leads to increased actin polymerization, while stimulation of Gs-GPCRs leads to actin depolymerization. 40 –43 These changes happen within 30 s after receptor activation. 30,31 In addition, direct modulation of intracellular levels of second messengers involved in classical GPCR signaling pathways also induce changes in actin stress fiber formation. Treating cells with agents that elevate the cAMP level caused marked alterations in cell morphology, including a rounded phenotype and a complete loss of actin microfilament bundles 44 –46 while decreasing cAMP results in increased actin stress fibers. 47 Phorbol ester-activated protein kinase C induced the early appearance of a great number of actin stress fibers. 48 As CDS is very sensitive to changes in impedance resulting from both cytoskeletal and noncytoskeletal changes following receptor activation, this platform is uniquely positioned to enable measurement of endogenous receptors in a label-free manner without the need for genetic or chemical modification of the cell or target receptor.
Results and Discussion
Enabling Comprehensive Measurement of Endogenous Receptors
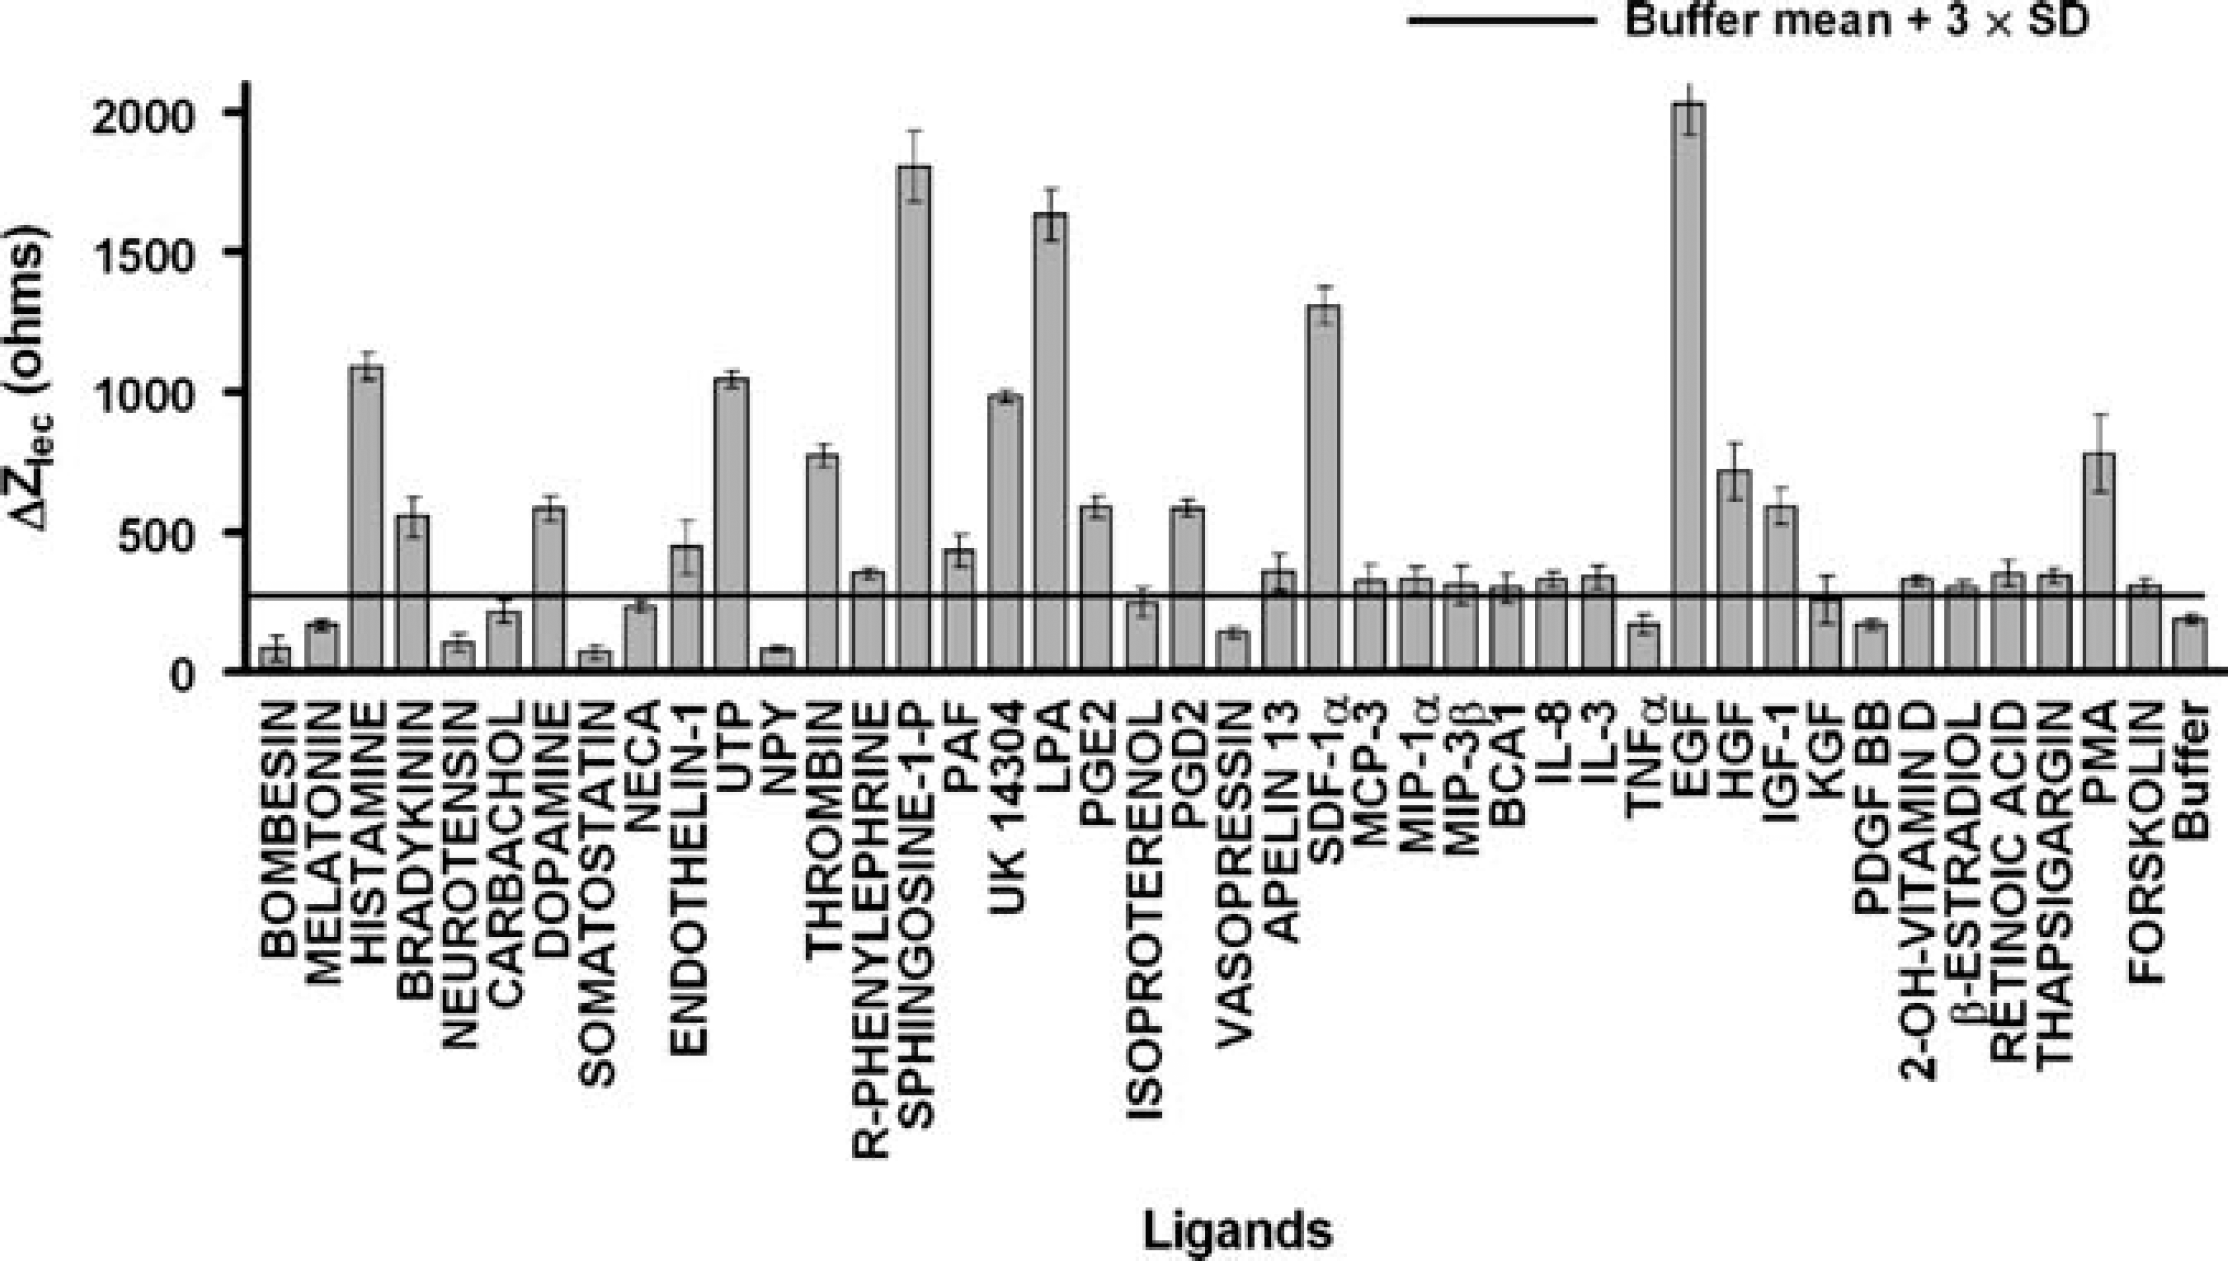
Measured CDS responses to ligands targeting endogenous receptors. HeLa were treated with compounds representing Gq-coupled, Gs-coupled, and Gi-coupled GPCR agonists (e.g., UK14,304, dopamine, histamine, 5HT), growth factors (e.g., EGF, fibroblast growth factor (FGF), IGF), nuclear receptor stimulators (e.g., vitamin D, retinoic acid), and direct modulators (e.g., ionomycin, thapsigargin, PMA, forskolin) at 28 °C. The CDS response for each ligand was calculated based on the maximum response-induced post-ligand addition. A CDS response was considered a hit if the signal was greater than the buffer control mean +3 standard deviations (SD). Data are mean ±SD, n = 3.
CDS has been used to perform a wide range of studies analyzing the effects of many ligands on endogenous and transfected GPCRs in adherent and nonadherent cells of different origins, including the following cell lines commonly used in drug discovery: CHO, HEK 293, U2-0S, COS-7, HeLa, U937, Jurkat, and THP-1 cells. Some of the endogenous receptors analyzed by CDS include the following GPCRs: prostanoid, calcitonin, calcitonin-GRP, adenosine A2B, β-adrenoceptor, histamine H1, histamine H2 serotonin (5HT1B), α2-adrenoceptor, somatostatin, dopamine, opiod, bradykinin, P2Y, endothelin, muscarinic m3, α1-AR, bombesin, CXCR2, and CXCR4. In addition to GPCR activation, CDS can measure activation of endogenous TKRs (EGF, IGF, FGF, HGF, vascular endothelial growth factor (VEGF) and nuclear receptors (vitamin D, estrogen, progesterone, androgen, retinoic acid, and glucocorticoid).
The ability of the CDS technology to functionally measure activity of endogenous receptors in a wide variety of cell types enables more physiologically relevant selectivity and specificity screens with the goal of providing more successful drug discovery efforts.
Proprietary data analysis methods generate response profiles from CDS measurements that are characteristic of the downstream signaling initiated by the receptor that is activated. For instance, stimulation of differently coupled GPCRs in CHO cells leads to unique kinetic response profiles for each type of receptor shown in Figure 3. Side-by-side comparisons of the kinetic plots of transcellular impedance (ZItc) and extracellular impedance (ZIec) for groups of receptors illustrate how stimulation of similarly coupled GPCRs generates similar response profiles that are distinguishable from differently coupled GPCRs (Fig. 3).
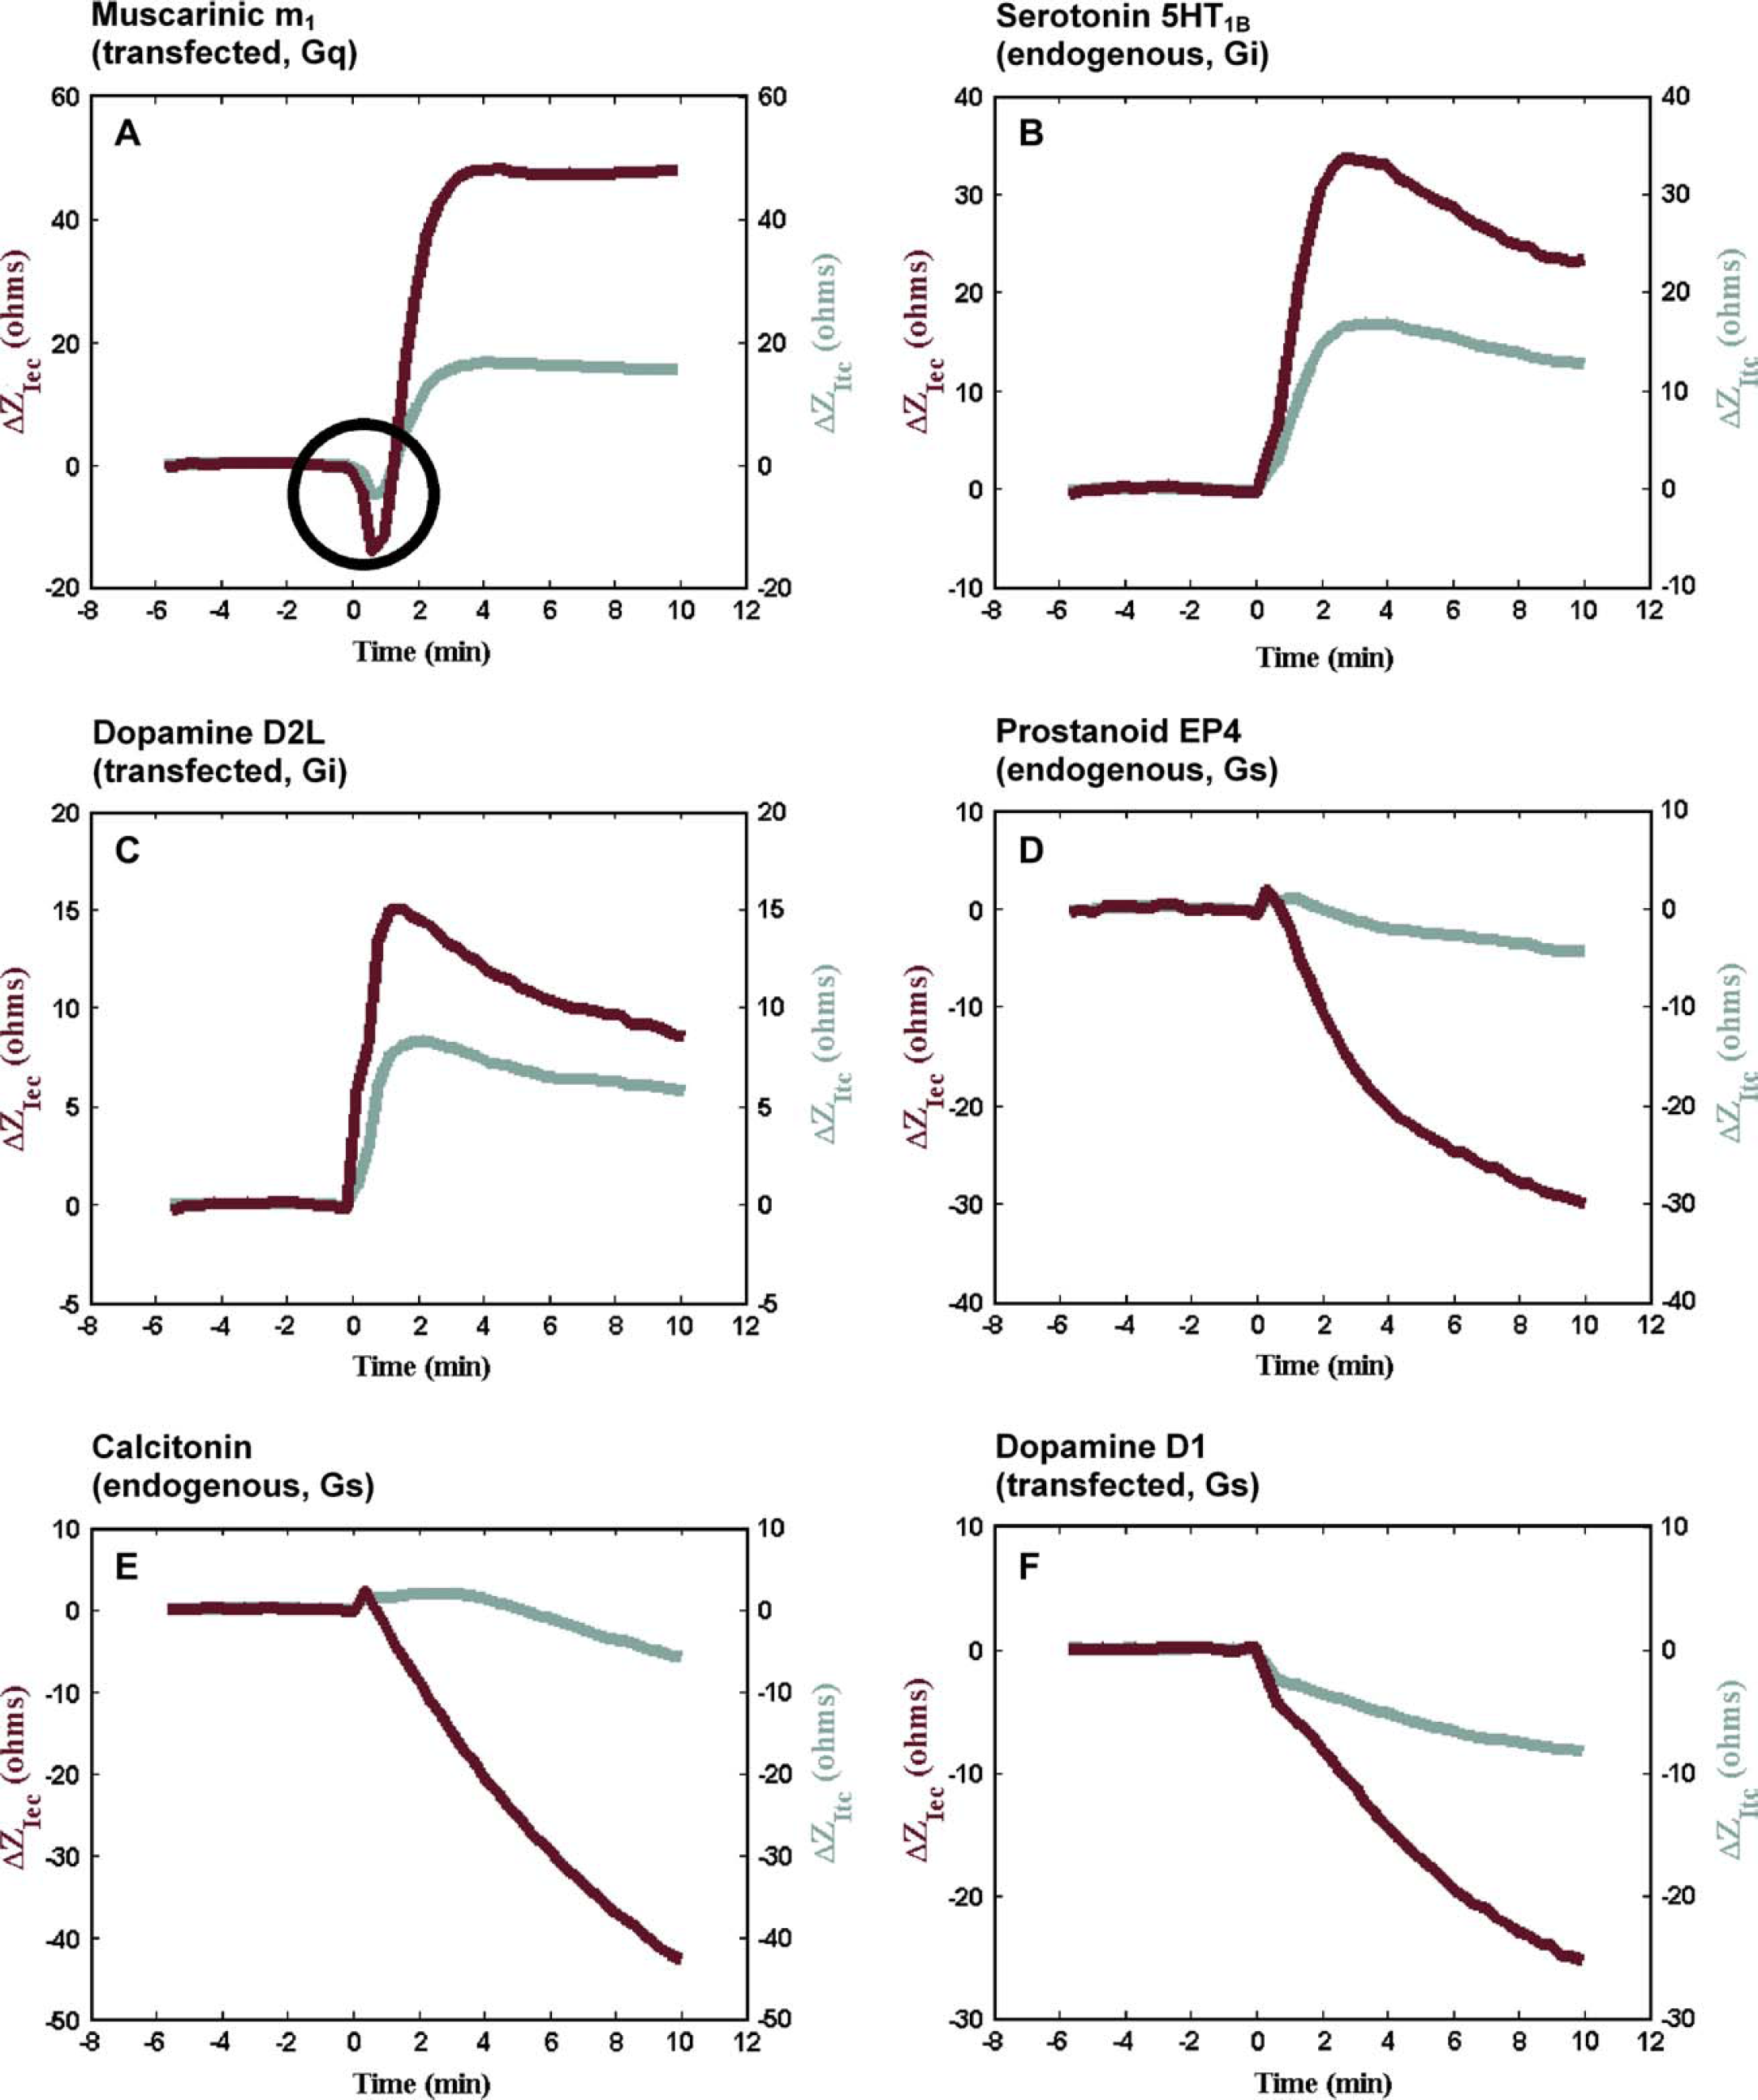
CDS response profiles in CHO cells. Stimulation of differently coupled GPCRs leads to unique kinetic response profiles for each type of receptor, such as the ones shown for the responses in a CHO cell background. Cells were treated with (A) carbachol to activate the transfected muscarinic m1 receptor (CHOm1), (B) 5HT to activate the endogenous serotonergic 5HT1B receptor (CHOm1), (C) dopamine to activate the transfected dopamine D2L receptor (CHO-D2L), (D) PGE2 to activate the endogenous prostanoid EP4 receptor (CHOm1), (E) calcitonin to activate the endogenous calcitonin receptor (CHOm1), and (F) dopamine to activate the transfected dopamine D1 receptor (CHO-D1) at 28 °C. The initial drop in impedance that distinguishes the Gq-coupled muscarinic m1 response from the Gi-coupled 5HT1B, and dopamine D2L response is circled.
An early, small, and fast decrease in transcellular impedance followed by a later increase in transcellular and extracellular impedance is typical of activation of Gq-protein coupled receptors (Gq-GPCRs) such as the muscarinic m1 receptor transfected in CHOm1 cells (Fig. 3A).
Transcellular and extracellular impedance increase following the activation of Gi-protein coupled receptors (Gi-GPCRs) such as the endogenous serotonergic 5HT1B and transfected dopaminergic D2L receptors (Fig. 3B,C).
Transcellular and extracellular impedance decrease following activation of Gs-protein coupled receptors (Gs-GPCRs) such as the endogenous prostanoid EP4 and calcitonin receptors, and the transfected dopaminergic D1 receptor (Fig. 3D-F).
Dissection of the receptor responses with biochemical modulators revealed that the initial transient decrease in transcellular impedance for the muscarinic m1 receptor and other Gq-coupled GPCR responses is linked to noncytoskeletal effects induced by intracellular calcium. The later and larger changes in both transcellular and extracellular impedance induced upon receptor activation are primarily due to changes in actin cytoskeleton rearrangement via activation of PKC for Gq-GPCRs and increasing and decreasing intracellular cAMP for Gs- and Gi-GPCRs, respectively (manuscript in preparation).
Single-time snapshots of a response can be displayed in two dimensions with each point representing the characteristic CDS response, as shown in Figure 4. The contribution of both extracellular impedance (ZIec) and transcellular impedance (ZItc) for a CDS response at a given time point can be plotted on a dot plot. The distance from the origin indicates the magnitude of the response that is both efficacy-and potency-dependent. The angle from the origin is indicative of the relative ratio of ZIec and ZItc that forms the response profile. This type of graph allows representation of multiple receptor responses on a single dot plot for comparison purposes.
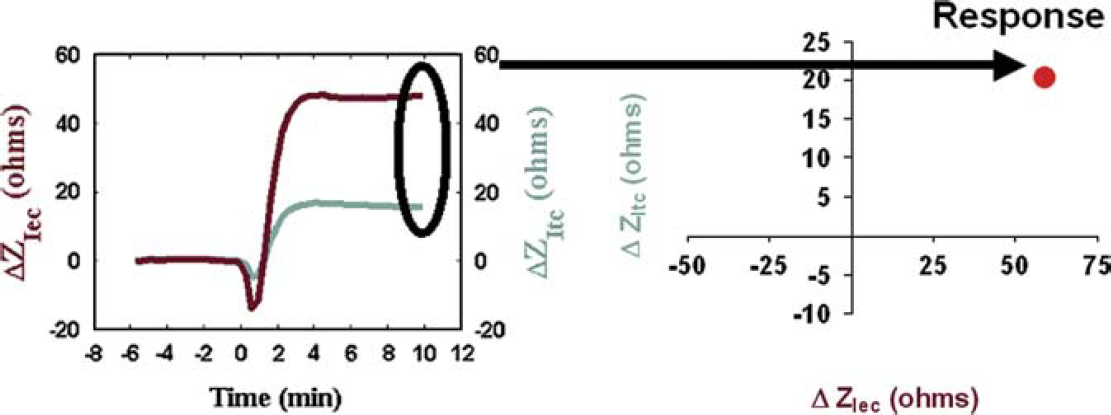
Two dimensional dot plots. The contribution of ZIec is plotted on the x-axis, and ZItc is plotted on the y-axis for the CDS response at a given time point. In this example, the response measured 10 min post-ligand addition is indicated by the arrow.
Figure 5A,B shows responses for replicates of three differently coupled receptors measured at early (30 s) and late (2.5 min) time points, respectively, after ligand addition in the context of CHOm1 cells. At the early time point, the Gq-coupled muscarinic m1 response is visible in the lower left hand quadrant of the dot plot, indicating the decrease in CDS signal (Fig. 5A). As time progresses, the Gq-GPCR response moves to the upper right-hand quadrant, along with the Gi-GPCR response, indicating an increase in CDS signal (Fig. 5B). In contrast, the Gs-GPCR mediated response (prostanoid EP4) decreases over time and stays in the lower left-hand quadrant (Fig. 5A, B). Consequently, analysis of the CDS response profiles at a later time point after receptor stimulation distinguishes the Gs-GPCR response from the Gi- and Gq-coupled responses, while the Gi- and Gq-coupled responses are primarily distinguished by their differential response at an early time point.
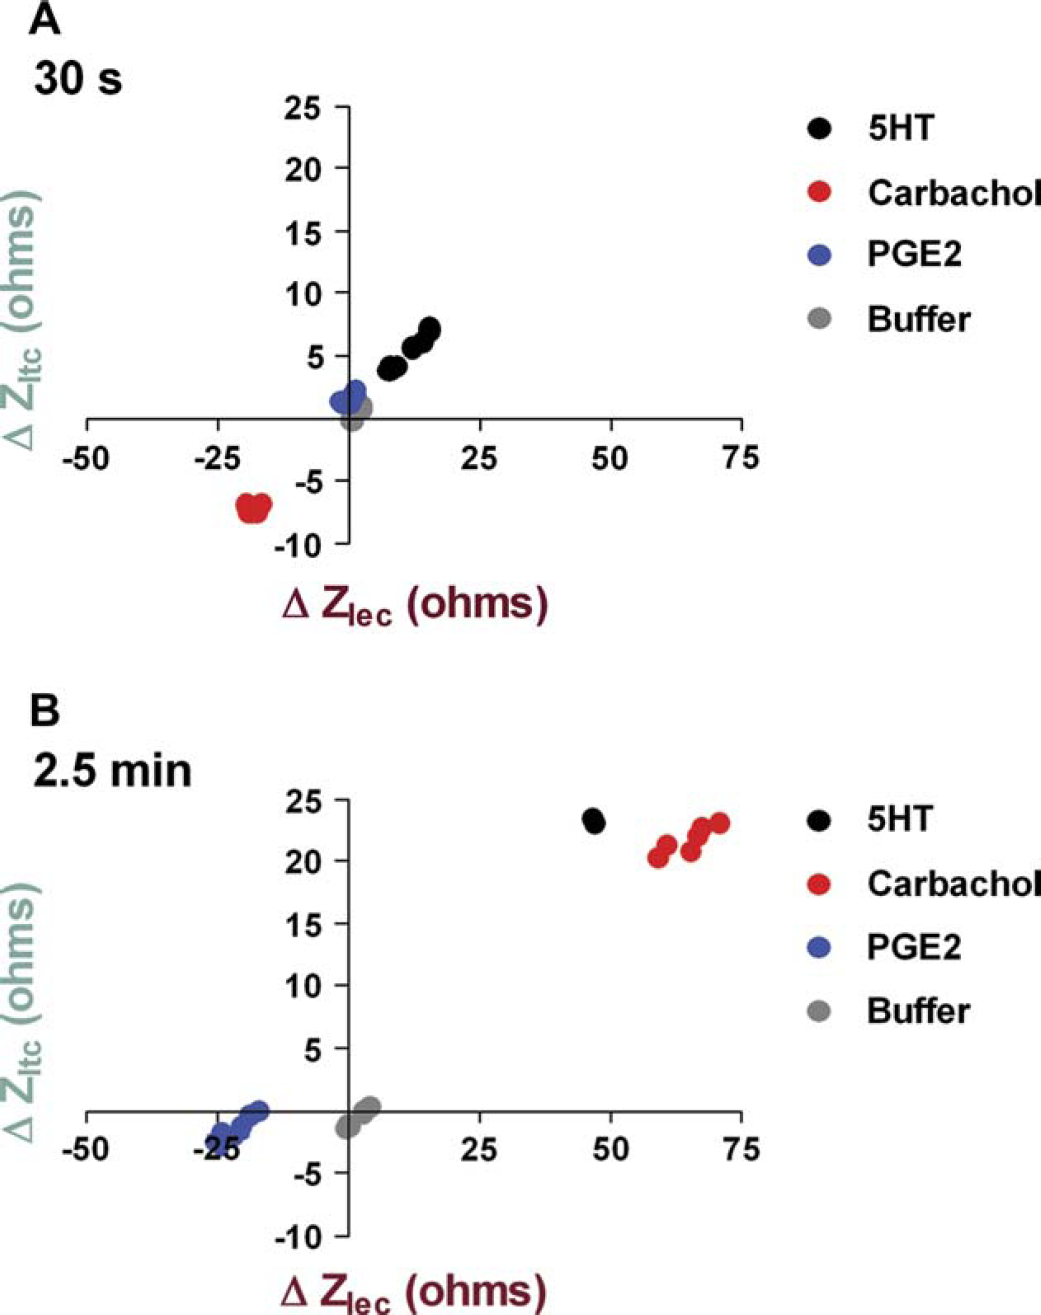
CDS responses plotted in dot-plot format based on the contribution of components ZIec and ZItc after stimulation of CHOm1 cells with ligands. The points on this plot represent the changes in ZIec and ZItc induced by each ligand at (A) 30 s and (B) 2.5 min post-ligand addition. Gray dots indicate negative controls that clustered near the origin and responses to the other compounds plotted in different regions of the graph distinct from the origin, with their distances corresponding to response potency. Black, red, and blue circles indicate the CDS responses to 5HT, carbachol, and PGE2, respectively; n = 8 replicates for each ligand.
These data suggest that comparing the CDS response profile, or dot plot localization of a receptor with unknown G-protein coupling, to the CDS responses of receptors with known G-protein coupling in a specific cell type will allow identification of the signaling pathway of the unknown GPCR.
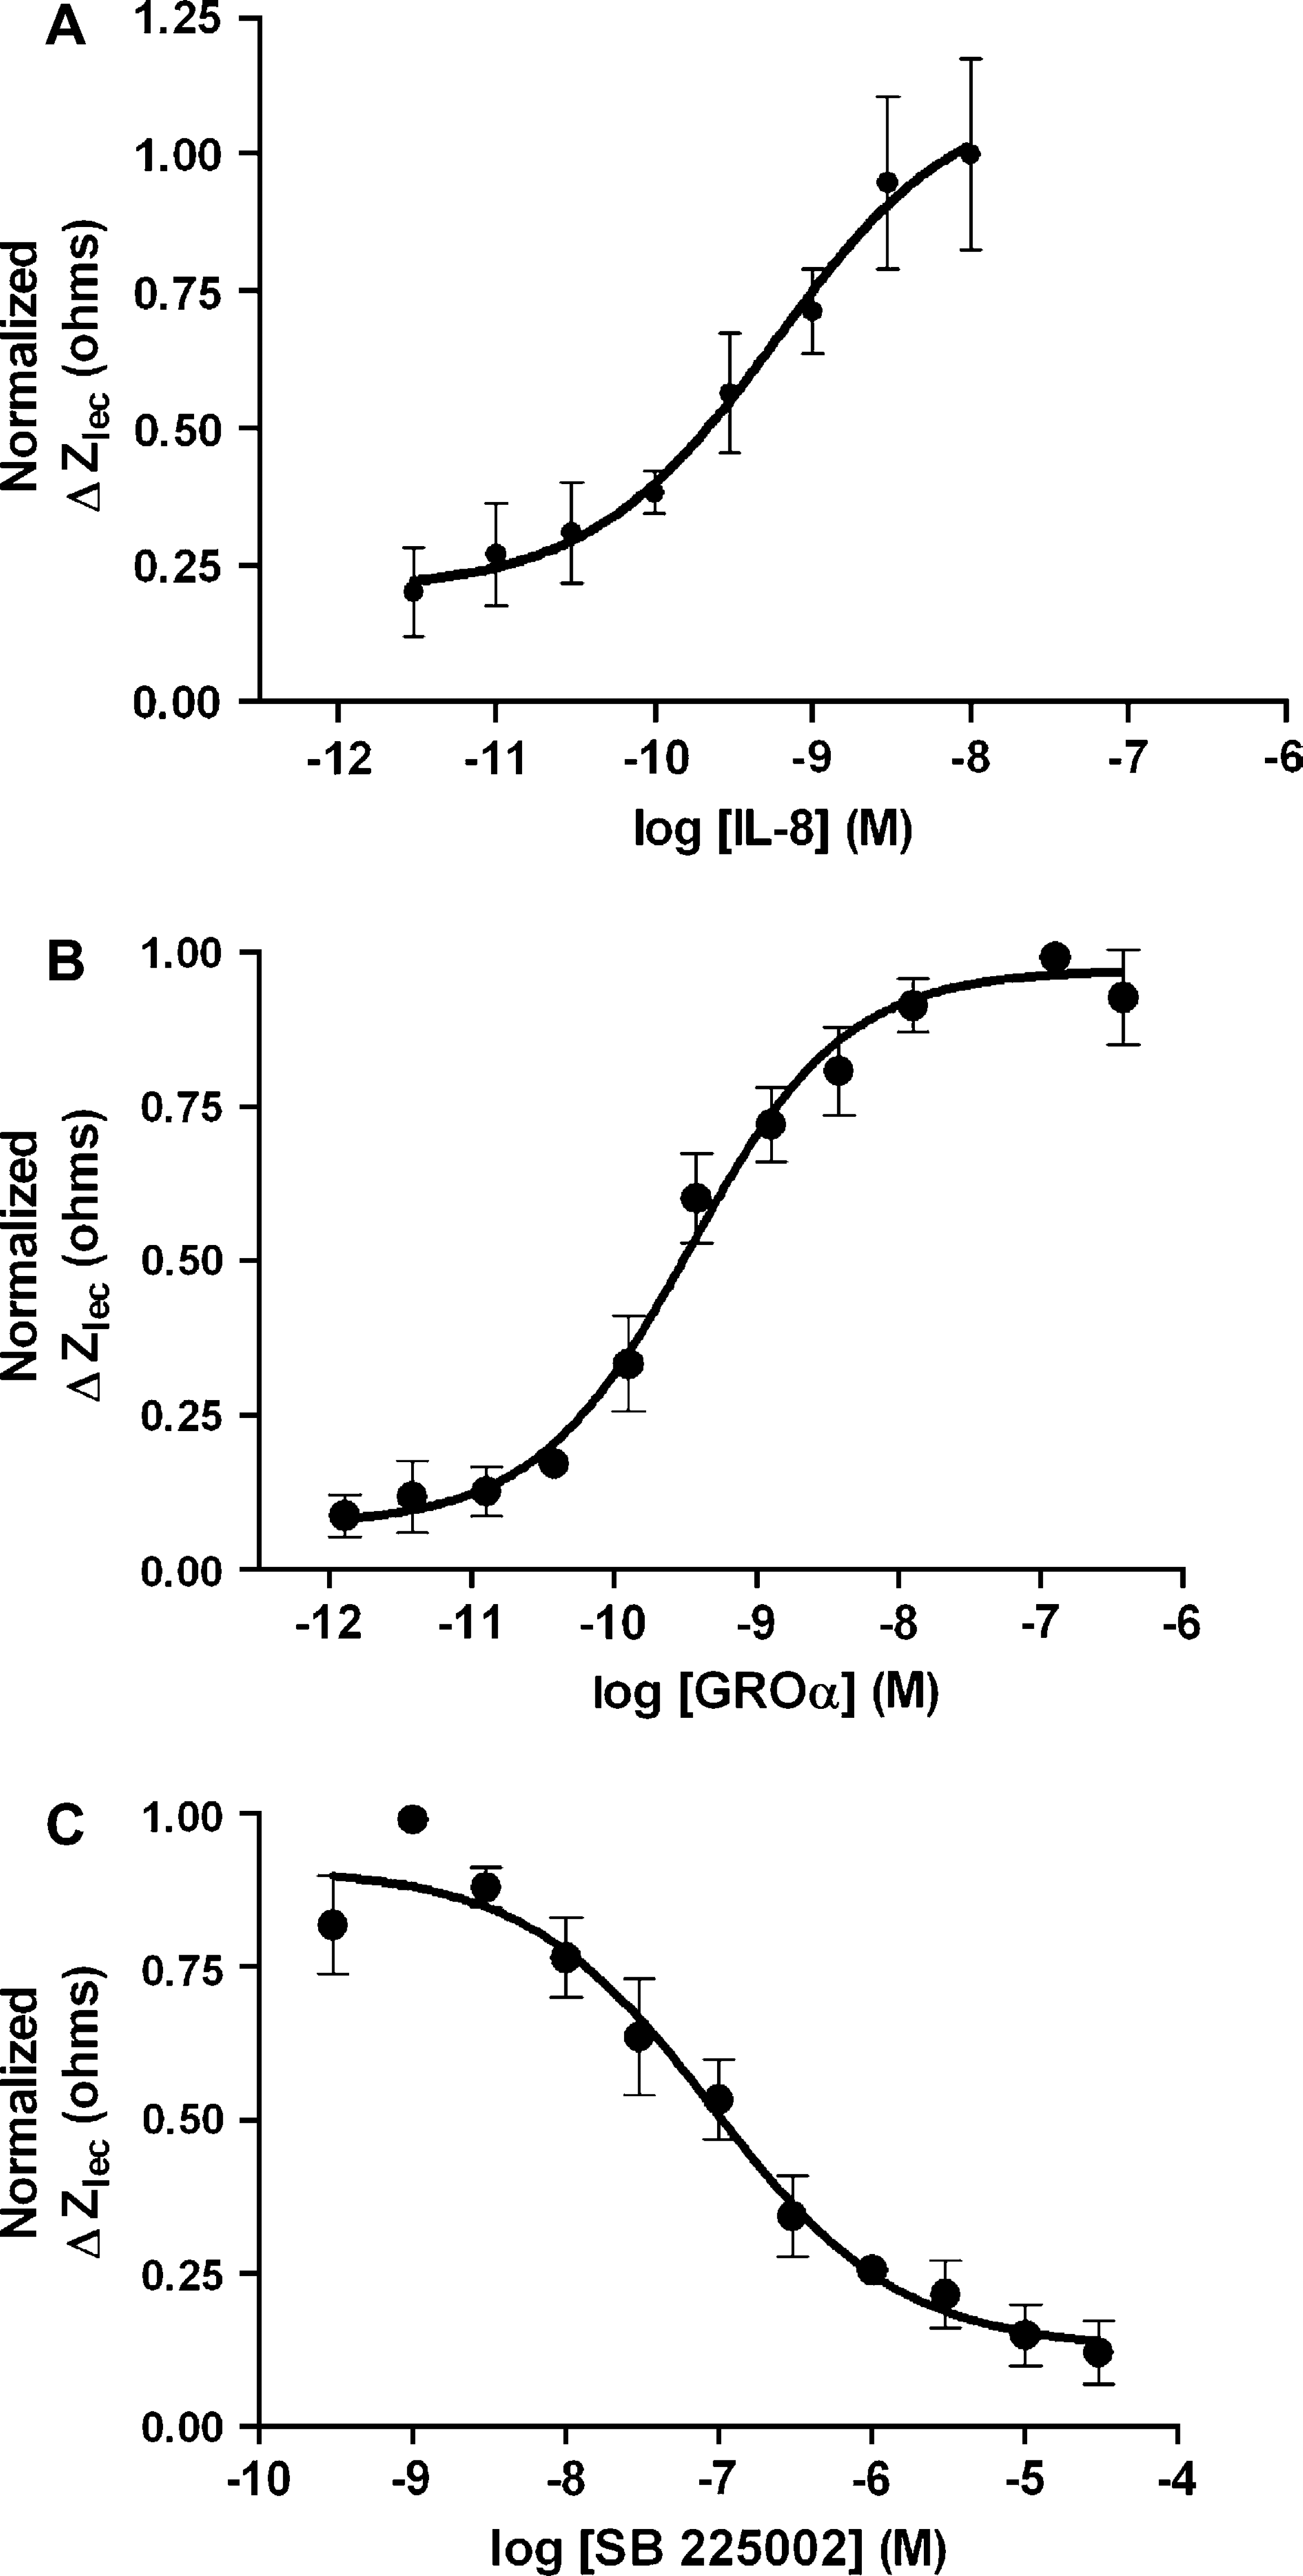
Cellular responses to activation of chemokine receptors as measured by CDS. (A) Concentration response curve for IL-8, a CXCR agonist, on primary human neutrophils. The CDS-derived EC50 for IL-8 was 6.2 × 10⁻¹⁰ M. CDS data were buffer-subtracted and normalized to 10 nM IL-8. Each data point represents mean ±SD, n = 4. Experiments were performed at 28 °C. (B) Concentration response curve for GROα, a CXCR2-selective agonist on differentiated U937 cells. The CDS derived EC50 value for GROα was 1.2 × 10⁻⁹ M. CDS data were normalized to 4 nM GROα. Each data point represents mean ±SD, n = 3. Experiments were performed at 28 °C. (C) Concentration response curve for SB 225002, an antagonist to the CXCR-2 receptor. Differentiated U-937 cells were preincubated with SB 225002 for 30 min at 28 °C before stimulating with 4 nM GROα. The CDS derived IC50 for SB 225002 was 9.2 × 10⁻⁸ M. CDS responses were normalized to 4 nM GROα. Each data point represents mean ±SD, n 3.
Activation of the endogenous CXCR2 receptors in U937 cells, 53 which is typically measured with chemotaxis assays and not detectable using second messenger assays, is easily and quickly detected with CDS. DMSO-differentiated U937 cells yield a robust concentration-dependent response measured by CDS upon addition of GROα, a CXCR2-selective ligand 54 (Fig. 6B). The response to GROα is inhibited in cells preincubated with SB 225002, a selective antagonist for the CXCR2 receptor, 55 demonstrating that the CDS measurement is receptor-specific (Fig. 6C). The CDS response is robust and sensitive as cells treated with an EC80 dose (4 nM) of GROα yielded a response with an interplate % of coefficient of variation (%CV) of 6.7% and a Z'-score of 0.71 (n = 30 wells across 3 plates.)
Pharmacological Profiling of Agonists and Antagonists
The data presented thus far demonstrate that CDS is a powerful tool for detecting and characterizing activation of endogenous receptors. While the unique nature of the CDS information enables novel applications, it is the universality and ease of use of the platform that provides a powerful tool for generating pharmacologically relevant data with little assay development required.
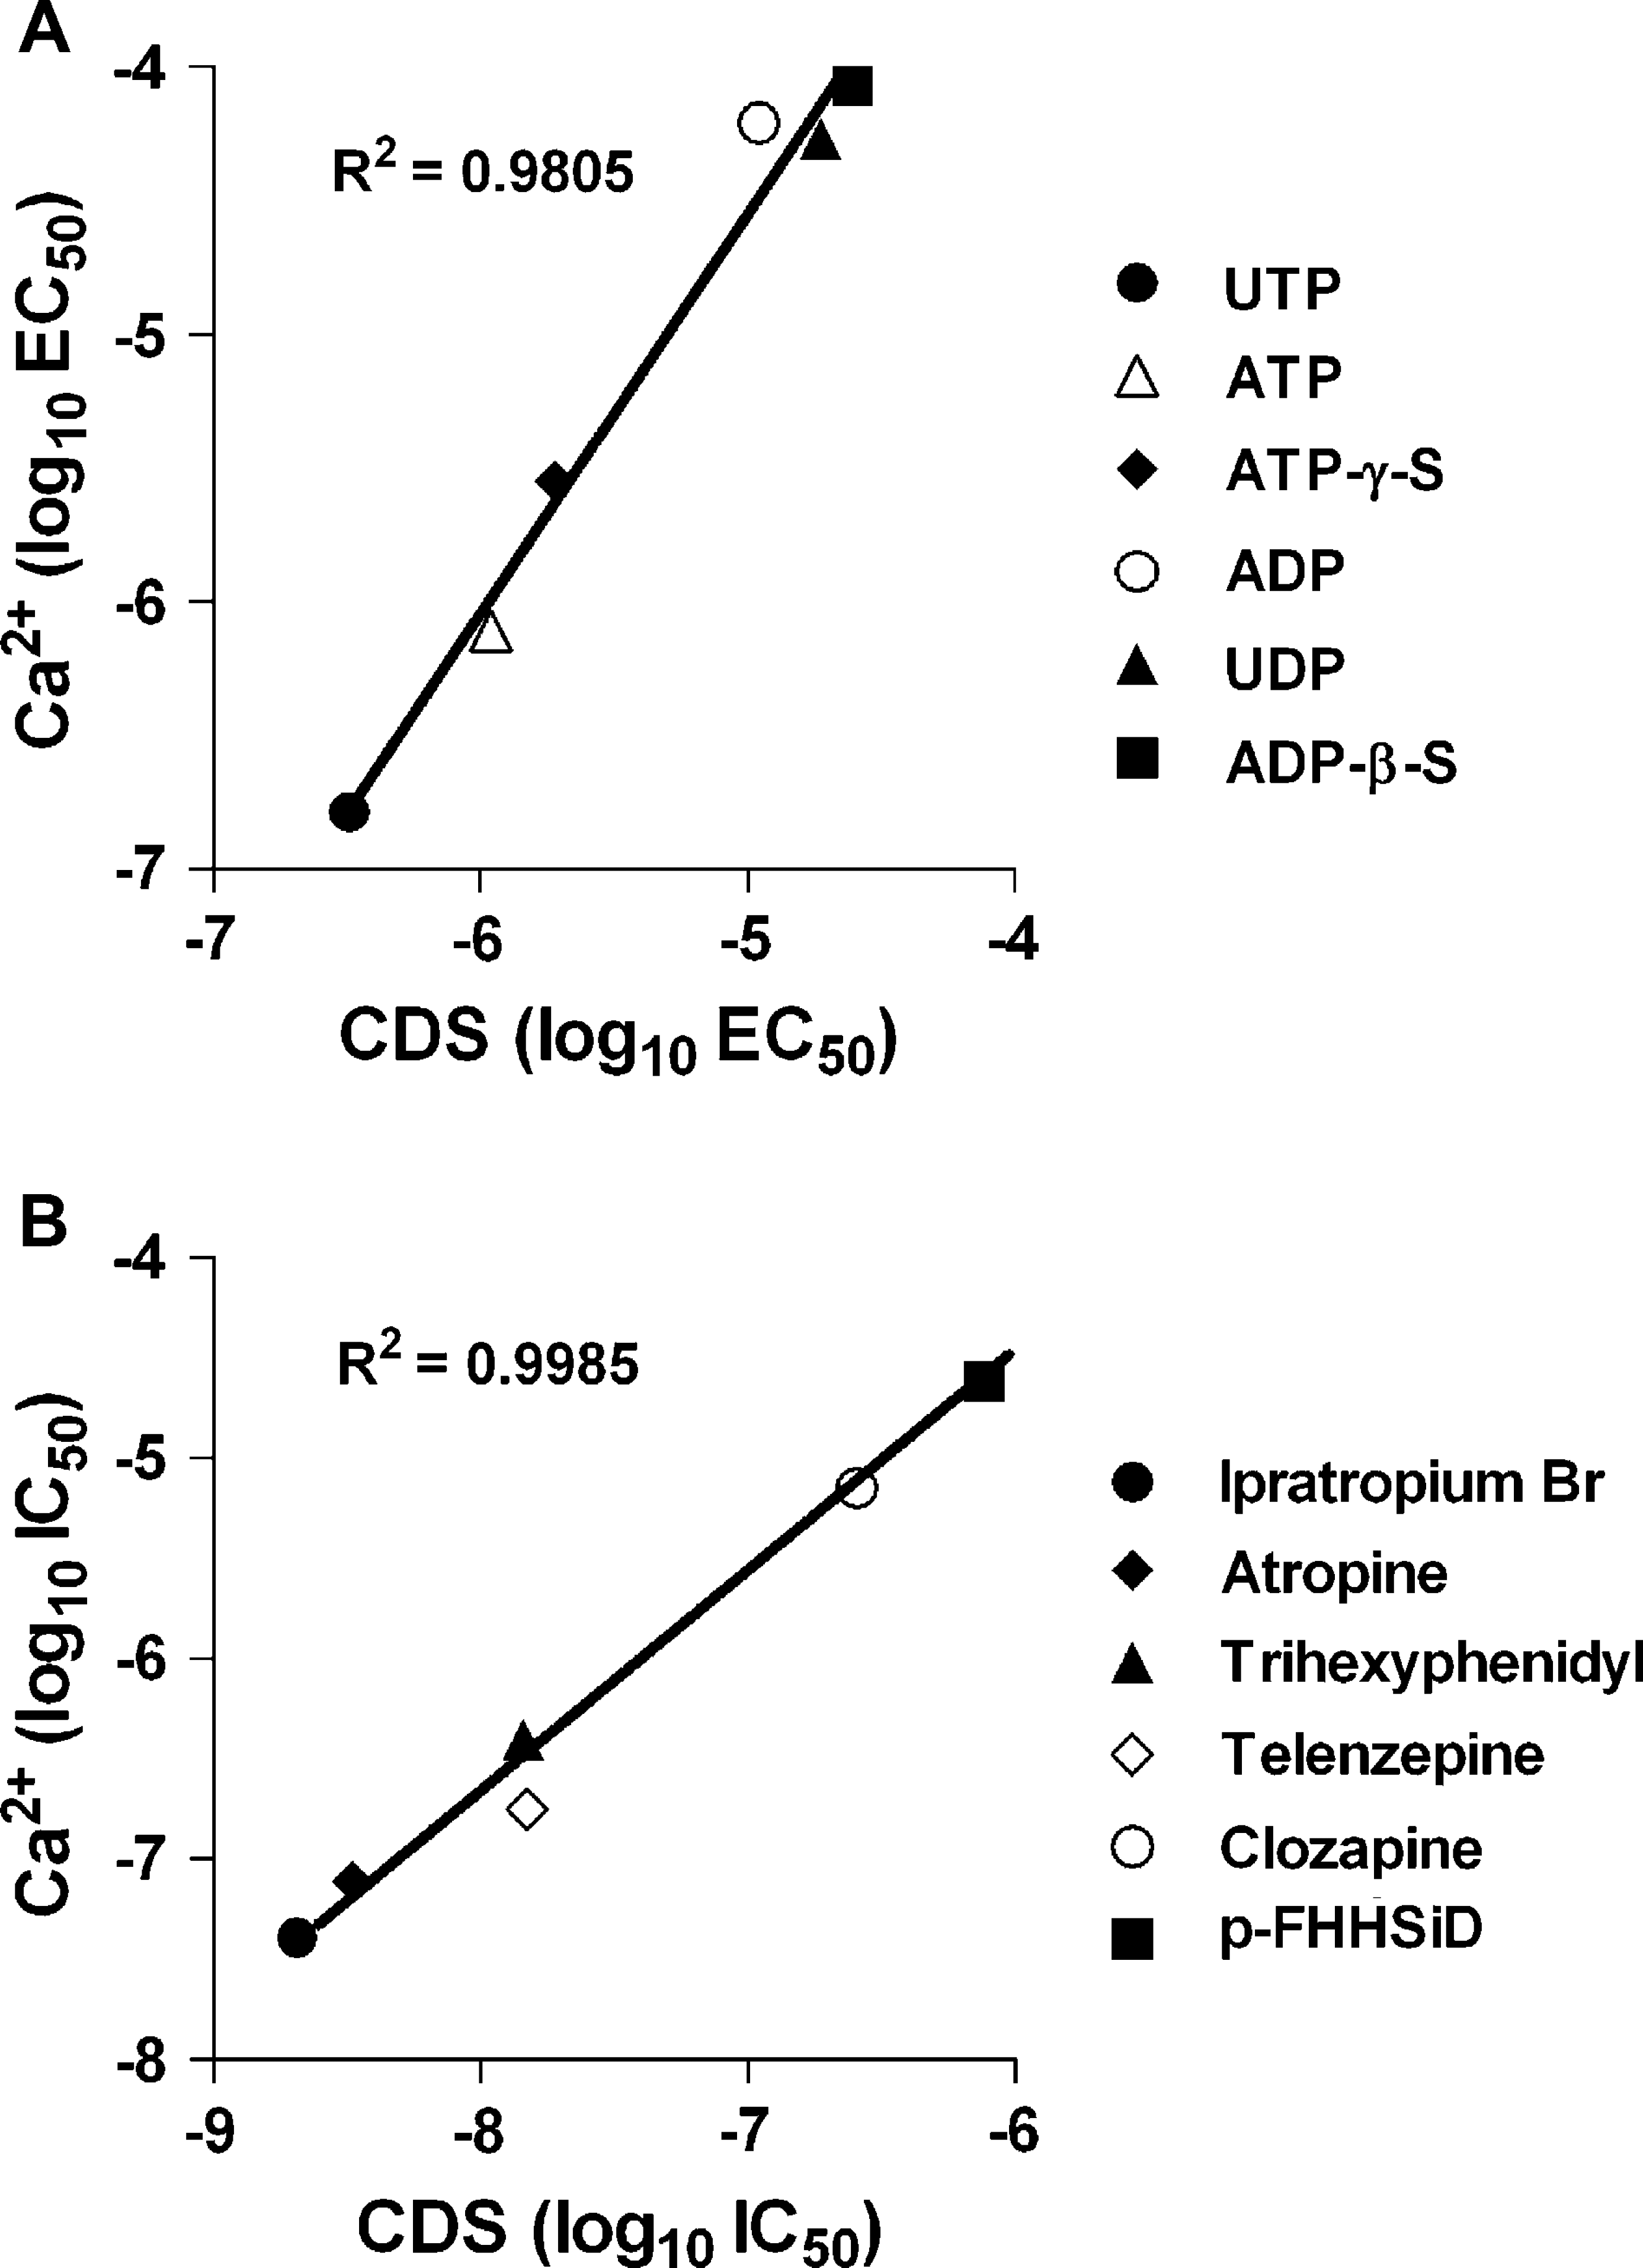
Comparison of EC50 and IC50 values derived from CDS and calcium assays. Concentration response curves were produced for a series of (A) agonists targeting the endogenous purinergic receptor in U-937 cells at 28 °C, and (B) antagonists targeting the transfected muscarinic mi receptor in CHOm1 cells. Cells were pretreated with antagonists for 20 min at 28 °C prior to stimulation with 10 μM carbachol. These ligands were assessed using both CDS platform and Ca2+ (fluo-4, AM) fluorescence on the Molecular Devices Analyst. The two assays demonstrate comparable potency rankings with good correlation.
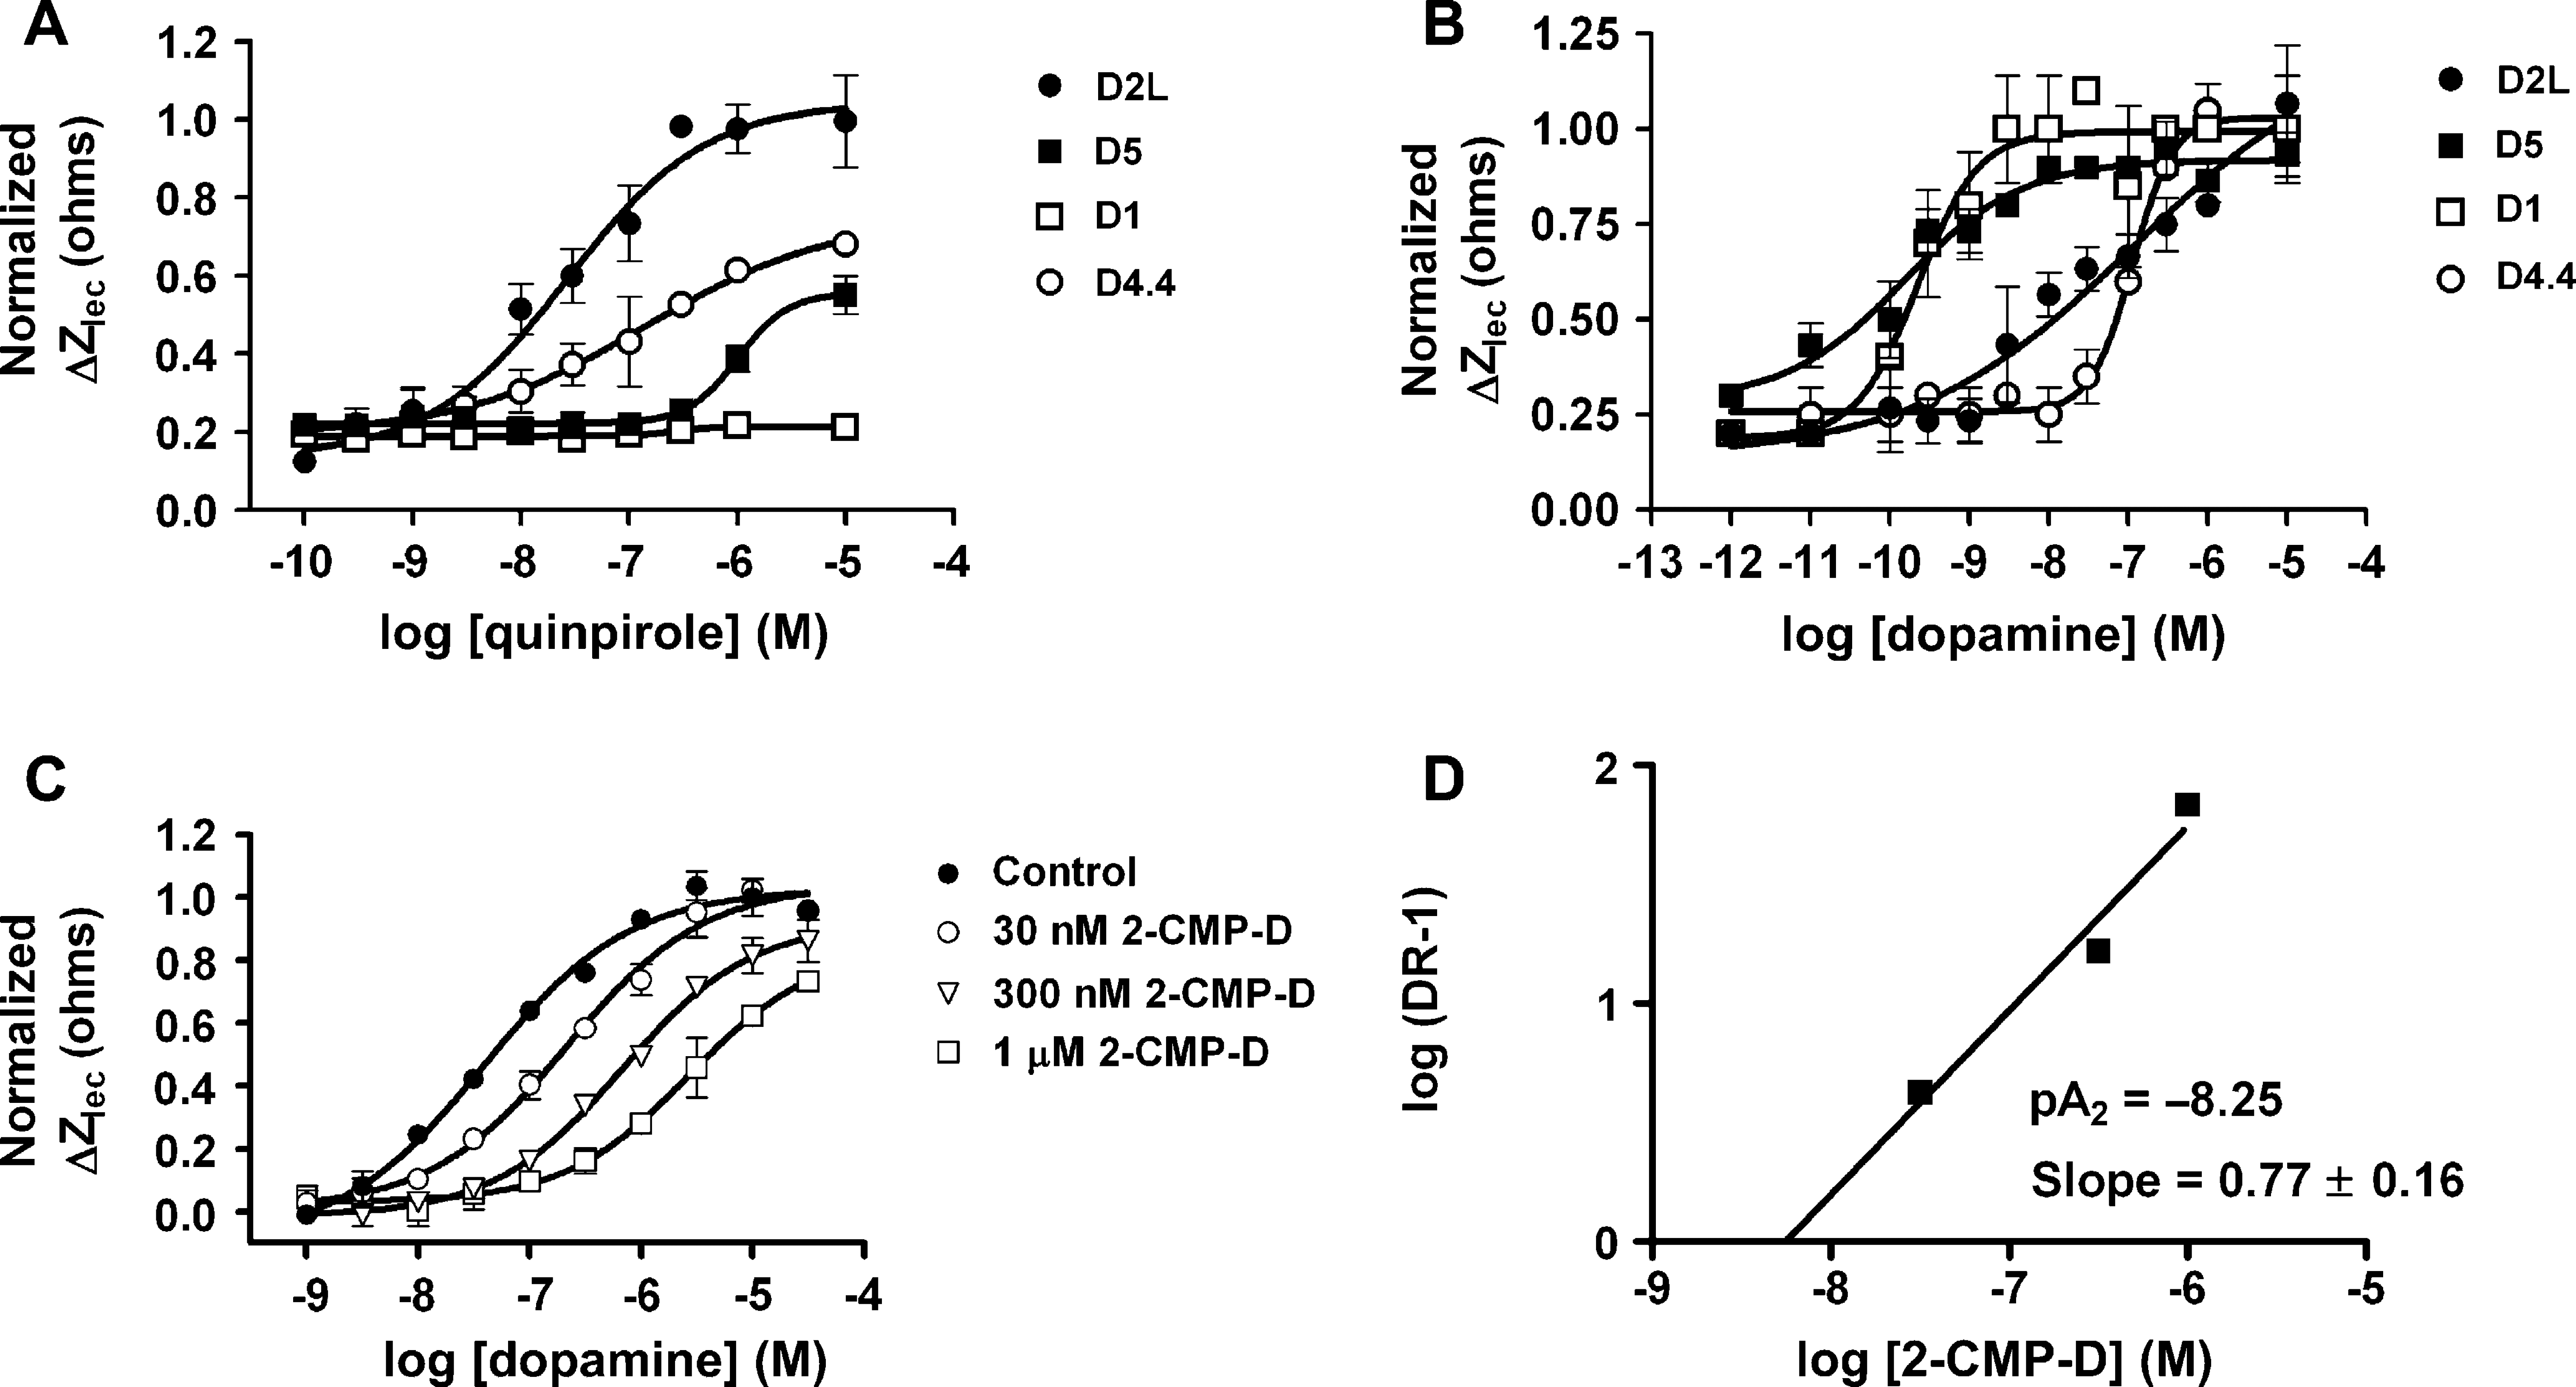
Concentration response curves of ligands tested across four cell lines at 37 °C. CHO cells expressing the D1 (Gs), D2L (Gi), D4.4 (Gi), or D5 (Gs) receptors were treated with (A) varying concentrations of quinpirole, a D2L selective agonist, and (B) dopamine, a nonselective agonist. CDS responses were normalized to 10 μM quinpirole or 10 μM dopamine on the D2L cells. Data represent mean ±SD, n = 3. (C) Schild analysis with dopamine agonist and 2-chloro-l 1-(4-methylpiperazino)dibenz[b,f]oxepin (2-CMP-D) antagonist on CHO-D1 (Gs) cells. Cells were pretreated with different concentrations of antagonist at 37 °C for 20 min prior to stimulation with varying concentrations of dopamine. As concentration of antagonist was increased, a rightward shift in the EC50 of the agonist was observed. CDS responses were normalized to 10 μM dopamine. Data represent mean ±SD, n = 3. (D) From the relationship between the shifted EC50 values and the concentration of antagonist, the pA2 value was determined to be −8.25.
Materials and Methods
Cell Lines
Transfected CHO cells expressing various dopamine receptor subtypes 56 were kindly provided by MDS Pharma Services. Cell lines CHOm1 (M1WT3; CRL-1985), HeLa (CCL-2), and U937 (CRL-1593.2) 53 were obtained from ATCC (Manassas, VA). Primary neutrophils were purchased from AllCells, LLC (Berkeley, CA). HeLa cells were grown in minimal essential medium (MEM); U937 cells were grown in RPMI-1640; CHOm1 cells were grown in Ham's F12K; CHO cells expressing transfected dopamine receptor subtypes were grown in Ham's F12. All media were supplemented with 10% fetal bovine serum (FBS), 50 μg/mL streptomycin, and 50 units/mL penicillin. CHO cells expressing transfected receptors (CHO-D1, D2L, D4.4, D5 and CHOm1) were maintained under drug selection with 100 μg/mL G418. U937 cells were differentiated by exposure to culture media containing 1.5% DMSO for 96 h.
Reagents
The following were purchased from Sigma (St. Louis, MO): bovine serum albumin (BSA), endothelin-1 (ET-1), isoproterenol, stromal cell-derived factor 1 alpha (SDF-1), epidermal growth factor (EGF), insulin-like growth factor (IGF), 5-hydroxytryptamine (5HT), calcitonin, forskolin, uridine triphosphate (UTP), uridine diphosphate (UDP), adenosine diphosphate (ADP), adenosine triphosphate (ATP), ATP-γ-S, prostaglandin E2 (PGE2), bradykinin, UK 14,304, carbachol, atropine, ipratropium Br, trihexyphenidyl, telenzepine, clozapine, p-fluoro-hexahydro-sila-difenidol (p-FHHSiD), histamine, thapsigargin, bombesin, melatonin, β-estradiol, NECA, neuropeptide Y, thrombin, B-cell attracting chemokine 1 (BCA-1), r-phenylephrine, sphingosine-1-phosphate, platelet activating factor (PAF), MIP-1α, 1-oleoyl-LPA, MIP-3β, retinoic acid, vasopressin, apelin 13, and platelet derived growth factor BB (PDGF BB). Somatostatin, ADP-β-S,3 Li and SB 225002 were purchased from Calbiochem (San Diego, CA); and GROα, IL-8, IL-3, MCP-3, hepatocyte growth factor (HGF), keratinocyte growth factor (KGF), and tumor necrosis factor α (TNF-α) were purchased from R&D Systems (Minneapolis, MN). A76636, quinpirole, and 2-Chloro-11-(4-methylpiperazino)dibenz[b,f]oxepin were obtained from Biomol (Plymouth Meeting, PA).
Hanks balanced salt solution and HEPES buffer solution were purchased from Invitrogen (Grand Island, NY). FBS was purchased from Invitrogen (Grand Island, NY) and Gemini Bio-Products (Woodland, CA). Ham's F12, Ham's F12K, MEM, RPMI-1640, penicillin, streptomycin, and G418 were purchased from Cellgro (Herndon, VA).
Instrument Design
The data in this study were generated on an engineering breadboard version of the CellKey™ system. The principal component of the CDS breadboard system used for these studies included a custom 96-well integrated with a measurement system connected to Agilent (Palo Alto, CA) impedance analyzers. Constant voltage over a range of 30 frequencies, from 1 kHz to 110 MHz, was applied to a monolayer of cells, and the resultant current was measured at an update rate of 20 s. The system was thermally regulated and experiments were run between ambient and 37°C. Onboard fluid additions and exchanges were handled by a 96-head fluid delivery device with a range of 5–200 μL. In addition to the cell plate location, the instrument included two additional stations for 96-well compound plates. All aspects of assay set up, execution, and data acquisition and analysis were controlled by custom applications software.
General Cell Protocols
Adherent cells were plated into the wells of CDS micro-plates in standard tissue culture media containing serum, and the plates were incubated overnight under standard conditions (37°C, 95% humidity, 5% CO2). During the overnight incubation, the cells adhered to, and formed a monolayer over, the electrodes at the bottom of the custom 96-well microplate, thus becoming part of an electric circuit. Typically, 3.5–4.5 × 10⁴ cells/well were used to form the monolayer, depending on the cell type. After the plating period, the plates were placed on the instrument, and the cell monolayers were washed two times with Hanks balanced salt solution containing 20 mM HEPES and 0.1% BSA (HH). Cells were then allowed to equilibrate at the assay temperature for 15 min. At the end of this period, readings were taken every 20 s for 5 min to establish a baseline. At the end of the baseline period, ligands were added, and the change in the magnitude of the measured impedance (ΔZ) was recorded over time. Typically, 10 min of post-ligand addition data were acquired for any experiment.
For experiments with nonadherent cells, the following protocol was utilized. Cells were harvested from stock tissue culture flasks and washed by centrifugation three times with HH. Typically, 1.0–1.2 × 10⁵ cells were then added to each well and allowed to settle for 30 min at room temperature. This resulted in a single layer of cells on top of the electrodes. Though the nonadherent cell monolayers were not attached to the electrodes, their proximity to the electrodes was sufficient for impedance measurements by CDS. After the cells settled, the plate was placed on the instrument and receptor activation experiments were initiated in the manner described above for adherent cell assays.
Agonist and Antagonist Protocols
At the completion of the wash steps described above, 135 μL of HH were dispensed to the wells of the cell plate. For receptor agonist studies, 15 μL of a 10x concentration of agonist were added to the 135 μL and mixed three times using the onboard fluidics head. For nonadherent cells, the pipetting speed and pipette tip height of the fluidics head were adjusted so as not to disturb the monolayer of settled cells. Readings were taken continuously during the ligand addition procedure and for an additional 10 min post-ligand addition. In the studies reported in this paper, experiments were conducted at either 28°C or 37°C.
Antagonist studies required one more fluid addition, as described here. For adherent cells, the final 135 μL wash volume was removed from the wells and replaced with 135 μl HH containing a 1x concentration of antagonist. Cells were allowed to incubate in the presence of antagonist for various times (see figure legends). At the end of the pretreatment period, 15 μL of a 10x concentration of agonist was added as described in the agonist protocol above.
Calcium Assays
Calcium fluorescence data were generated on the Molecular Devices Analyst using fluo-4, AM. 57
Summary
CDS is a technology that enables comprehensive pharmacological evaluation of cell surface receptors in real time. It is a universal assay that allows measurement of multiple types of receptors, including G protein-coupled receptors (GPCRs), tyrosine kinase receptors (TKRs), and steroid receptors using the same platform, without the need for transfections or special reagents. The CDS-based platform is sensitive enough to consistently monitor ligand-mediated activation of endogenously expressed receptors, and for this reason, has the ability to generate more physiologically relevant data than obtained with genetically and chemically manipulated cells.
The label-free CDS measurement is a measure of cell function as opposed to binding events that are typical of many current label-free approaches: classical (BIAcore's SPR technology) and more recent (Corning's EPIC, SRU Biosystems' BIND, CSEM's WIOS, and Akubio's RAP technology). A detailed comparison of these and other impedance-based measurement systems is available in a recent review of label-free technologies. 58
To illustrate the power of the CDS technology, data has been presented demonstrating the use of this label-free approach in pharmacological evaluation of ligands for a number of receptors in a variety of cell types, including primary cells. Specifically, the CDS technology has been applied to hit confirmation, receptor selectivity analysis, ligand potency, and Schild analysis of receptor-selective antagonists. CDS measurements quantitatively align with results from other cell-based assays in determining the potency and ranking of agonists and antagonists. The robust and reproducible nature of CDS assays is reflected in low coefficients of variation, high signal-to-background, and excellent Z'-scores of the data. The data generated using CDS technology are unique in that the response profiles reflect receptor-mediated signaling pathways and are characteristic of main subsets of GPCRs within a cell line. Clustering analysis has been performed using response profiles from receptors that lead to potential novel applications including identification of the G-protein coupling of unknown GPCRs and the cataloging of active endogenous receptors in cell lines. Because the CDS assay requires no stable or transiently transfected cells or special reagents, assay development and data acquisition are simple and fast. These studies demonstrate that the CDS platform provides an easy-to-use, label-free, universal assay with applications in secondary screening, hit identification and lead optimization areas of drug discovery. The CellKey™ system, based on CDS technology, will be commercially available in late 2005. 29